Multi-Trend + Credit Risk DashboardHello This is showing 20,50,200 as well as some other useful indicators. hope you like it, its my first! D and P is discount or premium to nav
Candlestick analysis

Heikin Ashi + Real Price OverlayHeikin-Ashi + Real Price Overlay
This indicator combines the smooth trend visualization of Heikin-Ashi candles with the true market price for precise execution.
Features:
Heikin-Ashi Candles: Provides a clear, smoothed view of market trends and momentum.
Real Close Price Overlay: Plots the actual closing price as a line on top of HA candles, ensuring accurate entry, exit, and stop placement.
Trend-Based Coloring: The real price line is colored according to HA trend (green for bullish, red for bearish), making trend bias instantly visible.
Lightweight and ideal for scalping, day trading, or any strategy where trend bias + exact price matters.
Use Case:
Use HA candles to identify market bias and momentum.
Use the real price line for precise entries, exits, and stop levels.
Perfect for traders who want the clarity of HA without sacrificing real price accuracy.

Bravo Backtest - Multi Timeframe Fair Value GapsBravo Backtest – Multi Timeframe Fair Value Gaps
This indicator displays Fair Value Gaps (FVGs) across multiple timeframes, with a strong focus on clarity, structure, and non-repainting behavior.
To reduce noise and keep charts clean, only Fair Value Gaps from your current chart timeframe and higher are shown. Lower-timeframe imbalances are intentionally filtered out.
Key features:
- Multi-timeframe Fair Value Gap detection
- Wick-to-wick, three-candle FVG logic
- Non-repainting: all FVGs are confirmed on candle close
- Automatic removal of invalidated FVGs (close through the zone)
- Adjustable lookback period to limit historical zones
- Optional bullish / bearish filtering
- Optional borders that inherit the FVG color
- Clean, professional UI designed for real trading use
This tool is built to support higher-timeframe context, execution clarity, and disciplined charting, making it suitable for both discretionary traders and structured trading models.
Developed and verified by Bravo Backtest.

Auto Harmonic Patterns [Trader-Alex])This indicator is a sophisticated technical analysis tool designed to automate the identification of Harmonic Patterns across financial markets. By utilizing a multi-layered scanning engine, it detects valid geometric structures in price action, helping traders identify high-probability reversal zones (PRZ) with precision.
Whether you are a scalper or a swing trader, this tool streamlines the complex process of measuring Fibonacci ratios, allowing you to focus on execution rather than manual drawing.
Key Features
Multi-Scale Scanning Engine: The indicator runs 5 independent scanning groups simultaneously. This allows it to detect patterns across different market distinct market cycles (micro-structures to macro-trends) within a single timeframe.
Comprehensive Pattern Support: Automatically recognizes a wide range of classic and modern harmonic patterns, including:
Gartley
Bat & Alt Bat
Butterfly
Crab & Deep Crab
Shark
Cypher
Predictive PRZ Technology (Potential Patterns): Unlike standard indicators that only show completed patterns, this tool projects "Potential Patterns" in real-time. It calculates the Potential Reversal Zone (PRZ) based on converging Fibonacci projections, giving you a clear visual of where the D-point (Entry) is likely to form before price arrives.
Smart Filtering & Optimization: To maintain a clean chart, the indicator includes an intelligent filtering system. If multiple patterns are detected in the same area, it automatically evaluates the geometry and risk-to-reward ratio to display only the most optimal setup.
Integrated Trade Management: For every valid pattern, the indicator automatically plots:
Entry Level: The optimal completion point.
Stop Loss (SL): Calculated based on invalidation structures.
Take Profit (TP1 & TP2): Based on standard harmonic retracement targets.
Visual Clarity: Distinguishes between Bullish (Green/Blue tones) and Bearish (Red/Orange tones) setups. Successful historical patterns and currently developing patterns are visually distinct for easy back-testing and live trading.
Disclaimer This tool is for educational and informational purposes only. Trading financial markets involves risk. Past performance of harmonic patterns does not guarantee future results. Always use proper risk management.
-------------------------------------------------------------------------------------
此指標是一套高階的技術分析工具,專為自動化識別金融市場中的「諧波型態 (Harmonic Patterns)」而設計。透過多層次的掃描引擎,它能精準偵測價格行為中的幾何結構,協助交易者快速鎖定高勝率的潛在反轉區 (PRZ)。
無論您是短線交易者還是波段交易者,此工具都能簡化繁瑣的費波那契比例測量過程,讓您能專注於交易決策而非手動繪圖。
核心功能
多維度掃描引擎: 指標內建 5 組獨立的掃描運算邏輯,能夠同時運行。這意味著它能在單一圖表時間週期內,同時捕捉從小級別結構到大級別趨勢的各種型態。
支援多種經典型態: 自動識別市場上主流的諧波結構,包含:
加特利 (Gartley)
蝙蝠與變種蝙蝠 (Bat & Alt Bat)
蝴蝶 (Butterfly)
螃蟹與深海螃蟹 (Crab & Deep Crab)
鯊魚 (Shark)
賽福 (Cypher)
預測性 PRZ 技術 (潛在型態): 不同於一般指標僅顯示「已完成」的歷史型態,本工具具備即時預測功能。它能根據費波那契數列的匯聚點,計算出潛在反轉區 (PRZ),在價格到達前提前標示出預期的 D 點 (入場點)。
智能篩選與優化: 為了保持圖表整潔,指標內建智能過濾系統。當同一區域偵測到多個重疊型態時,系統會自動評估幾何結構與盈虧比,僅顯示條件最優異的一個交易機會。
整合式交易管理: 針對每一個有效型態,指標會自動計算並繪製:
入場價 (Entry): 型態完成的最佳價位。
止損位 (SL): 基於結構失效點的防守位置。
止盈位 (TP1 & TP2): 基於諧波回撤比例的標準獲利目標。
視覺化清晰呈現: 清楚區分看漲 (綠/藍色系) 與看跌 (紅/橙色系) 架構。歷史勝率回測線圖與正在發展中的潛在型態均有不同的視覺樣式,方便用戶進行複盤與實盤操作。
免責聲明 本工具僅供教學與輔助分析使用。金融市場交易具有風險,諧波型態的歷史表現不代表未來獲利保證。請務必做好個人風險管理。

HydraBot v1.2 publicenglish description english description english description english description english description english description english description english description english description

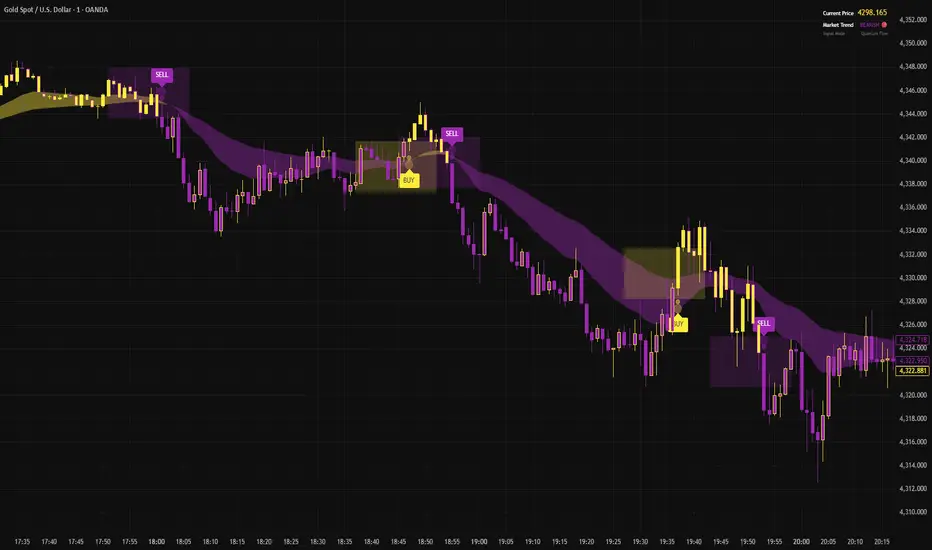
DisruptNEX Edge SystemDisruptNEX Edge System is an analytical overlay indicator designed to visualize market direction, trend maturity, exhaustion conditions, and impulse activity within a single, coherent framework.
The system is built as a structured analytical model rather than a collection of independent tools.
All visual elements are derived from a shared internal reference, ensuring consistency between trend context, exhaustion states, impulse activity, and higher-timeframe structure.
1. Market Regime & Trend Visualization
Illustration 1: Market regime visualization through candle coloring.
At the foundation of the system lies a price-centered baseline, computed as a windowed mid-range estimator with optional adaptive smoothing.
This baseline defines the current market regime:
Price above the baseline represents bullish directional pressure.
Price below the baseline represents bearish directional pressure.
The regime is expressed directly through candle coloring, allowing traders to visually identify the active trend without relying on additional overlays or separate panels.
This regime context acts as the primary reference for all subsequent components of the system.
2. Exhaustion Zones on the Price Chart
Illustration 2: Overbought / Oversold ribbons visualized directly on price.
DisruptNEX Edge System identifies potential exhaustion using a persistence-based evaluation of how consistently price holds above or below a volatility-adjusted reference.
Unlike oscillators displayed in a separate pane, exhaustion is visualized directly on the price chart using bounded ribbons.
Key characteristics of the exhaustion logic:
Overbought and Oversold states are detected as discrete state transitions.
Zones are marked at their initial appearance.
Visual persistence reflects state continuity rather than momentary fluctuations.
This approach helps traders assess when price reaches statistically stretched conditions relative to the active regime, often corresponding to areas where pullbacks or pauses may develop.
3. Candlestick Pattern Context
Illustration 3: Candlestick patterns displayed within the active trend context.
The system includes optional candlestick pattern detection displayed directly on the price chart as contextual information.
Patterns are evaluated relative to the active market regime and are commonly associated with short-term pauses, pullbacks, or localized price reactions within an existing trend.
Patterns are not interpreted as standalone reversal signals and do not provide trade instructions.
Their role is to complement trend context by highlighting moments where traders may choose to observe price behavior more closely.
4. Spark Impulses & Structural Reference Zones
Illustration 4: Spark impulses and dynamic structural reference zones.
Spark impulses highlight moments when directional pressure increases within the active market regime.
They are derived from a volatility-normalized measure of price displacement relative to the internal baseline and evaluated across multiple smoothing horizons.
This allows the system to identify shifts in directional activity rather than isolated price fluctuations.
Spark impulses commonly appear after consolidation, pullbacks, or localized hesitation and act as analytical confirmation that market activity is resuming in a given direction.
Alongside impulse visualization, the system derives dynamic structural reference levels based on recent price behavior and volatility.
These levels are updated only on the most recent bar and represent contextual support and resistance zones.
Structural reference levels are not predictive targets.
They serve as spatial guides, helping traders evaluate price positioning relative to recent structure and impulse activity.
5. Trend Power & Multi-Timeframe HUD
Illustration 5: Right-side HUD summarizing multiple timeframes.
The indicator includes a compact HUD panel that aggregates key structural information across multiple timeframes:
Overbought / Oversold state
Trend Power level
Trend direction
Trend Power quantifies how extended the current regime is by measuring price progression since the last confirmed regime change, normalized by volatility and mapped to a bounded scale.
This allows traders to distinguish between developing, established, and extended trends, while the multi-timeframe layout helps assess alignment between the current chart and higher-level market structure.
How to Read the Indicator
Start by observing candle coloring to identify the active market regime.
Use exhaustion ribbons to recognize areas where price may pause or pull back relative to the regime.
Treat candlestick patterns as contextual signals highlighting potential short-term reactions.
Look for Spark impulses as confirmation of renewed directional activity.
Use structural reference zones as orientation points when evaluating price location.
Consult the HUD to check trend direction, maturity, and exhaustion across higher timeframes.
Alerts & Usage Notes
Alerts are event-based and triggered only on confirmed state changes, including:
Regime transitions
Exhaustion state entries
Candlestick pattern detection
Spark impulse events
Important Notes
DisruptNEX Edge System is not an automated trading system.
It does not execute trades or provide trade instructions.
All outputs are analytical and visual in nature and are intended to support discretionary decision-making.

NY LONDON LUNCH AUTO**NY London Lunch Auto** is a precision session-anchor indicator designed for traders who focus on institutional timing and liquidity behavior.
This script automatically marks the **high and low of three key 15-minute New York session candles**:
• **3:00 AM NY** — London session expansion
• **8:00 AM NY** — New York open / kill zone
• **2:00 PM NY** — NY lunch / power hour transition
Each time one of these candles prints on the **15-minute chart**, the script captures its exact high and low and extends them forward as horizontal levels.
The levels remain **locked and unchanged** until the next key session candle appears, ensuring clean, non-repainting reference zones.
### Key Features
• Works **exclusively on the 15-minute timeframe**
• Automatically updates at **3AM, 8AM, and 2PM NY time**
• Levels stay fixed — no drifting or recalculation
• Clean, minimal design with customizable colors
• Ideal for liquidity sweeps, displacement, and ICT-style execution models
This indicator is built for traders who want **clarity, patience, and structure**, not clutter. It pairs seamlessly with liquidity sweep, displacement, and fair value gap strategies.

Sustained 200 SMA Cross (Locked to Daily)For individuals looking to track trend changes against the 200 day simple moving average. We are measuring 5 consecutive days changing from the above or below the 200 day SMA as a flag for a potential shift in trend.

HydraBot v1.2average bias of a bunch of indicators that blah blah blah i need to hit at least so many words to publish this

Wavelet Candle Constructor (Inc. Morlet) 2Here is the detailed description of the **Wavelet Candle** construction principles based on the code provided.
This indicator is not a simple smoothing mechanism (like a Moving Average). It utilizes the **Discrete Wavelet Transform (DWT)**, specifically the Stationary variant (SWT / à Trous Algorithm), to separate "noise" (high frequencies) from the "trend" (low frequencies).
Here is how it works step-by-step:
###1. The Wavelet Kernel (Coefficients)The heart of the algorithm lies in the coefficients (the `h` array in the `get_coeffs` function). Each wavelet type represents a different set of mathematical weights that define how price data is analyzed:
* **Haar:** The simplest wavelet. It acts like a simple average of neighboring candles. It reacts quickly but produces a "boxy" or "jagged" output.
* **Daubechies 4:** An asymmetric wavelet. It is better at detecting sudden trend changes and the fractal structure of the market, though it introduces a slight phase shift.
* **Symlet / Coiflet:** More symmetric than Daubechies. They attempt to minimize lag (phase shift) while maintaining smoothness.
* **Morlet (Gaussian):** Implemented in this code as a Gaussian approximation (bell curve). It provides the smoothest, most "organic" effect, ideal for filtering noise without jagged edges.
###2. The Convolution EngineInstead of a simple average, the code performs a mathematical operation called **convolution**:
For every candle on the chart, the algorithm takes past prices, multiplies them by the Wavelet Kernel weights, and sums them up. This acts as a **digital low-pass filter**—it allows the main price movements to pass through while cutting out the noise.
###3. The "à Trous" Algorithm (Stationary Wavelet Transform)This is the key difference between this indicator and standard data compression.
In a classic wavelet transform, every second data point is usually discarded (downsampling). Here, the **Stationary** approach is used:
* **Level 1:** Convolution every **1** candle.
* **Level 2:** Convolution every **2** candles (skipping one in between).
* **Level 3:** Convolution every **4** candles.
* **Level 4:** Convolution every **8** candles.
Because of this, **we do not lose time resolution**. The Wavelet Candle is drawn exactly where the original candle is, but it represents the trend structure from a broader perspective. The higher the `Decomposition Level`, the deeper the denoising (looking at a wider context).
###4. Independent OHLC ProcessingThe algorithm processes each component of the candle separately:
1. Filters the **Open** series.
2. Filters the **High** series.
3. Filters the **Low** series.
4. Filters the **Close** series.
This results in four smoothed curves: `w_open`, `w_high`, `w_low`, `w_close`.
###5. Geometric Reconstruction (Logic Repair)Since each price series is filtered independently, the mathematics can sometimes lead to physically impossible situations (e.g., the smoothed `Low` being higher than the smoothed `High`).
The code includes a repair section:
```pinescript
real_high = math.max(w_high, w_low)
real_high := math.max(real_high, math.max(w_open, w_close))
// Same logic for Low (math.min)
```
This guarantees that the final Wavelet Candle always has a valid construction: wicks encapsulate the body, and the `High` is strictly the highest point.
---
###Summary of ApplicationThis construction makes the Wavelet Candle an **excellent trend-following tool**.
* If the candle is **green**, it means that after filtering the noise (according to the selected wavelet), the market energy is bullish.
* If it is **red**, the energy is bearish.
* The wicks show volatility that exists within the bounds of the selected decomposition level.
Here is a descriptive comparison of **Wavelet Candles** against other popular chart types. As requested, this is a narrative explanation focusing on the differences in mechanics, interpretation philosophy, and the specific pros and cons of each approach.
---
###1. Wavelet Candles vs. Standard (Japanese) CandlesThis is a clash between "the raw truth" and "mathematical interpretation." Standard Japanese candles display raw market data—exactly what happened on the exchange. Wavelet Candles are a synthetic image created by a signal processor.
**Differences and Philosophy:**
A standard candle is full of emotion and noise. Every single price tick impacts its shape. The Wavelet Candle treats this noise as interference that must be removed to reveal the true energy of the trend. Wavelets decompose the price, reject high frequencies (noise), and reconstruct the candle using only low frequencies (the trend).
* **Wavelet Advantages:** The main advantage is clarity. Where a standard chart shows a series of confusing candles (e.g., a long green one, followed by a short red one, then a doji), the Wavelet Candle often draws a smooth, uniform wave in a single color. This makes it psychologically easier to hold a position and ignore temporary pullbacks.
* **Wavelet Disadvantages:** The biggest drawback is the loss of price precision. The Open, Close, High, and Low values on a Wavelet candle are calculated, not real. You **cannot** place Stop Loss orders or enter trades based on these levels, as the actual market price might be in a completely different place than the smoothed candle suggests. They also introduce lag, which depends on the chosen wavelet—whereas a standard candle reacts instantly.
###2. Wavelet Candles vs. Heikin AshiThese are close cousins, but they share very different "DNA." Both methods aim to smooth the trend, but they achieve it differently.
**Differences and Philosophy:**
Heikin Ashi (HA) is based on a simple recursive arithmetic average. The current HA candle depends on the previous one, making it react linearly.
The Wavelet Candle uses **convolution**. This means the shape of the current candle depends on a "window" (group) of past candles multiplied by weights (Gaussian curve, Daubechies, etc.). This results in a more "organic" and elastic reaction.
* **Wavelet Advantages:** Wavelets are highly customizable. With Heikin Ashi, you are stuck with one algorithm. With Wavelet Candles, you can change the kernel to "Haar" for a fast (boxy) reaction or "Morlet" for an ultra-smooth, wave-like effect. Wavelets handle the separation of market cycles better than simple HA averaging, which can generate many false color flips during consolidation.
* **Wavelet Disadvantages:** They are computationally much more complex and harder to understand intuitively ("Why is this candle red if the price is going up?"). In strong, vertical breakouts (pumps), Heikin Ashi often "chases" the price faster, whereas deep wavelet decomposition (High Level) may show more inertia and change color more slowly.
###3. Wavelet Candles vs. RenkoThis compares two different dimensions: Time vs. Price.
**Differences and Philosophy:**
Renko completely ignores time. A new brick is formed only when the price moves by a specific amount. If the market stands still for 5 hours, nothing happens on a Renko chart.
The Wavelet Candle is **time-synchronous**. If the market stands still for 5 hours, the Wavelet algorithm will draw a series of flat, small candles (the "wavelet decays").
* **Wavelet Advantages:** They preserve the context of time, which is crucial for traders who consider trading sessions (London/New York) or macroeconomic data releases. On a wavelet chart, you can see when volatility drops (candles become small), whereas Renko hides periods of stagnation, which can be misleading for options traders or intraday strategies.
* **Wavelet Disadvantages:** In sideways trends (chop), Wavelet Candles—despite the smoothing—will still draw a "snake" that flips colors (unless you set a very high decomposition level). Renko can remain perfectly clean and static during the same period, not drawing any new bricks, which for many traders is the ultimate filter against overtrading in a flat market.
###Summary**Wavelet Candles** are a tool for the analyst who wants to visualize the **structure of the wave and market cycle**, accepting some lag in exchange for noise reduction, but without giving up the time axis (like in Renko) or relying on simple averaging (like in Heikin Ashi). It serves best as a "roadmap" for the trend rather than a "sniper scope" for precise entries.

Displacement## Displacement Indicator (Institutional Momentum Filter)
This indicator highlights **true price displacement** — candles where price moves with **abnormal force relative to recent volatility**.
It is designed to help traders distinguish **real momentum** from normal market noise.
Displacement often precedes:
- Breaks of structure
- Fair Value Gaps (FVGs)
- Strong continuation or meaningful pullbacks
This tool focuses on **confirmation**, not prediction.
---
### 🔍 How Displacement Is Defined
A candle is marked as *displacement* only when **all conditions are met**:
• Candle body is larger than a multiple of ATR (volatility-adjusted)
• Candle body makes up a high percentage of the full candle (strong close)
• Directional conviction (bullish or bearish close)
This filters out:
- Small or average candles
- Wick-heavy indecision
- Low-quality breakouts
---
### 🎯 What This Indicator Is Best Used For
✔ Confirming impulsive moves
✔ Validating structure breaks
✔ Anchoring Fair Value Gaps
✔ Filtering low-probability setups
✔ Identifying institutional participation
Works best on **M5, M15, and H1**, especially during **London and NY sessions**.
---
### ⚠️ Important Notes
• This is **not** a buy/sell signal by itself
• Best used with trend, structure, or liquidity context
• Not designed for ranging or low-volatility markets
Think of this indicator as a **momentum truth filter** —
if displacement is missing, conviction is likely missing too.
---
### ⚙️ Inputs Explained
• ATR Length – defines normal volatility
• ATR Multiplier – how aggressive displacement must be
• Minimum Body % – ensures strong candle closes
All inputs are adjustable to fit different markets and styles.
---
### 🧠 Philosophy
Displacement reflects **commitment**, not anticipation.
This tool helps you wait for **proof**, not hope.
---
If you want, I can:
- Tighten this for **ICT-style language**
- Rewrite for **beginner clarity**
- Add a **“How I personally use it”** section
- Optimize it for **TradingView algorithm visibility**
**Tell me which you want changed.**

Renko with Multi-Timeframe RSI (Non-Repaint)This is a Renko-based Multi-Timeframe RSI indicator with Inverted Volatility Oscillator that combines three technical analysis concepts to provide trading signals without repainting issues.
Core Components
1. Renko Chart Foundation
Instead of using time-based candles, this indicator creates Renko bricks based on price movement:
Green brick = Price moved up by one brick size
Red brick = Price moved down by one brick size
Brick size = Either ATR-based (dynamic) or fixed value
Key advantage: Filters out market noise by ignoring time and small price fluctuations
Non-Repaint Feature: Only processes confirmed bars (barstate.isconfirmed), ensuring signals don't disappear or change after they appear.
2. Volume-Weighted RSI (Multiple Timeframes)
Three RSI calculations:
a) Renko RSI (Purple line)
Calculated directly from Renko brick close prices
Shows momentum based on actual brick formations
More stable than traditional RSI since it's based on significant price moves
b) 1-Hour RSI (Blue line)
Standard RSI from 1-hour timeframe
Provides medium-term momentum context
c) 4-Hour RSI (Orange line)
Standard RSI from 4-hour timeframe
Shows longer-term momentum trends
RSI Interpretation:
Above 70: Overbought (potential sell signal)
Below 30: Oversold (potential buy signal)
Above 50: Bullish momentum
Below 50: Bearish momentum
3. Inverted Volatility Oscillator (Yellow line)
Measures the opposite of price volatility in Renko brick closes:
What It Actually Is:
Simply calculates volatility (standard deviation of rate of change)
Normalizes it to 0-100 scale
Inverts it (100 minus volatility)
Result: When prices are volatile, the number is LOW. When prices are calm, the number is HIGH.
This is just repackaged volatility:
Above 80: Low volatility period (calm, stable prices)
50-80: Below-average volatility
20-50: Above-average volatility
Below 20: High volatility period (choppy, erratic prices)
The "Fear/Greed" Marketing: The assumption is that high volatility = panic/fear, and low volatility = complacency/greed. But this is just a narrative wrapper around basic volatility measurement. Markets can be:
Highly volatile during euphoric rallies (not fear)
Very calm during sustained downtrends (not greed)
The relationship between volatility and sentiment is assumed, not measured.
How It Works
Signal Generation
Buy Signals occur when:
Renko RSI < 30 (oversold) OR
1H RSI < 30 OR
4H RSI < 30 OR
Inverted Volatility < 20 (high volatility = "extreme fear")
Sell Signals occur when:
Renko RSI > 70 (overbought) OR
1H RSI > 70 OR
4H RSI > 70 OR
Inverted Volatility > 80 (low volatility = "extreme greed")
Exit Conditions:
Brick color changes (green→red or red→green)
Any RSI enters opposite extreme zone
Multiple confirmations increase signal reliability
What You're Actually Getting
Legitimately Useful:
Renko filtering: Real noise reduction
Multi-timeframe RSI: Valid momentum confirmation across timeframes
Non-repainting: Reliable signal timing
Marketing Fluff: The "Fear/Greed Index" is:
Just normalized, inverted volatility
Given emotional labels to sound sophisticated
Based on an assumption (volatility = fear) that's often wrong
No actual measurement of fear, greed, sentiment, or psychology
Adds no information you couldn't get from a standard volatility indicator
Reality Check
What the indicator claims: "Fear/Greed Index measures market psychology"
What it actually does: Calculates volatility of Renko closes, flips the scale, and slaps emotional labels on different levels
Better description: "Low Volatility Warning" (>80) and "High Volatility Warning" (<20)
The indicator works fine as a multi-timeframe RSI system with Renko smoothing. The volatility component can be useful for identifying regime changes. But calling it "Fear/Greed" is pure marketing - it's just repackaged volatility with psychology buzzwords.
Bottom Line
Use this for:
Renko trend following (genuinely useful)
Multi-timeframe momentum confirmation (valid approach)
Volatility regime detection (what the yellow line actually measures)
Don't use this thinking:
It reads market psychology (it doesn't)
It's measuring actual fear or greed (it isn't)
It's anything more than inverted volatility (it's not)
// ============ DISCLAIMER ============
// EDUCATIONAL PURPOSE ONLY - NOT FINANCIAL ADVICE
// This indicator is provided for educational and informational purposes only.
// It does NOT constitute financial, investment, trading, or any other type of advice.
//
// PAST PERFORMANCE IS NOT INDICATIVE OF FUTURE RESULTS
// No trading system or indicator can guarantee profits or prevent losses.
//
// RISKS:
// - Trading and investing involve substantial risk of loss
// - You can lose some or all of your invested capital
// - Only trade with money you can afford to lose
// - Indicators can produce false signals and lag price action
//
// "FEAR/GREED INDEX" DISCLAIMER:
// The so-called "Fear/Greed Index" is simply inverted normalized volatility.
// It does NOT actually measure fear, greed, sentiment, or market psychology.
// It is a mathematical calculation based on price volatility with emotional
// labels applied for marketing purposes. The relationship between volatility
// and sentiment is ASSUMED, not measured or proven.
//
// NO REPAINTING GUARANTEE:
// While designed to avoid repainting, no indicator is perfect. Always verify
// signals on confirmed bars and test thoroughly before live trading.
//
//(RESPONSIBILITY):
// By using this indicator, you acknowledge that:
// - All trading decisions are your own responsibility
// - You have tested this indicator on historical data
// - You understand the risks involved in trading
// - The creator(s) of this indicator are not liable for any losses
//
// ALWAYS:
// - Do your own research and due diligence
// - Consult with qualified financial professionals
// - Use proper risk management and position sizing
// - Never risk more than you can afford to lose
// - Practice on paper/demo accounts before live trading
// =======================================

Master Moving Averages PlusThe Master Moving Averages indicator is a full-session, moving-average–driven market structure engine that combines 1) Heiken Ashi Candlesticks, 2)Exponential Moving Averages, 3)Session Backgrounds, 4)VWAP, 5)EMA Streams, 6)EMA Crossing Labels, 7)All-Inside EMA Labels, 8)Price Control Logic (Bundles, Momentum, Reversals), and 9)Heavy EMA anchors into a single chart framework. The indicator provides access to toggle these features on and off in the settings gear icon to the right of the indicator name in the screen panel.
1)Because this chart uses Heikin Ashi candlesticks, the behavior is slightly different from standard candles. Heiken Ashi candles are smoothed, meaning each candle is influenced by the previous one. This reduces noise and makes trends easier to see. In practice, long sequences of same-color candles with small or no opposite wicks indicate strong, sustained movement, while smaller bodies or the appearance of opposite wicks signal slowing or transition. Opposite wicks are wicks that appear against the current direction of the move. In an upward move, an opposite wick is a wick on top of the candle. It shows that upward progress is no longer clean and momentum is starting to slow. In a downward move, an opposite wick is a wick on the bottom of the candle. It shows that downward progress is slowing.
With Heiken Ashi candles, opposite wicks are especially important because they do not appear easily. When one shows up, it often marks loss of trend quality, a pause, or the beginning of a transition rather than a random fluctuation. Ashi wicks still matter, but they emphasize trend quality rather than single-bar reactions, making them especially useful for staying in moves longer and avoiding premature exits caused by random price spikes. Candlesticks are a visual record of price behavior over one bar, showing where price opened, traded, and closed. The body shows the meaningful part of the move—the distance between open and close—and tells whether price made progress during that bar. Large bodies indicate clean movement and follow-through, while small bodies indicate slowing or uncertainty. The wicks show where price traveled but did not stay. Wicks in the direction of the move are normal and usually appear during healthy trends, while wicks against the move signal slowing, hesitation, or loss of momentum. A candle with a large body and small wicks reflects strong continuation, whereas long wicks with a small body suggest pause, balance, or transition. Candlesticks are not signals by themselves; they are read bar-to-bar to judge whether a move is continuing, slowing, or stalling, helping decide whether to stay in a trade, manage risk, or wait for clearer structure.
For example, suppose price is moving higher and already in a long trade. Several candles print with solid bodies and small lower wicks, showing steady upward progress. This is healthy continuation, so staying in the trade makes sense. Then a candle prints with a small body and a long upper wick. Price pushed higher during the bar but could not hold those levels by the close. That candle does not mean reverse now, but it does mean momentum is slowing. The practical response is to stay in but be alert—do not expect the same speed of continuation. If the next candle prints another upper wick or a small body, the move is likely stalling. If instead the next candle closes strong with a large body, the trend has resumed.
2)An Exponential Moving Average (EMA) is a moving average that tracks price but gives more weight to the most recent bars. In plain terms: it reacts faster to what price is doing right now than a simple average (SMA) does. Here’s what that means in practice: Every EMA is an average of price over a set number of bars The "exponential" part means the newest candles matter more than older ones. Because of that weighting, an EMA turns sooner, crosses sooner, and shows shifts in directional control sooner. On the chart specifically: Short EMAs (like 4, 9, 16) respond quickly → they show immediate pressure. Mid EMAs (24, 36, 48) show follow-through or failure. Long EMAs (72 and up) change slowly → they define structure and context, often showing the explosive nature of building pressure signaling entries.
3)Session Background gives context to which part of the trading day the current bar or candlestick belongs to. The script separates the day into: Pre-Session, After-Hours and Regular Trading Hours (RTH). Price acts differently depending on the session. Session context is shown on the chart by 1️⃣ Background shading. The lighter background → Pre-session or Pre-Market (PM) and After-hours (AH). The darker background → RTH (Regular Trading Hours). One glance tells you where you are in the day. 2️⃣ Different sessions build different levels of highs and lows: Pre-Session High and Low is built only during After Hours (AH) and pre-market hours (PM). Session High and Low is built only during RTH. Previous Day Session High and Low is carried forward into today. These provide perspective during the session. Sometimes price respects pre-session highs and lows and even previous day session highs and lows— especially immediately following opening in the initial move and retracement. Session context just means knowing whether a particular candlestick bar was or is pre-market, regular hours, or after-hours — because the rules change. It's just a check on where you are.
4)VWAP stands for Volume Weighted Average Price. It is the session’s true average price — weighted by where the volume actually traded. Not yesterday, not overnight, only during Regular Trading Hours. Every share traded during Reg Trading Hours (RTH) pulls VWAP toward it. The VWAP on this chart resets at the RTH open. VWAP uses the average price of each bar, then lets the bars with real volume count more. The calculation is High+ Low+ Close/3. High, Low, Close are added together and averaged. So instead of picking just the close or just the high, it uses the middle of where price actually traded during that bar. The equation looks like this: hlc3 × volume. It only updates during the day session. Overnight and pre-market do not contaminate it. So VWAP belongs to today’s fight only. On the chart it looks like a thick orange line outlined in white. There is a right-side label that reads: VWAP | Bullish / Bearish / Neutral.
In practice VWAP is a 1️⃣ Fair price reference that shows where the bulk of business has been done because if Price is above it → trading is happening at higher-than-average prices. If Price is below it → trading is happening at lower-than-average prices. Fair price is the price level where the most of the trading has actually occurred during the session. It's not a prediction.
It's not a target. It's not a value judgment. It's just where buyers and sellers have been most active. 2️⃣ VWAP slope is smoothed and classified: Rising → Bullish, Falling → Bearish, Flat → Neutral. This doesn’t fire signals — it confirms pressure. VWAP shows where today’s real money has traded and whether that price is drifting up, down, or going nowhere.
The right-side VWAP label summarizes everything in one place: trend state, price distance from VWAP (percentage), and slope strength with direction arrows, allowing quick assessment without clutter. Practically, VWAP is used as a fair-value anchor and intraday control reference—price holding above a rising VWAP supports continuation, price below a falling VWAP supports downside pressure, and flat VWAP conditions warn of rotation or chop rather than trend.
5)EMA (Exponential Moving Average) Streams in this script are a visual state. They are the shaded bands between specific EMA pairs that show: direction, pressure, and alignment. The stream shows the relationship of the pairs. In the script the streams are: 4–9, 9–16, 16–24, 24–36 EMA'S. Each one can be turned on or off. On the chart they look like two EMAs with soft shaded fill between them and color changes based on up or down movement. The stream mechanically is telling 1️⃣ Direction. If the pair is above price they push down, if below price they push up. Each stream is made of two EMAs: One reacts faster, one reacts slower, but they’re doing the same thing. For Example a 4 EMA takes the last 4 candlesticks and averages them; likewise a 9 EMA takes the last 9 candlesticks and averages them yielding two lines, one that moves quicker and one that moves slower. When a slower EMA crosses above a faster EMA it drives price down. When a slower EMA crosses below a faster EMA it drives price up. 2️⃣ Pressure: EMA streams show pressure leaning on price. Wide stream → pressure is expanding. Tight stream → pressure is compressing. Compression matters because it precedes movement.
6)EMA Crossing Labels (Pivots, EMA9, EMA16, EMA24) mark an actual EMA crossover event. The Crossing Labels are white labels attached below or above the candlestick showing price direction. They print only when one EMA physically crosses the price control line. The price control line is a default on the chart and is constant. The priceControlLine = (open + close) / 2. The crossing is confirmed on bar close. If, for example, EMA-16 rolls over the priceControlLine and crosses downward, the label fires indicating that price has stalled or shifted, buyers have lost control, sellers are in control, and the market is trending short. If EMA-24 and EMA-36 follow, pressure is stacking, multiple timeframes confirm, pullbacks become weaker, and price is more likely to continue in the same direction.
7)An Inside EMA label can represent two very different conditions, and context matters. When shorter ranges (such as 9–36, 9-48, or 9–72) compress inside a candle during sideways or low-energy price action, it often reflects chop or rotation, and no immediate expansion is required. In contrast, when deeper ranges (9–106, 9–139, 9–192) collapse inside a single candle—especially near the open or during active sessions—it usually occurs because price is moving faster than the EMAs can respond, signaling elevated energy and the potential for rapid continuation or transition. Practically, Inside labels are conditional triggers: shallow compression can persist, while deep compression demands attention because resolution, when it comes, tends to be decisive.
Example 1: Fast open, real urgency— The market opens and within the first few candles a 9–139 Inside label prints. Price has already moved aggressively, and all EMAs are trapped inside one candle body. In real terms, this means structure has been run over. The practical response is immediate attention: do not hesitate, do not wait for EMAs to fan out. Expect either a fast continuation (often followed quickly by a Bundle or Momentum label) or a sharp stall if momentum fails. Speed matters because the next decision point arrives quickly.
Example 2: Mid-day chop, no urgency—Later in the session, price is rotating sideways and a 9–72 Inside label appears. Price has not traveled far, candles overlap, and no expansion follows. In this case, the label simply confirms compression without pressure. The correct action is no action—continue waiting. No urgency, no expectation of immediate resolution.
Example 3: Transition point—After a trend, a 9–106 Inside prints as bodies shrink. Momentum is already slowing. Here the label marks a transition zone. The practical move is to stop expecting continuation and watch closely: a Momentum or Bundle label confirms continuation, while a Reversal label confirms control change.
8)Price Control Logic is determined by three things working together and the Bundle, Momentum, and Reversal labels are expressions of that control:
1️⃣ Price vs the Price Control Line: The Price Control Line is the midpoint of the candle body. When Price is above it → buyers are controlling closes. When Price is below it → sellers are controlling closes.
2️⃣ EMA Position Relative to Control: When EMAs cross the Price Control Line: EMA crosses up through control → momentum is shifting to buyers. EMA crosses down through control → momentum is shifting to sellers. That’s why labels fire only on those crosses. It marks real control shifts, not wicks.
3️⃣ EMA Stack & Compression: Tight EMA bundles inside the candle body means no one has control yet. EMAs expanding upward means buyers are gaining control. EMAs expanding downward means sellers are gaining control. This is pressure building vs pressure releasing.
Bundle, Momentum, and Reversal labels are confirmation markers, not prediction signals. A Bundle label prints when a compressed EMA cluster (16/24/36/48) resolves back into price with real body momentum and EMA-16 already trending, signaling stored pressure releasing. A Momentum label prints only on sharp expansion, where the candle body is significantly larger than the prior bar, confirming acceleration in the existing direction. A Reversal label marks a true short-term control shift, where EMA-16 flips slope with a momentum candle, signaling buyers and sellers have swapped control—not a wick reaction. Because all labels require body dominance and EMA agreement, they often appear after movement begins, making them reliable tools for confirming pressure, continuation, or control change rather than early entry timing. Visually, each label reinforces direction at a glance. Bullish labels are green, placed below the candle, and use an upward-pointing shape to indicate rising pressure. Bearish labels are red, placed above the candle, and use a downward-pointing shape to indicate falling pressure. Labels sit just off the candle body so price remains clear, and their color, placement, and shape always align with the direction of control.
9) Heavy EMA anchors are the big EMAs. They act like fixed reference points while everything else whips around them. The heavy EMA anchors in this chart are EMA 768,1024, 1250, 1536, 2048, 2700, 3300, 4096. They are displayed only as right-side tags at their current price levels, not as plotted lines. These tags sit on the far right edge of the chart, aligned with the price scale, and are color-matched to their respective EMAs. Their purpose is to show where slow, heavy pressure exists without cluttering price action with lines. When these EMA tags are bundled together and price is trading inside that cluster, the market is compressed and choppy. When the tags separate and price holds above or below the group, structure is returning and directional movement becomes easier. Keeping the tags visible provides instant awareness of whether price is trapped or free, helping filter noise and align the rest of the indicator with the larger structure at all times.

First Candle + FVGs🕯️ First Candle + 🟢🔴 FVG (Gated After Breakout)
Must be traded on the 1-minute timeframe.
• Step 1: At 9:30 AM NY time, the indicator starts tracking the first 15-minute range (9:30–9:45).
• Step 2: At 9:45 AM, it locks that range and draws two horizontal lines: First Candle High and First Candle Low.
• Step 3: The FVG logic is OFF until price breaks outside that locked range (above the high or below the low).
• Step 4: After the breakout happens, the FVG logic turns ON for the rest of the day.
• Step 5: The indicator detects bullish or bearish FVGs, but shows only one direction at a time:
• If a bullish FVG triggers → all bearish drawings are cleared/hidden.
• If a bearish FVG triggers → all bullish drawings are cleared/hidden.
• Step 6: For each active FVG, it plots:
• The FVG box
• The entry line (BUY or SELL)
• The stop-loss line (default light orange, using your selected SL rule)
• A number label for the FVG sequence
• Step 7: It resets everything on the next NY trading day and starts over.

First Candle's FVGsBull & Bear FVG – One at a Time
This indicator is rule #1 designed to be used with the First 15-Minute Candle indicator. It’s intended strictly for the 1-minute timeframe and should only be applied after 9:45 AM.
In other words, once the market breaks outside the high or low of the first 15-minute candle of the day, that’s when this FVG logic kicks in. It will detect either bullish or bearish Fair Value Gaps and display only one direction at a time: hiding bearish levels when bullish is active and hiding bullish levels when bearish is active.
In short, it waits for the market to break that initial 15-minute range and then helps you focus on a single FVG direction at a time for cleaner and simpler trading.

SCOTTGO - RVOL Bull/Bear Painter (Real-Time) SCOTTGO - RVOL Bull/Bear Painter (Real-Time Momentum Detection)
📌Overview
The RVOL Bull/Bear Painter is a Pine Script indicator designed to instantly highlight high-momentum candles driven by significant Relative Volume (RVOL).
It provides a clear visual signal (bar color, shape, and label) when a candle's volume exceeds its average by a user-defined threshold, confirming strong bullish or bearish interest in real-time. This helps traders quickly identify potential institutional accumulation/distribution or breakout/breakdown attempts.
✨ Key Features
Relative Volume (RVOL) Calculation: Automatically calculates the ratio of the current bar's volume to its moving average (SMA or EMA) over a customizable lookback period.
Momentum Confirmation: Paints the candle green (bullish) or red (bearish) only when both price direction and high RVOL criteria are met.
Real-Time Detection: Uses a plotshape method to display the signal triangle as soon as the RVOL and direction conditions are met on the currently forming candle, aiming for faster alerts than bar-close coloring.
Customizable Threshold: Easily adjust the RVOL multiplier (e.g., 1.5x, 2.0x, 3.0x) to filter out noise and only focus on truly significant volume events.
Labels and Alerts: Displays a volume multiplier label (e.g., BULL 2.55x) and includes pre-configured alert conditions for automated notifications.
🛠️ How to Use It
1. Identify High-Conviction Moves
Look for the painted candles and the corresponding labels. A candle painted green with a BULL label (e.g., BULL 2.5x) indicates that buyers stepped in with 2.5 times the typical volume to drive the price higher.
2. Configure Your Sensitivity
The power of the script lies in customizing the inputs:
RVOL Lookback Period: Determines the length of the volume moving average.
Shorter periods (e.g., 9-20) make the indicator more reactive to recent volume changes.
Longer periods (e.g., 50-200) require a much larger volume spike to trigger a signal.
RVOL Threshold: This is the multiplier.
Lower values (e.g., 1.5) will generate more signals.
Higher values (e.g., 3.0) will generate fewer, but generally higher-conviction, signals.
3. Set Up Alerts
Use the pre-configured alert conditions (Bullish RVOL Signal and Bearish RVOL Signal) in TradingView's alert menu. Crucially, set the alert frequency to "Once per bar" or "Once per minute" to receive notifications as soon as the high RVOL event occurs, without waiting for the bar to close.

Raeinex Momentum Liquidity IndexEntry arrow signals with volumetric momentum (buying and selling pressure) and the possibility to use all entry signals as liquidity area for price retest.

Unfinished Candles (UNF) CustomizableMarks out candles with no top/bottom wick with customisable tolerance.
Customisable colours and other features.

fenxingFractal Sequence Trading System (Final Stable Version) identifies trends formed by two consecutive fractals based on three or five candlesticks.

SmartMoney BOS Pro [Stansbooth]
## ✨ BOS + ICT RSI Indicator — Trade Like Smart Money ✨
The market doesn’t move randomly — it moves with **structure**, **liquidity**, and **institutional intent**.
This indicator is built to help you see exactly that.
Powered by **Break of Structure (BOS)** and advanced **ICT concepts**, this tool highlights when the market is truly shifting direction or continuing with strength — the same way **smart money** trades.
To make every setup even stronger, a **smart RSI confirmation** is seamlessly integrated, helping you stay out of weak trades and focus only on **high-quality, high-probability opportunities**.
### 🔥
What Makes It Special?
• Clear and accurate BOS signals
• ICT-based market structure & liquidity insight
• RSI confirmation to reduce false entries
• Clean visuals — no clutter, no confusion
• Designed for scalpers, intraday & swing traders
🎯
Who Is This For?
If you’re tired of lagging indicators…
If you want to understand **why** price moves…
If you want to trade with confidence instead of guessing…
This indicator is for you.
📊
Markets Supported:
Forex • Crypto • Stocks • Indices
Stop chasing price.
Start trading ** structure, liquidity, and smart money**.
🚀 **See the market differently. Trade better.**
Monday Tuesday Initial Balance and Range ProjectionsThis indicator is based on Stacey Burke’s definition of Initial Balance, where Monday and Tuesday together establish the Initial Balance for the trading week.
The high and low formed across Monday and Tuesday define the Initial Balance. Once Tuesday closes, this range is locked in and used as a structural reference for the remainder of the week.
What the Indicator Displays
Initial Balance High (Monday–Tuesday high)
Initial Balance Low (Monday–Tuesday low)
Optional midpoint
Optional range projections:
0.5 range extension to the upside/downside
1.0 range extension to the upside/downside
These extensions are calculated using the Monday–Tuesday range, projected above the Initial Balance High.
Why This Matters
In a large percentage of weeks:
The weekly high or low is established by Monday or Tuesday
One side of the Initial Balance tends to hold, while the other may break and trend
The range provides context for high-probability setups, not trade signals
Price will typically:
Reject the Initial Balance extremes (reversal / three-day setup)
Break and hold outside the balance (trend week)
Rotate within the balance (consolidation)
How to Use It
This tool is designed for context and structure, supporting:
Three Day Setups
First Green / First Red Days
False breaks
Weekly pump-and-dump / dump-and-pump scenarios
Trade execution should still be aligned with session timing, 15-minute structure, price action confirmation, and news awareness.

Tails and WicksTails and Wicks 📊
A clean price action tool that spots strong wick rejection candles and draws semi-transparent colored boxes around their high-to-low range. 🔍
Boxes extend forward to highlight potential S/R zones – perfect for pinbars, hammers, shooting stars & indecision dojis! 🚀
Features:
• 🟢 Bullish tails (long lower wick – default green)
• 🔴 Bearish tails (long upper wick – default red)
• 🟠 Indecision (both long wicks – default orange)
• Independent toggles & custom colors 🎨
• Adjustable wick % threshold (default 60%)
• Fixed or infinite right extension ➡️
• Limit recent zones per type (default 4) to keep charts tidy 🧹
• Pure visual – no text clutter (disable "Labels on price scale" in indicator Style tab if needed)
Lightweight, customizable, and great for clean price action trading! 💹

Timeframe Overlay 24HrDaily High–Low Box (00:00–23:59)
This indicator highlights each trading day with a shaded box spanning from 00:00 to 23:59 (based on the selected timezone) and covering the day’s highest and lowest price.
• Green box when the day closes above its open
• Red box when the day closes below its open
• Historical days are fully drawn for easy comparison
• Current day box builds dynamically as new candles form
Useful for visualising daily range, market bias, and intraday structure across all timeframes.
