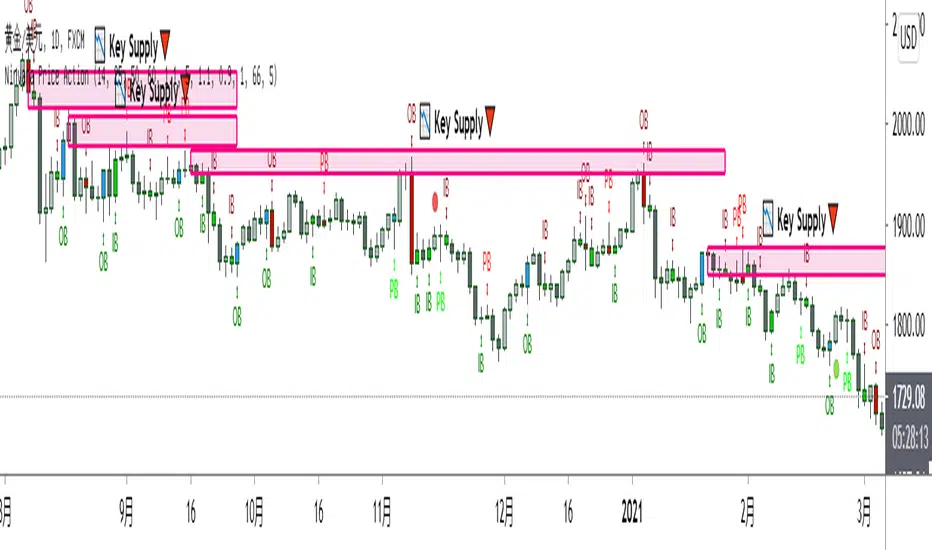
Nirvana Price ActionYou can set it according to your own needs
The required display can be opened ☑
Do not need to display can be closed ❌
I chose to turn them on by default: inside bars ☑ pin bars ☑ price action bar names ☑ price action bars ☑
Colors can be customized
I wish you a smooth transaction!
Mum Analizi
Visual Candlestick Blender (Analysis Tool), by @BlueJayBird- This is a analysis tool.
Brief Description
- It generates candlestick containers for current timeframe, using OPEN/HIGH/CLOSE/LOW data from higher time frames.
- Current version supports up to 4 CVB at the same time. Usually using only 2 is enough.
- Vertical extended divisions for 1h, 4h, 1D and 1W using background lines are included too.
* Report any bugs or feedback you have.
NOTE. At current unclosed candlestick , some weird line painting it is expected. It is not a bug, it is a Trading View feature that I haven't been able to solve yet. To solve this, setting the VCB off and then on should be enough.


Renko + CandlesThis indicator has been designed to show you both candle chart and Renko chart in one place.
I think most of you are familiar with candle chart which is working with the time and price movements but Renko chart is based on price differences and is not related to the "time" parameter.
so if you see a Renko brick is appear up(or down) to the previous brick it means that a certain and fixed price movement has been occurred (which mostly calculate by ATR). and also this indicator works in any time frame.
Remember because we want both charts we have time parameter in this indicator, and if the price doesn't move up or down a certain percentage from previous bars, it will plot a renko bar beside the previous one.
you can use this indicator to see if the price moves up or down.
Or you can determine the important support and resistances with much less noises.
it can be used as a confirmation for you to keep your positions or exit.
go ahead and discover it...
If you have any questions, don't hesitate! ask in the comments section below.

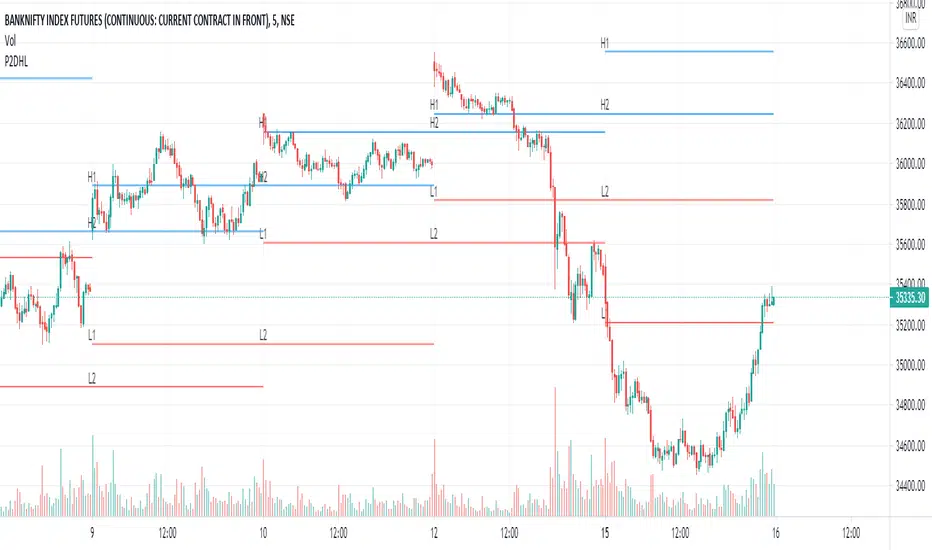
Previous Two Day High and LowThis Script is used to find High Low for previous two days.
H1 is previous day high.
L1 is previous day low.
H2 is day before previous day high.
L2 is day before previous day low.
This H1, L1, H2 and L2 line can be used to determine support and resistance for symbol.
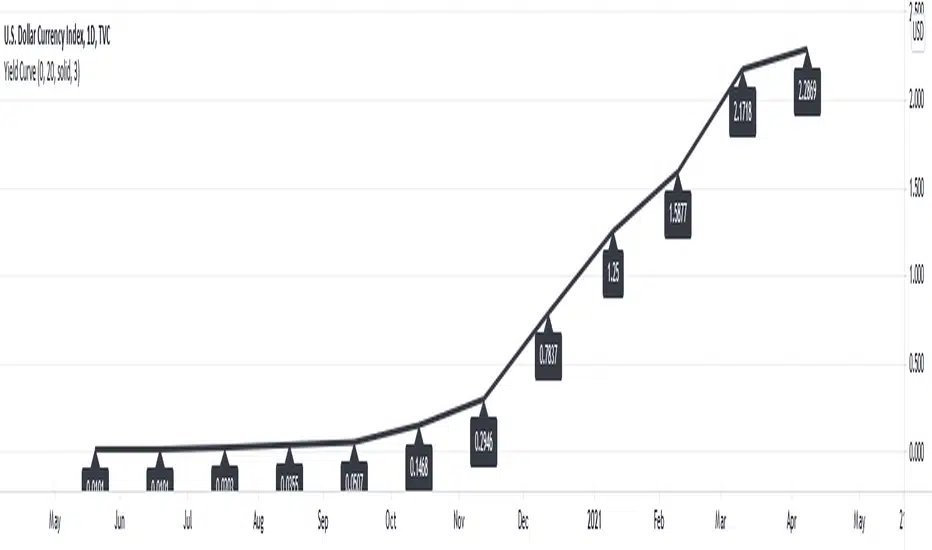
Configurable Yield CurveThis script draws the US Yield Curve (one month to 30 years). It can be configured to show earlier values using the "Yield values from x bars before" parameter. A value of five and chart time zone "1 day" will show the Yield Curve as it was five days ago. In addition, style settings of the Yield Curve line and the labels can be configured. The drawing engine is also optimized to reduce local and server-side computations.
EMA Cross 9,21,50,80,200 + Inside barEste script faz o seguinte:
1. Plota 5 EMAs (9,21,50,80,200)
2. Faz crossover da 9x21 e 21x50
3. Colore inside bar em amarelo (é possível ainda colorir diferentemente bullish e bearish inside bar)

TrendSystem by DhruvThis Script take moving average, RSI and Awesome Oscillator in to consideration to get the idea about the trend of underlying symbol.

LepikkokynttiläSimple indicator highlighting Lepikkokynttilä.
You can tweak wick sizes, body size relative to candle size and colors.

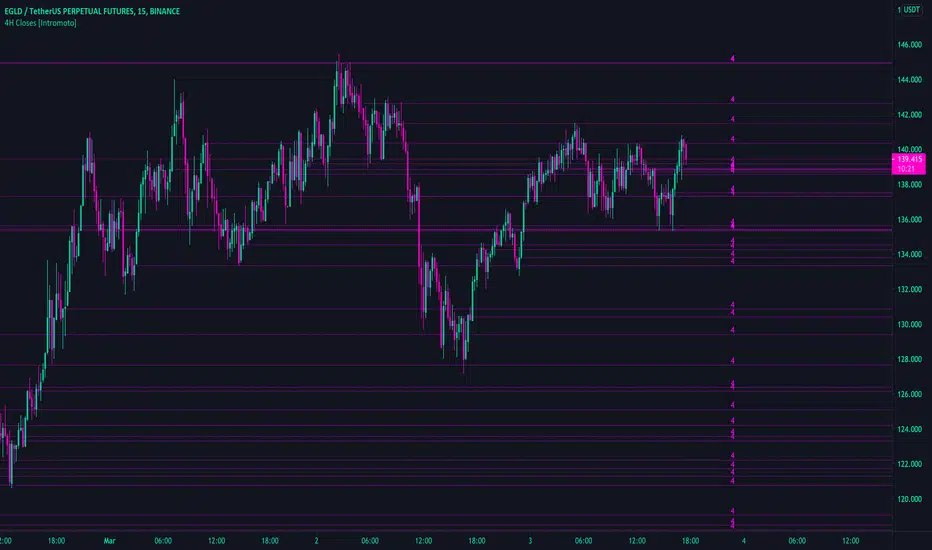
4H Closes [Intromoto]This script is one level from the "closes" script, but as an individual script, this allows more historical closes to be observed at once.
Shows 4 hour closes from the exact candle, regardless of time frame.
Number of lines plotted is limited by tradingview/pinescript, show will only show a certain number i.e recent weekly levels.
Lines can be styled by user: Thickness, solid vs dotted vs dashed, range of colors, label size and X location.
The "line.new" function requires that you 'show' the indicator where the close occured, in order to have the line show. The labels are there regardless and will remind you of the level, with or without the line. This is also true if you change chart resolution. You may have to 'search' for the close to have the line show up.
DM for access.
Thanks!
6H Closes [Intromoto]This script is one level from the "closes" script, but as an individual script, this allows more historical closes to be observed at once.
Shows 6 hour closes from the exact candle, regardless of time frame.
Number of lines plotted is limited by tradingview/pinescript, show will only show a certain number i.e recent weekly levels.
Lines can be styled by user: Thickness, solid vs dotted vs dashed, range of colors, label size and X location.
The "line.new" function requires that you 'show' the indicator where the close occured, in order to have the line show. The labels are there regardless and will remind you of the level, with or without the line. This is also true if you change chart resolution. You may have to 'search' for the close to have the line show up.
DM for access.
Thanks!

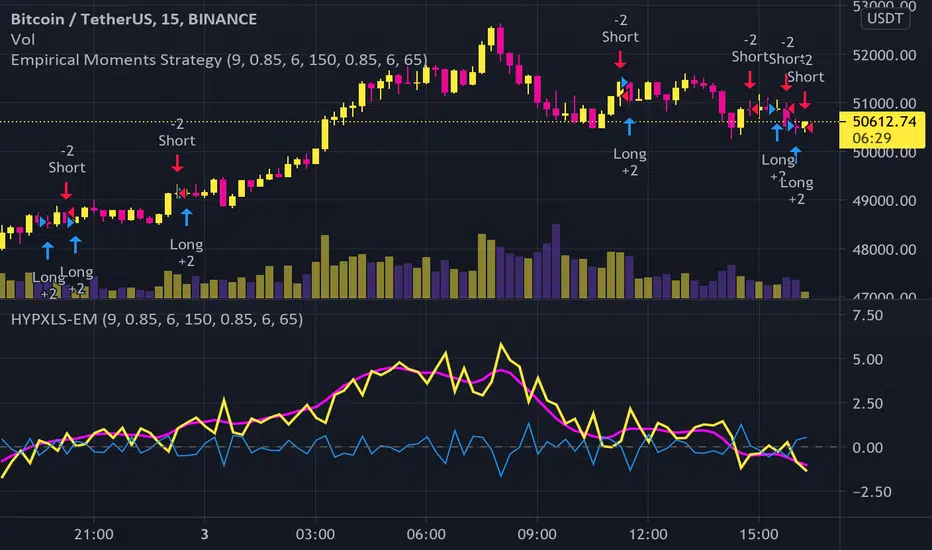
Empirical MomentsBINANCE:BTCUSDT I thought I’d make an indicator for the “fast trader”. This indicator compares the changing high prices with the close prices and in doing so, detects positive “anomalies” (the outlier drift). It gets more complicated than that; the practical indicator is the “empirically weighted drift”, which is a weighted average of the former with its derivatives up to the third order I.e. the “outlier yank”. The empirically weighted drift crossing above and below zero with long and short actions, respectively is used as the strategy. With this strategy, current backtesting for the 15 minute BTCUSDT on the Binance market yields a Sharpe ratio of 1.47 and profit factor of 1.12. Publishing the strategy as well.
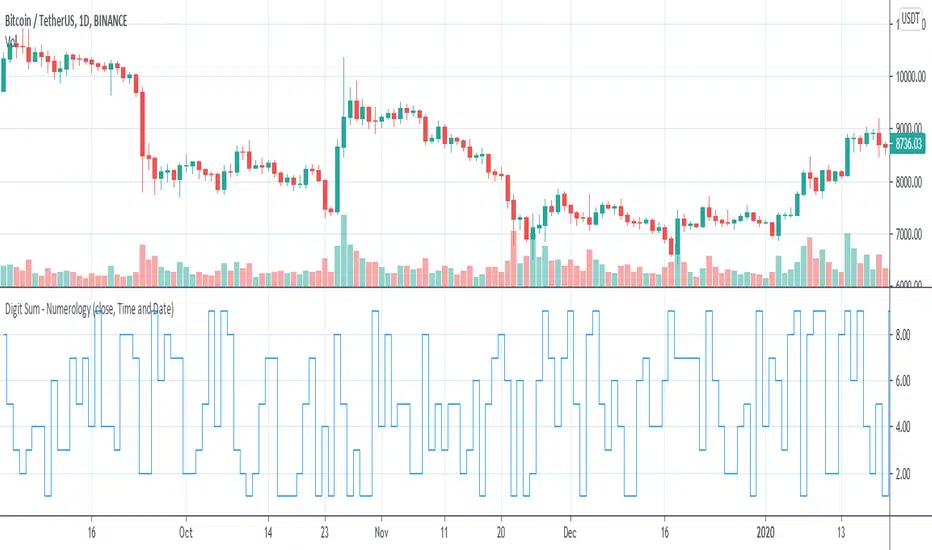
Digit Sum - NumerologyThis script calculates the digit sum of a chosen source.
Only possible thanks to MichelT String to Number Script.
Pinescript - Common String Functions Library by RRBCommon String Functions Library by RagingRocketBull 2021
Version 1.0
Pinescript now has strong support for arrays with many powerful functions, but still lacks built-in string functions. Luckily you can easily process and manipulate strings using arrays.
This script provides a library of common string functions for everyday use, such as: indexOf, substr, replace, ascii_code, str_to_int etc. There are 100+ unique functions (130 including all implementations)
It should serve as building blocks to speed up the development of your custom scripts. You should also be able to learn how Pinescript arrays works and how you can process strings.
Similar libraries for Array and Statistical Functions are in the works. You can find the full list of functions below.
Features:
- 100+ unique string functions (130 including all implementations) in categories: lookup, testing, conversion, modification, extraction, type conversion, date and time, console output
- Live Output for all/selected functions based on User Input. Test any function before using in script.
- Live Unit Test Output for several functions based on pre-defined inputs.
- Output filters: show unique functions/all implementations, grouping
- Console customization options: set custom text size, color, page length
- Support for Pages - auto splits output into pages with fixed length, use pages in your scripts
- Several easy to use console output functions to speed up debugging/output.
WARNING:
- Compilation Time: 1 min
Notes:
- uses Pinescript v3 Compatibility Framework
- this script is packed to the max and sets a new record in testing of Pinescript's limits: 500 local scopes, 4000+ lines, 180kb+ source size. It's not possible to add more ifs/fors/functions without reducing functionality
- to fit the max limit of local scopes = 500 all ifs were replaced with ?: where possible, the number of function calls was reduced, some calls replaced with inline function code
- ifs are faster (especially when lots of them are used in a for cycle), more readable, but ifs/fors/functions increase local scopes (+1) and compiled file size, have max nesting limit = 10.
- ?: are slower (especially in for cycles), hard to read when nested, don't affect local scopes, reduce compiled file size, can't contain plots, for statements (break/continue) and sets of statements
- for most array functions to work (except push), an array must be defined with at least 1 pre-existing dummy element 0.
- if you see "String too long" error - enable Show Pages, reduce Max Chars Per Page < Max String Length limit = 4096.
- if you see "Loop too long" error - hide/unhide or reattach the script
- some functions have several implementations that can be faster/slower, use internal code/ext functions
- 1 is manual string processing using for cycles (array.get) and ext functions - provided in case you want to implement your own logic, may sometimes be slower
- 2 is a 2nd alternate implementation mostly done using built-in functions (array.indexof, array.slice, array.insert, array.remove, str.replace_all),
attempts to minimize local scopes and dependency on ext functions, should generally be faster
- 3 is a 3rd alternate (array.includes, array.fill) or a more advanced implementation (datetime3_str) with lots of params, giving you the most control over output
- most functions have dependencies, such as const names, global arrays, inputs, other functions.
P.S. Strings of Time may be closed unto themselves or have loose ends; they can vibrate, stretch, join or split.
Function Groups:
1. Char Functions
- repeat(str, num)
- ascii_char(code)
- ascii_code(char)
- is_digit(char)
- is_letter(char)
- digit_to_int(char)
- is_space_char(char)
2. Char Test and Lookup Functions
- char_at(str, pos)
- char_code_at(str, pos)
- indexOf_char(str, char)
- lastIndexOf_char(str, char)
- nth_indexOf_char(str, char, num)
- includes_char(str, char)
3. String Lookup Functions
- indexOf(str, target)
- lastIndexOf(str, target)
- nth_indexOf(str, target, num)
- indexesOf(str, target)
- numIndexesOf(str, target)
4. String Conversion Functions
- lowercase(str)
- uppercase(str)
5. String Modification and Extraction Functions
- split(str, separator)
- insert(str, pos, new_str)
- remove(str, pos, length)
- insert_char(str, pos, char)
- remove_char(str, pos)
- reverse(str)
- fill_char(str, char, start_pos, end_pos)
- replace(str, target, new_str)
- replace_first(str, target, new_str)
- replace_last(str, target, new_str)
- replace_nth(str, target, new_str, num)
- replace_left(str, new_str)
- replace_right(str, new_str)
- replace_middle(str, pos, new_str)
- left(str, num)
- right(str, num)
- first_char(str)
- last_char(str)
- truncate(str, max_len)
- truncate_middle2(str, trunc_str, pos, max_len)
- truncate_from2(str, trunc_str, pos, max_len, side)
- concat(str1, str2, trunc_str, max_len, mode)
- concat_from(str1, str2, trunc_str, max_len, side, mode)
- trim(str)
- substr(str, pos, length)
- substring(str, start_pos, end_pos)
- strip(str, mask, target, is_allowed)
- extract_groups(str)
- extract_numbers(str, d1, d2, mode)
- str_to_float(str, d1, d2)
- str_to_int(str)
- extract_ranges(str, d1, d2, d3, type)
6. String Test Functions
- includes(str, target)
- starts_with(str, target)
- ends_with(str, target)
- str_compare(str1, str2)
7. Type Conversion Functions
- tf_check2(tf)
- tf_to_mins()
- convert_tf(tf)
- period_to_mins(tf)
- convert_tf2(tf)
- convert_tf3(tf)
- bool_to_str(flag)
- get_src(src_str)
- get_size(size_str)
- get_style(style)
- get_bool(bool_str)
- get_int(str)
- get_float(str, d1, d2)
- get_color(str, def_color)
- color_tr2(col_str, transp)
- get_month(str)
- month_name(num, format)
- weekday_name(num, format)
- dayofweek_name(t)
8. Date and Time Functions
- date_str(t, d)
- time_str(t, d)
- datetime_str(t, d1, d2)
- date2_str(t, d, type)
- time2_str(t, d, type)
- datetime2_str(t, d1, d2, format1, format2)
- date3_str(t, template)
- time3_str(t, template)
- datetime3_str(t, template)
9. Console Output & Helper Functions
- echo1(con, str)
- echo2(x, y, con, str)
- echo3(v_shift, con, str, msg_color, text_size)
- echo4(x, y, con, str, msg_style, msg_color, text_size, text_align, msg_xloc)
- echo5(x, y, con, str, msg_style, msg_color, text_size, text_align, msg_xloc)
- echo6(x, y, con, str)
- echo7(v_shift, con, str, msg_color, text_size)
- echo8(x, y, con, str, msg_style, msg_color, text_size, text_align, msg_xloc)
- echo9(x, y, con, str, msg_style, msg_color, text_size, text_align, msg_xloc)
- new_page(str, line_str, trunc_str, header_str, footer_str, length, page_count, page, mode)

engulfing bullishengulfin bullish
The support and resistance lines of the previous candle are drawn. You can choose the lines in any length you want

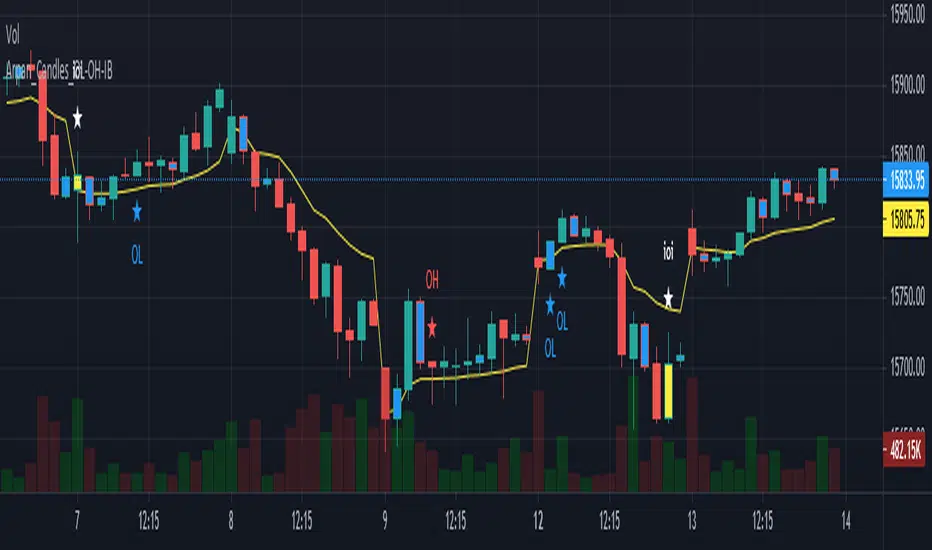
Arpan_Candles_OL-OH-IBThis script simply shows OL (Open=Low) , OH (Open=High) and IB (Inside Bar) . I personally use OL and OH to take quick scalping trades with very low risk.
OL candle indicates that candle's Open and Low prices are same and a Long trade can be taken with a stoploss below candle low.
OH candle indicates that candle's Open and High prices are same and a SHORT trade can be taken with a stoploss above candle high.
Candles with navy blue colour indicates an Inside Bar . An inside bar is a common pattern where the high and low of one candle occur inside the high and low of the prior candle. Inside bar shows a contraction in volatility and are often a continuation pattern. Previous candle (prior candle to inside bar) is known as "Mother candle" and trades can be taken on breakout from "Mother candle" , in the direction of breakout and keeping a stoploss below/above "Mother candle".
This script can be used in any time frame. Smaller time frames generate more signals compared to higher time frames.