The Strat info boxThis indicator is an all in one indicator for the "The strat" method by Rob Smith. This indicator DOES NOT provide trading advice or trade entry signals!
What is included:
* Candle Type 1 - Inside Candle
* Candle Type 2- Up or Down Candle
* Candle Type 3 - Engulfing Candle
* Strat signal:
- 2-1-2 setup
- 3-2-2 setup
* Full Timeframe Continuity:
- from a 5min timeframe to a yearly timeframe. Green gives you an uptrend, Red a downtrend.
* middle of day and week
- this give you a support and resistance level at the middle of the day or week. This is a good indicator if the stock goes up or down
* extra info like:
- ATR of 14 days
- DTR of current day
- Volume info
- Float info
NASDAQ:FB
Mum Analizi

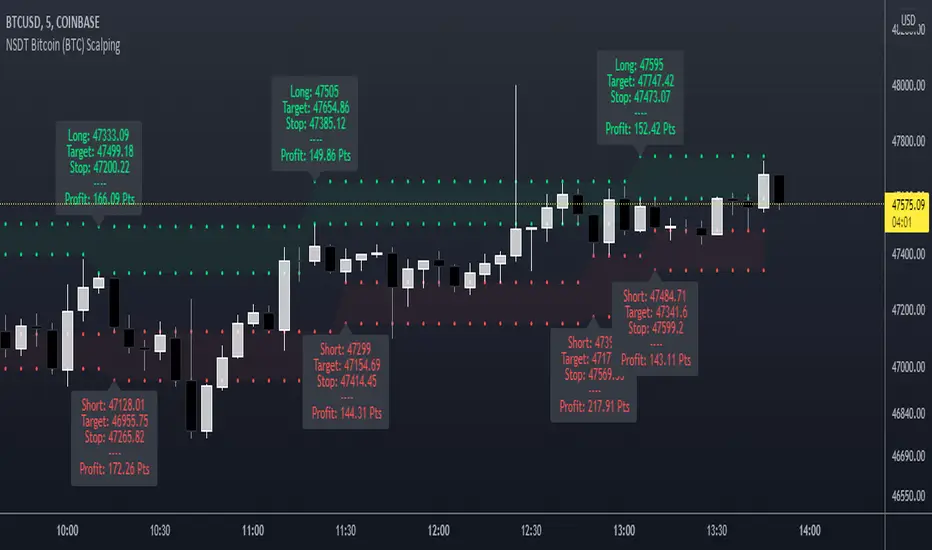
NSDT Bitcoin (BTC) ScalpingThis indicator is specifically designed for scalping Bitcoin (BTC). It looks for a particular price pattern/sequence and displays a label on the chart to show a potential entry, target, and stop based on that analysis. Basically enter long through the green zones and short through the red zones. These levels are not guaranteed to be hit. Trading is risking and you can lose money. Trade at your own discretion and risk. This indicator is only providing potential scalping zones based on recent price action.
[LixxChartz] Engulfing Candle Auto FinderProbably the most complicated script you have seen...
The Engulfing Candle Script that ACCTUALLY finds the engulfing candles.
This indicator is a part of my new script I am creating and I will be realising soon. Hope it helps.
I really don't understand why other people were making it so complicate LOL

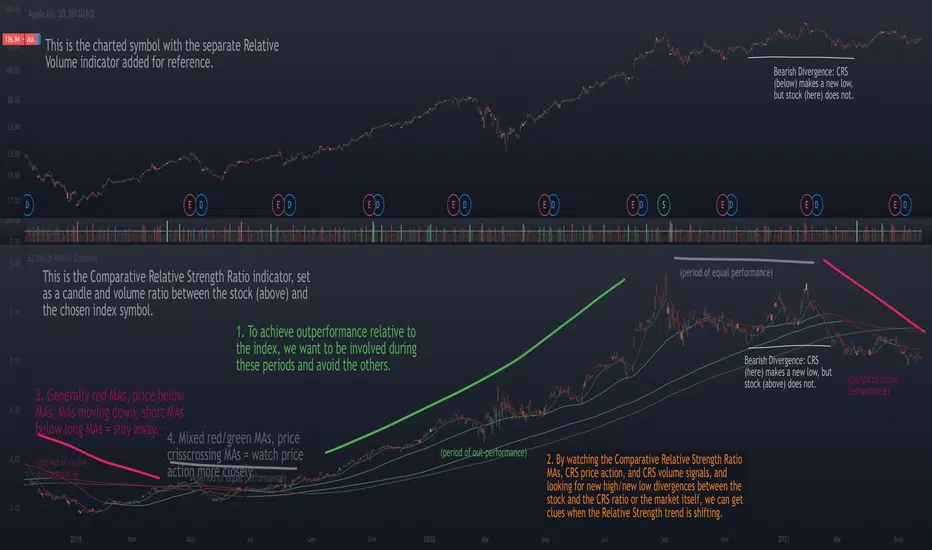
Relative Strength Ratio Chart + Relative Volume Gradient CandlesThe purpose of the Comparative Relative Strength Ratio indicator is to provide a way of looking at a relative strength ratio as a candle graph instead of only a closing price line, as well as to provide relative volume gradient coloration on the ratio-generated candles, and additionally to plot moving averages of the CRS ratio that can help display shifting trends in relative strength.
This is different from my Relative Volume Gradient Paintbars indicator, as well as my Comparison Chart with Relative Volume Gradient Paintbars indicator, in that the first looks at the charted symbol itself, the second looks at an alternate symbol, and this third indicator looks at a ratio between the charted symbol and the alternate symbol.
The idea behind this indicator is to provide additional means of evaluating relative strength, such as comparing the moving averages of the comparative relative strength ratio graph to the charted stock symbol's own MAs in order to gauge strength, comparing the price action of the ratio to that of the individual stock and its index, and comparing the volume gradient signal between the ratio, the stock, and the index.
The unique volume features allow comparing volume as a percent of the index volume, as well as stock's candle range as a percent of the range of the index. So when the volume as a percentage of the index's overall volume becomes high, this can be made to highlight the candles.
Comparison Chart with Relative Volume Gradient CandlesThis indicator provides a way to use Relative Volume Gradient Paintbars on an alternate/comparison symbol while still looking at your main charted symbol. For instance, this allows you to plot the ES1! or SPY or QQQ above/below your charted symbol, and see its current Relative Volume signal, and compare that to the your currently-charted individual stock symbol, etc., and while keeping the candles from both symbols all lined up perfectly. It also provides 4 different custom MAs which can be applied to the comparison symbol.
The idea here is that you can potentially use my other indicator, Relative Volume Gradient Paintbars, on the primary symbol to evaluate that chart, while using this particular indicator to quickly analyze the same Relative Volume data on a comparison market symbol such as the SPY or QQQ without having to switch charted symbols. You can also quickly compare price action and location relative to familiar moving averages to quickly gauge relative strength of the stock vs. the market symbol.

The Secret Sauce [divonn1994]Indicates a positive buy signal when:
1) the ema close is about the ema open
2) Weis Waves are positive
3) There is a Green Candle
Indicates a sell signal when:
1) there is a red candle
2) the ema clos is below the ema open
This helps you get in at the beginning of every trend but mitigates losses if a downtrend occurs
I like to use it with 4 hour candles. I haven't tried it with lower scales.

Alchemist Capital Lazy ZonesAlchemist Capital Lazy Zones is a script written to complement the trading style taught by @clover_trading - Chris teaches a zone to zone strategy and this script aids in the technical analysis relating to this.
This indicator has been tested and coded with Forex pairs in mind, as such its functionality and usefulness on other assets cannot be guaranteed.
The best way to use this script is to load it fresh on your chart/given pair, make the adjustment to the initial user/price level for that given pair. The indicator will then draw your lazy zones from this initial price point, showing the levels that have been ticked within the input tab. Use the key levels and zones printed as a template to manually markup your chart. It is important that before switching to another pair you hide the indicator from view, load the new chart and adjust the initial user/price level for this chart before unhiding the indicator and redrawing the key levels and zones. The reason for this is that not doing so can sometimes cause zoom issues as the new chart loads with Auto-zoom enabled as standard and will carry over the user/price level from the previous chart.

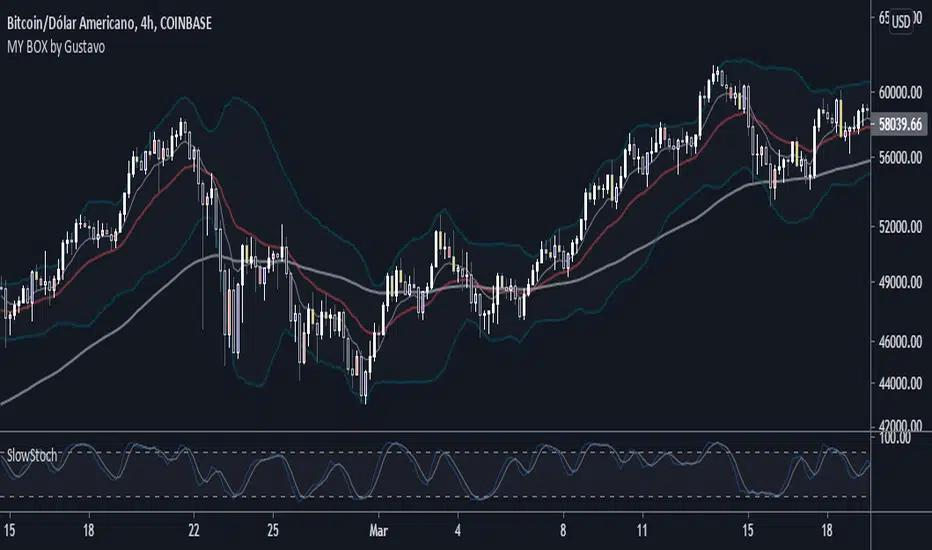
MY BOX by GustavoThis box contains two strategies, several moving averages and Bollinger Bands.
PFR or "Reversal closing price" is a simple and effective strategy, widespread by the Brazilian trader Stormer.
The purpose is to make the candles generate the input signal more clearly.
Description:
When the sales PFR candle appears colored, watch out for the next candle. If he breaks the closing of the PFR sell candle, SALE!
Your stop should be at the maximum of the PFR candle and your target projected at 1.618 in the fibonacci extension.
When the buy PFR candle appears colored, watch out for the next candle. If it breaks the closing of the buy PFR candle, BUY!
Your stop should be at the low of the PFR candle and your target projected at 1.618 in the fibonacci extension.
Inside Bar: The candle has its maximum less than the maximum of the previous candle and its minimum greater than the minimum of the previous candle.
Settings:
You can edit the colors in the indicator settings and select the measurements you want to use.
You can also choose to use the Stocastico Lento filter on over-purchase and over-sale.
You can also activate the Inside bar, it will appear in red on the graph.
There is also the possibility to activate in the settings, the Bollinger Bands.
--------------------------
Este box contém duas estratégias, diversas médias móveis e Bandas de Bollinger.
PFR ou "Preço de fechamento de reversão" é uma estratégia simples e eficaz, bastante difundida pelo trader brasileiro Stormer.
O intuito é tornar os candles de geram o sinal de entrada mais claro.
Descrição:
Quando o candle PFR de venda aparecer colorido, fique atento ao próximo candle. Se ele romper o fechamento do candle PFR de venda, VENDA!
Seu stop deverá ser na maxima do candle PFR e seu alvo projetado em 1,618 na extenção de fibonacci.
Quando o candle PFR de compra aparecer colorido, fique atento ao próximo candle. Se ele romper o fechamento do candle PFR de compra, COMPRE!
Seu stop deverá ser na mínima do candle PFR e seu alvo projetado em 1,618 na extenção de fibonacci.
Inside Bar: O candle tem sua máxima menor que a máxima do candle anterior e sua mínima maior que a minima do candle anterior.
Configuração:
Você pode editar as cores nas configurações do indicador e selecione as medias que deseja usar.
Também pode escolher usar o filtro do Stocastico Lento em sobre compra e sobre venda.
Você também pode ativar o Inside bar, ele aparecerá em vermelho no gráfico.
Há também a possibilidade de ativar nas configurações, as Bandas de bollinger.
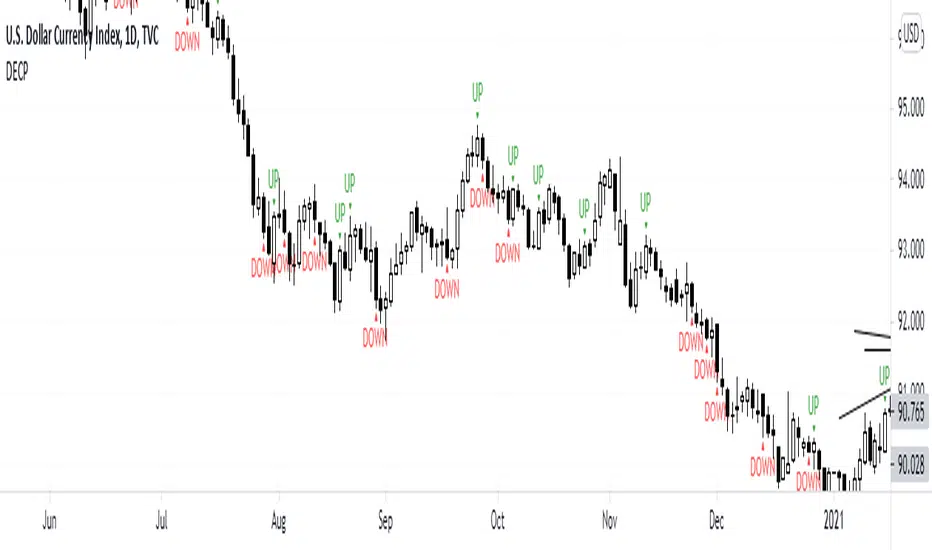
DECPDECP is simple and easy to use!
It detects bullish and bearish engulfing candlestick patterns.
After detecting the patterns I've said, it mentions that the pattern is going to continue its direction to up or down.
But remember candlestick patterns don't determine targets and it's possible that predicted directions fail.
So use it carefully and enjoy it!
Option Premium Chart (©MBY_LAB)Hi, This is Yong.
This indicator shows a candle chart that outputs the difference between the option market price and the spot market price.
On the expiration date of the options market, the volatility of the bitcoin price increases.
I hope that indicator is helpful.
Anyone can use this indicator.


BarCounting_ v1.1** aims to facilitate candle identification while studyng or sharing your screen. not for professional use. idea here is to make it as easy and direct as possible. hope it helps. **
** tem como único objetivo facilitar a identificação de velas/dos candles enquanto estuda ou compartilha sua tela. não para uso profissional. a única ideia aqui é torná-lo o mais fácil e direto possível. espero que ajude.**

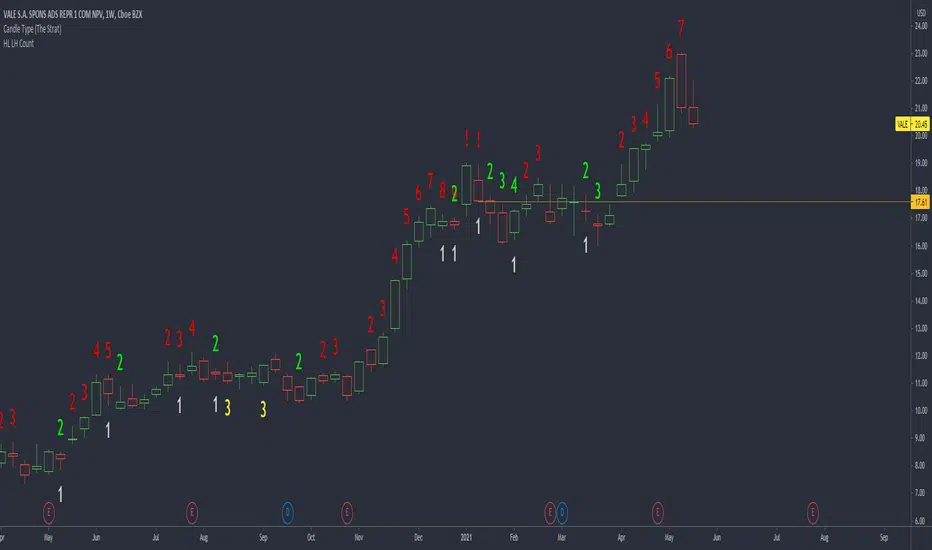
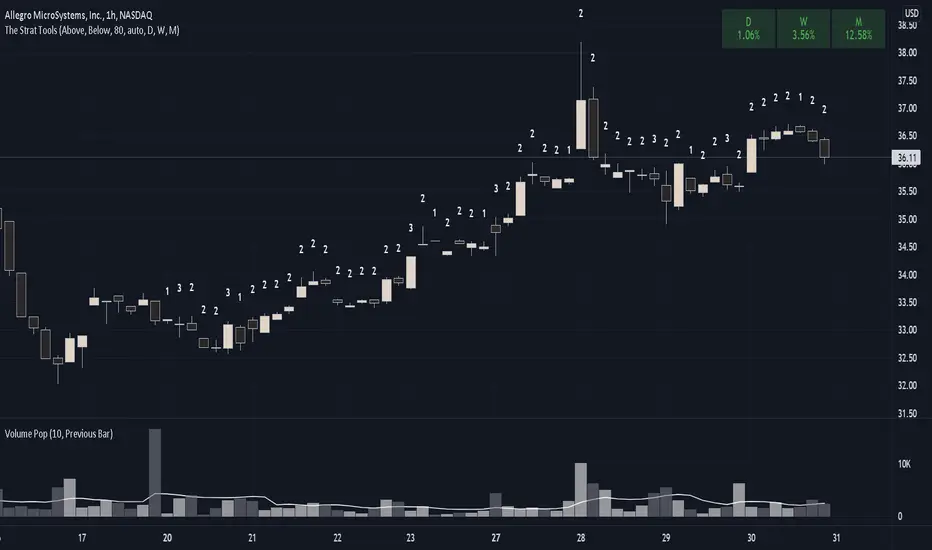
The Strat ToolsThis indicator will be collection of tools for using Rob Smith's The Strat.
Currently only bar numbers is implemented.
Every individual tool can be enabled or disabled and customized.
#TheStrat
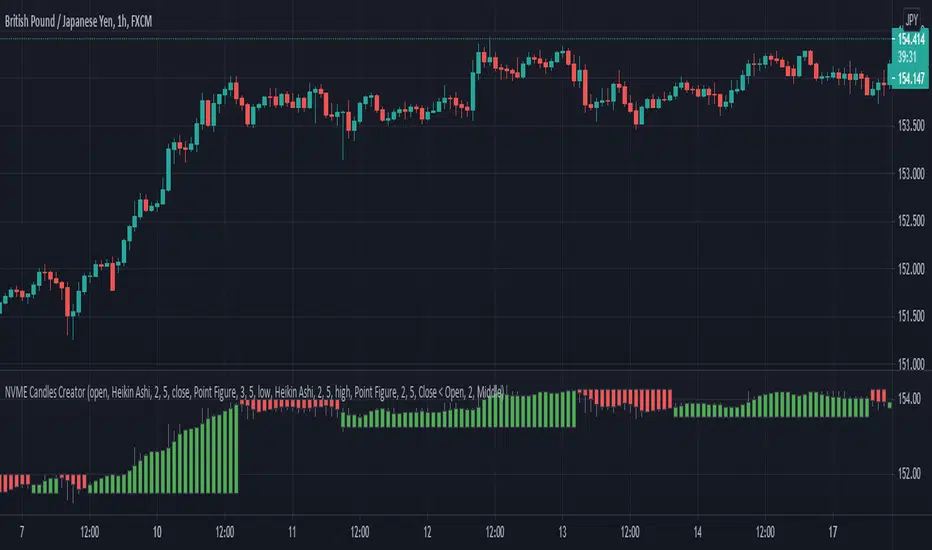
NVME Candles Creator Experimental //Note://
This is an experimental indicator that may provide you with useful information or it may not depending on how you use it and more information can be found below!
NVME Candle Creator indicator is an experimental indicator that allows you as the user to build your own candlestick system within a click of a button. The indicator uses data from 5 different chart series including the following: The default candle stick, Heikin Ashi, Renko (ATR Version), Kagi and the Point and Figure chart. Since there are 4 pieces of data from a candle plot such as the open, the close, the high and the low, we are able to edit each individually with our own data using the security() function and the chart series functions that are linked to the those specific charts. This indicator is designed to be used as a second chart alternative without having to take much screen space, however there are other uses to it such as using this indicator to find information about other chart types and possibly creating a noise free chart series using our integrated colour scheme system.
The features of this indicator are the following:
Sources (1-4) : These are customisable by changing the item listed on the drop down menu, the items displayed will be data from the charts such as open, close, high, low, hl2, hl3, and ohcl etc. There are 4 of these inputs as this will change the data that you are grabbing for the series. (Series 1 -> Close, Series 2 -> Open, Series 3 -> High, Series 4 -> Low)
Candle Style (1-4) : This is the chart series we will be using to get the final output of the indicator, this can be changed by selecting a different item in the dropdown menu. The following content of this drop down menu are: Default (Japanese Candlesticks), Heikin Ashi Candlesticks, ATR (Renko Version), Kagi and Point and Figure. These will strongly determine the final output of the indicator as they can change what data will be represented and how it will be displayed.
Length (1-4) : The value in this input field only affects the following candle style options: ATR, Kagi and Point and Figure. The reason is because these chart series include a customisable input in the form of reversal points or ATR value. Changing this value will determine the final design of the indicator as it can make the candles larger or smaller depending on the number inside the box.
Custom Timeframe (1-4) : This toggle will allow you to fetch data from a different timeframe of choice, however disabling this will fetch data from the current timeframe period.
Timeframe Value (1-4) : This input field is only active when the custom timeframe is enabled and this will change the security function so that it grabs data from the timeframe inputted and this can change the indicator's output so that the candles will look different but it doesn't have a significant change compared to the candle style feature.
Colour Filter: (Affects the candles plotted)
Option 1: "Close > Open" - Recolours the candles in a manner where candles will be green if that candle is greater than the open and the candles will be red if the close is less than the open.
Option 2: "Close < Open" - Recolours the candles in a manner where candles will be red if that candle is greater than the open and the candles will be green if the close is less than the open. (May be useful for some settings where the plots are different) - Use this as a colour correction.
Option 3: "None" - The colours will be removed so you will have to manually change it.
Dashboard: This can be turned off or turned on however it doesn't contain anything useful only a reminder that it isn't recommended to use this indicator alone as it is designed as an experimental indicator.
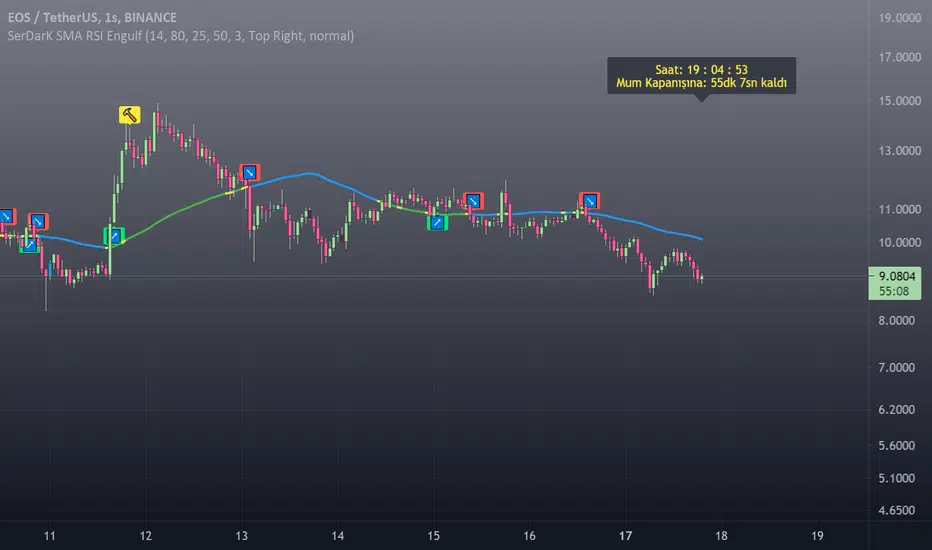
[SerDarK] SMA RSI Engulfing BarENG: This indicator includes the SMA line colored according to the price position, the RSI to identify the bearish or the bullish points, the Engulfing bars, the clock and the information panel showing the countdown to the candle closing.
SMA: default period is set to 50. It can change from the settings.
Definition of SMA line default colors: When the price is below the SMA line, its color is blue. It is green when the price is above the SMA line. It is yellow in RSI alerts and when the price hits the SMA line.
RSI: default period 14 is set. It can be changed in the settings.
🔨 Hammer Emoji: RSI is located at the overbought turnaround point. This sign does not mean that the trend will definitely return.
🚀Rocket Emoji: Tries to catch the "RSI oversold point turn".This sign does not mean that the trend will definitely return.
↗️↘️Up and Down arrows emojis. After the price crosses the SMA line, it indicates that it is closing a candle in that direction.
Engulfing candles: bullish engulfing candle is blue color. Bear engulfing candle is black in color.colors can be changed in settings.
Note that this indicator is only an indicator. It does not give advice on buying or selling.
Enjoy
TUR: Bu indikatör, fiyat konumuna göre renklendirilmiş SMA çizgisi, RSI ile düşüş veya yükseliş noktalarını belirleme, Engulfing (Yutan) barlar , saat ve mum kapanışı için geri sayım gösteren bilgi paneli içermektedir.
SMA: varsayılan periyodu 50 ayarlıdır. Ayarlardan değiştirebilir.
SMA çizgisi varsayılan renklerinin tanımı: Fiyat SMA çizgisi altında iken rengi mavidir. Fiyat SMA çizgisi üstünde iken yeşildir. RSI uyarılarında ve fiyat SMA çizgisine temas ettiğinde sarı renktedir.
RSI: varsayılan periyodu 14 ayarlanmıştır. Ayarlardan değiştirilebilir.
🔨 Çekiç Emojisi: RSI aşırı alım dönüş noktasında bulunur. Bu işaret trendin kesin döneceği anlamına gelmez.
🚀Roket Emojisi: "RSI aşırı satım noktası dönüşünü "yakalamaya çalışır. Bu işaret trendin kesin döneceği anlamına gelmez.
↗️↘️Yukarı ve Aşağı yönlü okl emojileri. Fiyat SMA çizgisini kestikten sonra, o yönde mum kapattığını gösterir.
Engulfing mumları: bullish engulfing (yutan boğa) mumu mavi renktir. Bear engulfing (yutan ayı) mumu siyah renktir. Renkler ayarlardan değiştirilebilir.
Not: Bu indikatörün yalnızca gösterge olduğunu unutmayın. Alma satma tavsiyesi vermez.
Kalan süre etiketi BIST gibi sınırlı süreli sembollerde, gün ve daha üstü periyotlarda doğru çalışmayabiliyor.
Traders Hedge - Pro with AlertsDear Traders,
"You can't connect the dots looking forward; you can only connect them looking backwards. So you have to trust that the dots will somehow connect in your future." ~Steve Jobs
This quote from Steve Jobs, explains the very essence of this indicator.
Trading is Simple, Why make it complicated. ~ Ravi Chandran
The main motto building this Traders Hedge - Pro indicator is to equip retail traders with a multi purpose tool which in itself will act as a complete trading setup.
This indicator will help you in understanding the market structure and planning your possible entries & exits well in advance.
The indicator & setup is independent of time frames & will work for all trading instruments.
Traders Hedge - Pro Indicator with Alerts you can also set Alerts on your favourite scripts and time frames, to get notification when a Demand or a Supply Zone is created or any Price rejection is formed.
List of all the features is provided below.
1. Trade Type - A quick auto setup for Intraday or Swing trades
2. CPR - Identifies the market structure and helps to plan mean reversions trade setups
3. Weekly Support & Resistance - Automatically identifies and displays the higher time frame support & resistance levels
4. Price Action Triggers - Alert with a trigger symbol shown on the respective candle where a possible price reversal is expected
5. Targets - Plots the possible Major & Minor targets, which helps in planning our possible profit booking & stop loss zones
6. Developing Pivots - Plots the price mean reversion zones for the upcoming trading session
7. Supply & Demand Zones - Plots the demand and supply zones by changing the color of the candle
8. Dynamic Dz & Sz Price Tracking - It dynamically identifies and plots the support & resistance levels
9. Opening Range - Plots the identified opening range on the chart
10. PEMA - Helps in visualizing the trend and also acts as a dynamic support & resistance levels
To set Alerts follow the steps provided below.
1. Go to the symbol chart and select the time frame on which you want to set Alerts.
2. Select Alerts Tab and click on Create Alert, shortcut key Alt+A
3. In Condition Select the option “Price Rejection Alerts“ or “Zone Alerts“ for which you want the alerts to be shown
4. In Options, select Once Per Bar Close
5. Select expiry as per your preference or keep it open-ended
6. Select Alerts Actions as per your preference
7. Alert name is optional
8. Default message is “Price Rejection Alerts“ or “Zone Alert” and can be modified
9. Click on Create and in the warning window select Continue Anyway
How to get the indicator:
To know more about the indicator & to download please check the link in the signature below.
Once you have active alert, you will keep getting notification whenever a Price rejection or new Demand / Supply zone gets created in the identified symbol and time frame you have selected.
Please do feel free to use the indicator and give your valuable feed backs which will help me in optimizing it to a great extent.
I would love to thank each of the traders in this Trading View community in helping me improve on my trading skills.
Happy Trading!

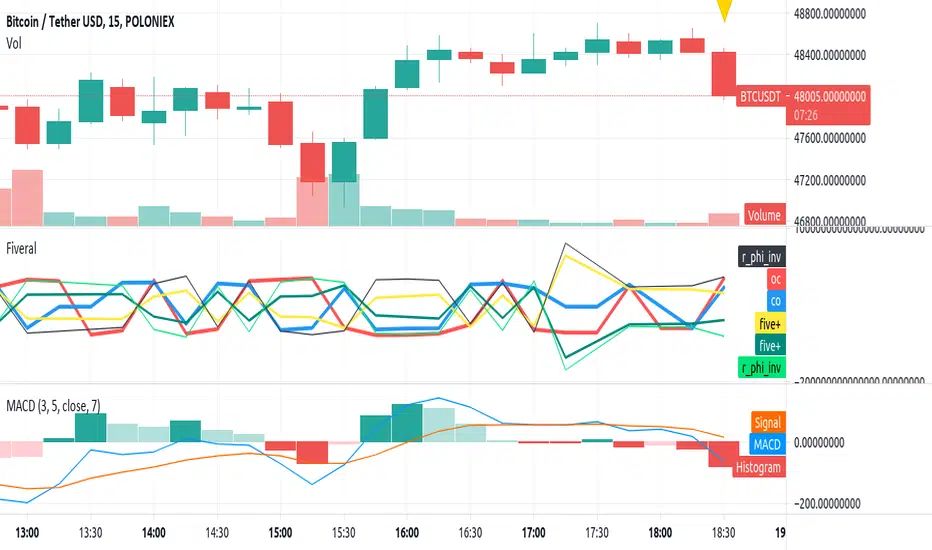
Fiveral: Repulsion/Golden Radio HackAnother in a series of experimental indicators using logarithmic scale visualisation.
This one extends into some work on I've been doing on 'the cube', but Pine isn't liking multiple log lines even when the equations are included for each plotted variable, meaning, no variables used in the definition of a variable, as is done here. As a result, accuracy of this indicator can't be guaranteed between scales, or during use.
Have at it, and enjoy!
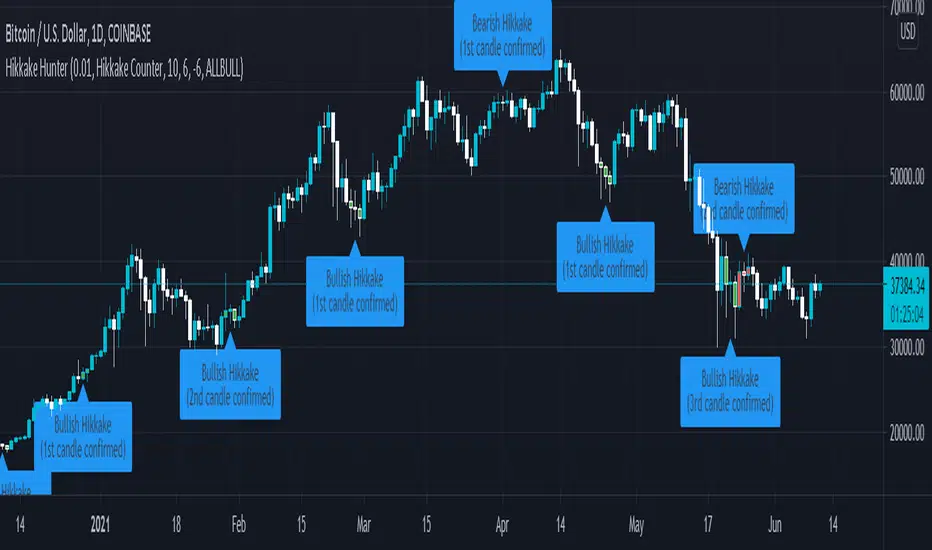
Hikkake HunterSimple script for finding Hikkake patterns in charts.
This script will:
- Identify bullish / bearish variants of the Hikkake pattern.
- Allow the user to change the color scheme for the bullish / bearish variants.
- Allow the user to specify which Hikkake patterns will be recognized by this hunter (specifically, allowing which of the three candles after the pattern appears will confirm the pattern).
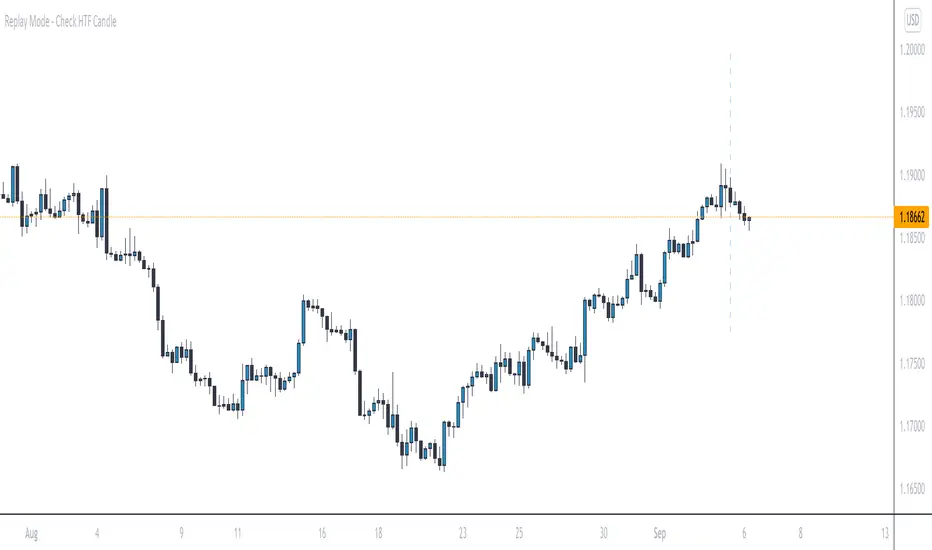
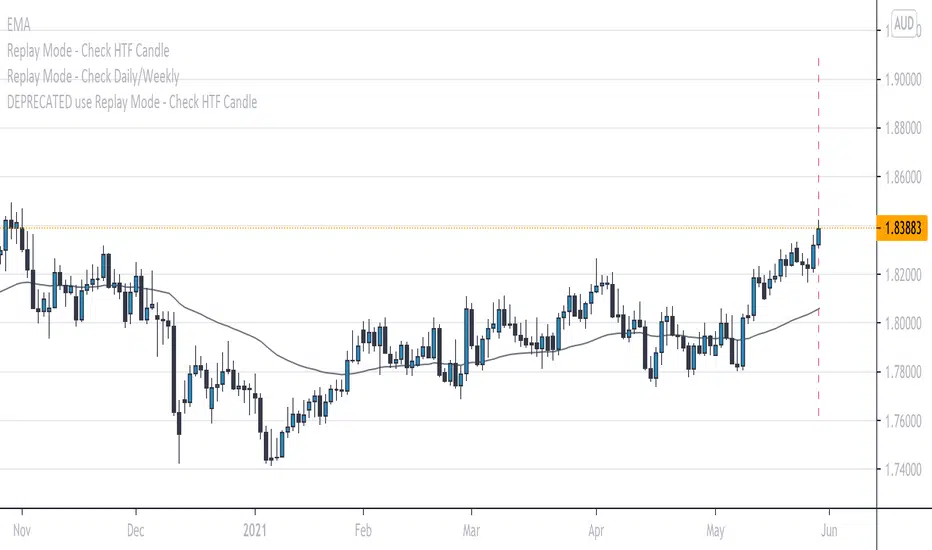
Replay Mode - Check HTF CandleThis indicator is intended to be used while using Replay Mode.
A vertical line will be drawn when you can safely check the 4H, Daily, or Weekly candle without seeing future price.
It is similar to the built-in Session Breaks, but has the benefit of not needing to remove one candle before checking the Daily.
When the line is the color of your 4H settings, it is safe to check the 4H candle.
When the line is the color of your Daily settings, it is safe to check the 4H and Daily candles.
When the line is the color of your Weekly settings, it is safe to check the 4H, Daily and Weekly candles
Replay Mode - Check Daily/WeeklyThis indicator is intended to be used while using Replay Mode.
It is similar to the built-in Session Breaks, but has the benefit of not needing to remove one candle before checking the Daily.
When on an intraday chart (timeframe less than Daily), a vertical line will be drawn when you can safely check the Daily or Weekly candle without seeing future price.
When the line is the color of your Daily settings, it is safe to check the Daily candle.
When the line is the color of your Weekly settings, it is safe to check both the Daily and Weekly candle.
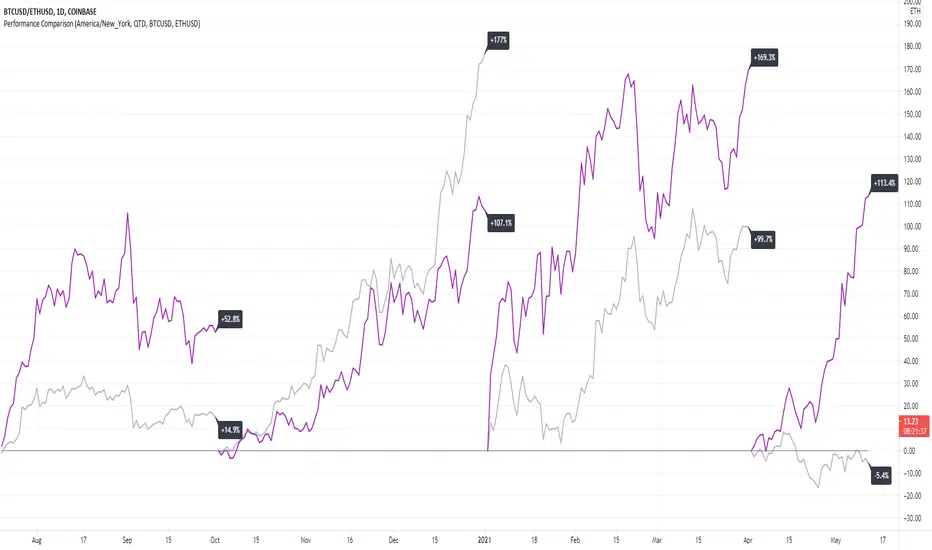
Performance ComparisonThis script takes two symbols as input and shows the year-to-date (YTD), quarter-to-date (QTD), or month-to-date (MTD) performance in percent.
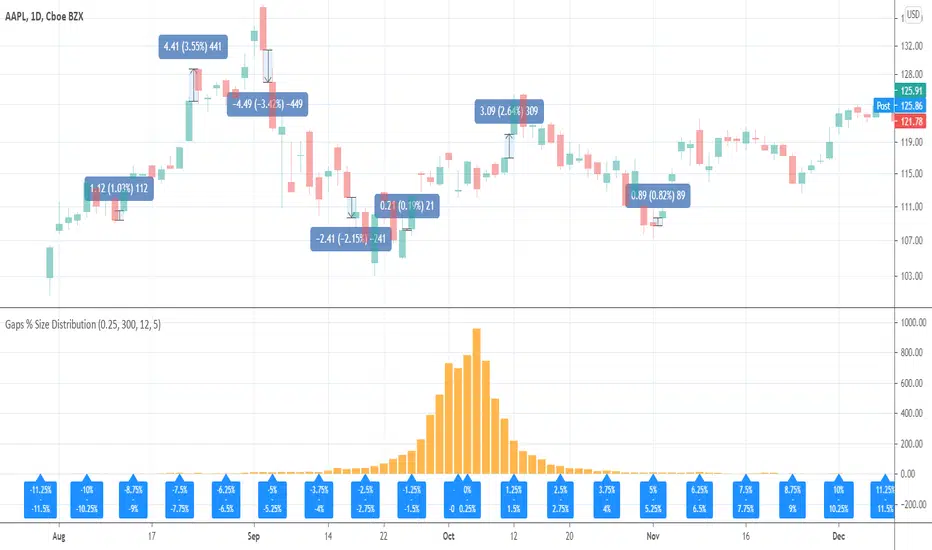
Gaps % Size DistributionThis tool is to visualize the distribution of gap % sizes, i.e. those things that I marked on the main chart. The tool uses the entire history of an instrument.
The detalization depends on the Binning Step parameter. The lower chart timeframe the lower that step should be.
Good luck.