PriceCatch Crypto Screener IOHi,
TradingView community and Crypto traders. Warm Greetings.
PriceCatch Crypto Screener.
I am sharing a script that screens the following Crypto.
ADAUSD, ALGOUSD, AMPUSD, ATOMUSD, AUCTIONUSD, AVAXUSD, BTCUSD, BTRSTUSD, CHZUSD, DAIUSD, DOGEUSD, DOTUSD,
EOSUSD, ETHUSD, FETUSD, FXUSD, JASMYUSD, LINKUSD, LRCUSD, MANAUSD, MATICUSD, NUUSD, OMGUSD, OXTUSD,
SHIBUSD, SKLUSD, SNXUSD, SOLUSD, TRIBEUSD, USTUSD, XLMUSD, XTZUSD, YFIUSD, ZRXUSD
Once this script is added to your chart and the resolution is set, it will automatically keep watching for any breakout on the above Crypto and display the results on chart for your attention. You may use the settings option of the script to screen on different time-frames. For example, you may manually select 30Min, 1H, etc., to scan on the respective time-frames. This way, you can quickly spot any opportunities emerging on different time-frames. The Screener runs independently of any symbol displayed on your chart.
NOTE - PRIOR TO USING THIS SCRIPT:
Please remember that the script is shared with absolutely no assurances about usability and any warranties whatsoever and as a responsible trader, please satisfy yourselves thoroughly and use it only if you are convinced it works for you. Remember, you are 100% responsible for your actions. If you understand and accept that, you may use the script.
QUERIES/FEEDBACK
Please PM me or leave comments.
Regards to all and wish everyone all the best with trading.
Buysignal

RockIt Algo Profit Track X (Add-on to RockIT Algo)The RockIT Algo Profit / Loss Tracker is an add-on for the RockIT Algo Indicator. It provides the profit / loss realized for each buy or sell signal. This way you can visually view the performance and make profitable decisions.
The RockIT Algo Indicator is designed to generate buy (Long) / sell (Short) signals & is developed using statistical analysis & forecasting techniques. The algorithm takes into consideration different dynamic variables of short, medium and long term price actions and high probability patterns to project future direction. It is suited for all types of trading and can be used for any stocks, forex pairs and crypto.
Disclaimer
TheStreetATM is not registered as financial or investment advisors. You take the responsibility of making the final decision based on the tools, education and information we provide. Trading stocks can lead to very large losses, and we strongly recommend to consult any registered financial advisor before making any decision based on information provided by “RockIT” Algo®. Thank you. We strongly advice to paper trade before making real trading decisions.

RockIT Algo XThe RockIT Algo Indicator is designed to generate buy (Long) / sell (Short) signals & is developed using statistical analysis & forecasting techniques. The algorithm takes into consideration different dynamic variables of short, medium and long term price actions and high probability patterns to project future direction. It is suited for all types of trading and can be used for any stocks, forex pairs and crypto.
Disclaimer
TheStreetATM is not registered as financial or investment advisors. You take the responsibility of making the final decision based on the tools, education and information we provide. Trading stocks can lead to very large losses, and we strongly recommend to consult any registered financial advisor before making any decision based on information provided by “RockIT” Algo®. Thank you. We strongly advice to paper trade before making real trading decisions.

Scalping EMA ADX RSI with Buy/Sell AlertsThis is a study indicator that shows the entries in the strategy seen in one of the youtube channel so it does not belong to me. I can't tell who it is because it's against the House Rules to advertise but you can find out if you look for it on youtube. Default values of oscilators and ema adjusted as suggested. He says he got the best results in 5 min timeframe but i tried to make things as modifiable as possible so you can mess around with the settings and create your own strategy for different timeframes if you'd like. Suggested to use with normal candlestick charts. The blue line below indicates the ADX is above the selected threshold set in the settings named "Trend Ready Limit". You can set alerts for Buy, Sell or Buy/Sell signal together.
The entry strategy itself is pretty straight forward.
The rules for entry are as follows, the script will check all of this on auto and will give you buy or sell signal :
Recommended time frame: 5 min
For Long Entry:
- Check if price above the set EMA (Can disable this rule if you'd like in the settings)
- RSI is in Oversold
- ADX is above set "Trend Ready" threshold (Meaning there is a trend going on)
- Price must approve the trend of previous candles. This is bullish for buy entries and bearish for sell entries.
- Enter with stop loss below last swing low with 1:1 or 1.5:1 take profit ratio.
For Short Entry:
- Check if price below the set EMA (Can disable this rule if you'd like in the settings)
- RSI is in Overbought
- ADX is above set "Trend Ready" threshold (Meaning there is a trend going on)
- Price must approve the trend of previous candles. This is bullish for buy entries and bearish for sell entries.
- Enter with stop loss above last swing high with 1:1 or 1.5:1 take profit ratio.
This is my first indicator. Let me know if you want any updates. I am not sure if i can add everything but i'll try nonetheless.
Changed: Signals will check up to 2 candles before if the RSI is below or above the set value to show signal. This is because sometimes the entry signal is right but the response might be a bit late.

[DS]Bitcoin BTC ETH and others cryptos==DESCRIPTION - English version
The purpose of this script is to show information on graph that can help your decision to buy and sell cryptos.
The script is indicated for Position Trade (Long Term - Holder) and Swing Trade (Medium term).
Position Trade it is recommended to use the Weekly (W) and Daily (D) charts, Swing trade to use the 4H and 2H charts.
It is not advisable to use this indicator with graphic time frame less than 2 hours because the noise levels of information are very high.
An alert function has been inserted in the indicator and to activate this function you will need configure it in the Tradingview.
This alert will indicate the likely points of entry and exit of the asset.
**DESCRIÇÃO - Versão em Português
A proposta deste script é mostrar no gráfico informações que possam auxiliar a sua decisão de compra e venda de cryptos.
Este script é indicado para negociação Position Trade (Longo Prazo - Holders) e Swing Trade (Médio prazo).
Para Position Trade (Holders) é indicado utilizar os gráficos Semanal (W) e Diário (D), para Swing trade utilizar os gráficos 4H e 2H.
Não é aconselhável utilizar este indicador com tempos gráficos menores que 2hs pois os níveis de ruídos nas informação são muito altos.
Foi inserido no indicador uma função de alerta e para ativar esta função, você precisará configurá-la no seu Tradingview.
Este alerta irá indicar os provaveis pontos de entrada e saída do ativo.
====================================================================================================
** English Version
====================================================================================================
█ SETUP applied to Indicator
The setup is based on the average 8, 21 and 56 of the weekly chart (taught on youtube channel: Augusto Backes)
Price above the average 8 on the weekly, indicates that the market is UP trend, below the average 8 on the weekly that the market is DOWN trend
RSI greater than 60% the market is UP trend
RSI greater than 40% and lower 60% the market is in ACCUMULATION
RSI less than 40% the market DOWN trend
The weekly average 8 is represented in GREEN (Upward Trend) and RED (Downward Trend).
The weekly average 21 is represented in LIGHT ORANGE
The weekly average 56 is represented in LIGHT PURPLE
The crossing of weekly averages 8 and 21 is represented with a GREEN (HIGH trend) and RED (LOW trend) cross - this signal is disabled on the graph but you can enable it by clicking on the graph setup
█ FUNCTION USE
(1) Average 8, 21 and 56 on Weekly - show the average 8, 21, 56 weekly on graphic (Average 8 in color red and green, 21 - light orange, 56 light purple)
(2) Crossing of averages 8 and 21 Weekly - is not active but you can activate
(3) Calculation of RSI
(4) barcolor() - mark the candles with the green color (High market) and red color (Dow market)
(5) alertcondition() - you can active this alert on Tadingview
█ BUY AND SELL POINTS - likely points
The indication of the BUY position is shown by a green arrow pointing upwards and the sell position by a red arrow pointing downwards. Buy and sell indications are obtained from the divergence in the market trend.
█ THANK TO
PineCoders for everything they do, all the tools and help they provide, and their involvement in making a better community. All PineCoders, Pine Pros and Pine Wizards, people who share their work and knowledge because of it and helping others, I am so happy and so grateful.
█ NOTE
This indicator is not a buy and sell recommendation, it indicates the most likely buy and sell points. Every purchase and sale decision is your responsibility
*****************************************************************************************************
** Versão em Português
*****************************************************************************************************
█ SETUP aplicado no Indicador
O setup está baseado na média 8, 21, e 56 do gráfico semanal
Preço acima da média 8 no semanal indica que o mercado esta em tendência de ALTA, abaixo da média 8 no semanal que o mercado está em tendência de BAIXA
RSI maior que 60% o mercado está em ALTA
RSI maior que 40% e menor 60% o mercado está em ACUMULAÇÃO
RSI menor que 40% o mercado está em BAIXA
A média 8 semanal está representadas nas cores VERDE (Tendência de Alta) e VERMELHA (Tendência de Baixa).
A média 21 semanal está representada na cor laranja claro
A média 56 semanal está representada na cor roxa claro
O cruzamento das médias 8 e 21 semanal esta representado com uma cruz VERDE (Tendência de ALTA) e VERMELHA (Tendência de BAIXA) - este sinal esta desativado no gráfico mas você pode ativá-lo clicando no setup do gráfico
█ FUNÇÕES UTILIZADAS
(1) Média 8, 21 e 56 no Semanal - mostra a média 8, 21, e 56 no gráfico
(2) Cruzamento das médias 8 e 21 Semanal - não está ativo mas você pode ativá-lo
(3) Cálculo do RSI
(4) barcolor() - marca a vela (Candle) com a cor verde (Mercado em Alta) e a cor vermelha (Mercado em Baixa)
(5) alertcondition () - você pode ativar o alerta no Tradingview
█ PONTOS DE COMPRA E VENDA - prováveis pontos
A indicação da posição de COMPRA é apresentada por uma seta na cor verde apontada para cima e a posição de VENDA por uma seta na cor vermelha apontada para baixo. As indicações de compra e venda são obtidas a partir da divergência na tendência do mercado.
█ OBRIGADO PARA
PineCoders por tudo o que fazem, todas as ferramentas e ajuda que fornecem, e seu envolvimento em fazer uma comunidade melhor. Todos os PineCoders, Pine Pros e Pine Wizards, pessoas que compartilham seu trabalho e conhecimento por causa dele e ajudando os outros, estou muito feliz e muito grato.
█ NOTA
Este indicador não é uma recomendação de compra e venda ele indica os pontos mais prováveis de compra e venda. Toda decisão de compra e venda é de sua responsabilidade

M.Right_ OBV / Volume Smoothed RSI & 3 RSI EMAsFirst, I'd like to thank all those coders who've inspired me to learn and code my own indicator. This is the result of tireless hours of work learning to code and tweaking until everything fits exactly what I was looking for. After using it for a while and seeing the benefits personally, I figured now might be a good time to share with everyone while we are in such great market volatility , maybe I can save you some losses.
Basically, my indicator is meant to use RSI, Volume, and Volatility to show where oversold and overbought levels are, but also good times to buy and alerts.
I've tried to make my indicators as customizable as possible with all the bells and whistles you'd expect, but to have Proprietary calculations under the hood that you probably won't find anywhere else.
This indicator is a great pair with my Top and Bottom Finder.
Features:
Works on all timeframes.
Alerts.
Background highlights.
Buy/Sell signals and arrows (with the option to remove them).
Let me know if you have any questions, and enjoy.
Cheers,
Mike
Fx Crusher Scalping Indicator V1█ OVERVIEW
Scalping Indicator with Buy and Sell Signals for the 15 min and 5 min Chart. Works on all assets (Crypto, Forex, Stocks, Indices, Commodities and Metals)
Only use in trending markets. Signals in a ranging market are useless.
This Scalping Indicator is different from others because most of the Buy/ Sell signals actually make sense. No counter trend trading and most signals can be very profitable when used right.The single most important goal was to have an indicator that shows signals with a big possible risk reward ratio. Most false signals are filtered out. The Fx Crusher Scalping Indicator is not perfect but it is amazing. You can customize the indicator to get the highest signal quality.
█ HOW DOES IT WORK?
The indicator determines the trend direction by using 3 different smoothed moving averages. A green background shows an uptrend and a red background shows a downtrend.
The strength of the trend is determined by the slope of the individual SMMAs. You can set the slope of every single SMMA for buys and sells individually.
The indicator only shows signals when there is a clear trend on the current timeframe.
Entry signals are generated by a combination of Williams fractals, SMMA crossover, trend angle and RSI condition.
█ HOW TO USE?
Draw Support & Resistance lines on the 4H Chart
Determine the overall trend on the 1H Timeframe
Go to the 15 min or 5 min Time Frame and have a look at the signals
Adjust the slope of every single SMMA in 0.01 steps until the signals look good
Adjust the RSI settings for overbought and oversold condition if necessary
Only enter a trade after the candle that prints a signal is closed.
Only take buy positions when all SMMAs are going up and don’t touch each other
Only take sell positions when all SMMAs are going down and don’t touch each other
Only use this Scalping Indicator with proper Risk management and a risk reward ratio of around 1:2.
Trail your stop to get the most pips out of the signals. Very often the indicator shows signals right before major moves.
█ ADDITIONAL INFO
Be careful with buy signals when the market on the higher timeframe (4H and 1H) is in a downtrend and vice versa.
You can make the most profit out of this Indicator when you enter with 2 positions. A quick scalp and a runner. Because there's a lot of signals with huge risk reward ratios but also some unprofitable signals . Therefore make sure you make the best out of the good signals and apply proper risk management to limit losses with bad signals. Stop loss placement according to market structure.
Multiple Signals in a row can show a high probability of a very strong upcoming move. Monitor your trades and secure partials to make the best out of it.
You can select how many signals it is going to show once trend conditions are met. Please be aware that the longer a trend goes, the higher is the probability of a reversal. Therefore the first few signals after all conditions are met are most likely the most profitable.
By setting the slope of the slow SMMA correctly you can filter out most signals in a ranging market.
█ DISCLAIMER
This is not financial advice. I do everything I can to provide the most accurate buy and sell signals for scalping but past results are no guarantee for future performance.

[Hennessy]_Weather Buy Sell Swing SignalENG)
This indicator is based on ATR ( average true range ). The weather emojis are signaling changes in volatility . It generates a signal by breaking the ATR line.
Average True Range (ATR) is the average of true ranges over the specified period. ATR measures volatility , taking into account any gaps in the price movement.
Calculation
ATR = (Previous ATR * (n - 1) + TR ) / n
Where:
ATR = Average True Range
n = number of periods or bars
TR = True Range
The True Range for today is the greatest of the following:
Today's high minus today's low
The absolute value of today's high minus yesterday's close
The absolute value of today's low minus yesterday's close
💥 how to use :
🌈 - Long/Buy
⚡️ - Short/Sell
green ▲- adjust leverage or long hold
red ▼ - adjust leverage or short hold
Exit line - ATR trend line . can be used as an SL line.
💥Trading Strategy
This indicator is appropriate for swing or day traders.
Timeframe recommendation: 1H or 4H
when 🌈 /⚡️ appears it's a first entry point for long/short.
If ▲/▼ signal follows after 🌈 /⚡️ then hold your position until it shows the opposite signal.
However, since ATR is an indicator to find out trend changing points the signal might not be accurate on the "no trend" zone
In "NO TREND ZONE", you may stop trading by using this indicator and wait for the best signal or you may do the followings:
Try to use 21 EMA trend line - after the entry signal if the candle breaks the 21 EMA towards the opposite direction, close 50% of your position.
DO NOT FORGET TO EXIT on an opposite signal to your position. - e.g. enter at 🌈 > exit at ⚡️
Try to avoid entering a new position in NO TREND ZONE and try to use other indicators (such as RSI , Stoch , ADX , KDJ..etc.) as well to get a better result.
KOR)
Hennessy_Weather 지표는 ATR기반 보조지표입니다
TR의 돌파여부 등으로 진입 시그널을 발생시켜줍니다.
ATR( Average True Range )이란?
TR이라는 변동성의 값을 평균화하여 선으로 표현한 지표이다.
ATR지표는 다른지표와 다르게 매매신호를 보여주는것이 아닌, 변동성을 측정하여
종목의 위험도와 투자적합구간이 적합한지의 여부를 보여주는 특징입니다.
TR 구하는 공식으로는
1. 금일의 고가 - 금일의 저가
2. 금일의 고가 - 전일의 종가
3. 금일의 저가 - 전일의 종가
3가지 중 절대값이 가장 큰 값이 TR이 됩니다.
🌈무지개 = 롱 진입 시그널입니다.
⚡️번개 = 숏 진입 시그널입니다.
▲ = 롱 불타기 or 롱포지션 홀딩 시그널입니다.
▼ = 숏 불타기 or 숏포지션 홀딩 시그널입니다.
Exit Line = 단순 ATR을 표기해주는 선이며 매매에 도움 되지 않습니다.
Hennessy_Weather 매매전략
기본적으로 1시간 4시간봉에서 사용하기를 추천드립니다.
● 1시간 이상 타임프레임에서 신뢰도가 더 높으며
저배율로 스캘핑보단 데이트레이딩 혹은 스윙으로가져가시기를 추천 드립니다.
● 기본적으로 🌈(롱) / ⚡️(숏) 시그널에 1차 진입을 하며, 화살표에 불타기 혹은 HOLD를 선택합니다.
진입한 포지션의 반대 시그널이 나올 시에는 스위칭을 원칙으로 합니다.
● ATR은 변동성에 관한 지표이므로 횡보구간에 다소 취약할 수 있습니다.
강한 추세장에선 반대 페이크시그널이 다수 발생할수 있습니다.(저배율로 대응하세요)
● 횡보구간에서의 대응방법은 매매를 하지않는것과 다음과 같이 보수적으로 진입하는 방법이 있습니다.
● 보조도구로 넣어둔 21ema를 위나 아래로 돌파하여 수익발생시 고니, 다시 해당 ema를 돌파하려는 움직임에 엑싯하는 전략
● 몇번의 짧은 손절을 감수하고 🌈에 진입하였다면 반대시그널인 ⚡️에 스위칭하는 원칙매매로 대응하여
큰 방향 발생시 손실을 만회하는 전략이 있습니다.
횡보구간에서는 최대한 진입을 조심하고 다른 보조지표( RSI , Stochastic , ADX ,KDJ)등 과 함께 사용하여 보다 좋은 결과물을 만드시길 바랍니다.

Multi-timeframe MAs + Stoch RSI SignalsHello traders,
I welcome you to my first published script on TradingView: “Multi-timeframe Moving Averages + Stochastic RSI”.
The script is based on a simple formula: Buy signals are generated when a fast moving average is above a slower moving average (uptrend) and the Stochastic RSI K line is crossing above the oversold level (entry).
Sell signals are generated when a fast moving average is below a slower moving average (downtrend) and the Stochastic RSI K line is crossing below the overbought level (entry).
This indicator works best in strong trends!
**Please note the above example has repainting turned on which may produce unrealistic results when viewing historical data. See below for more information regarding this and how you can turn it off.**
The user has the following inputs:
- Option to change the Stochastic RSI settings, including the oversold and overbought levels.
- Option to enter any value for both the Fast Moving Average and the Slow Moving Average.
- Option to change between EMA or SMA for each moving average.
- Multiple time frames to choose from, as well as the ability to selectively turn off individual time frames (both plots and alerts).
(Default time frames are 1 hour, 4 hour, and Daily. You can have a 4th time frame by changing your current time frame to something lower than the other 3 time frames)
- Turn on/off repainting: If repainting is turned on you will get an alert and buy/sell signal on chart immediately when condition is met, however the signal may disappear from chart if the condition reverses during the same candle.
If repainting is turned off, the indicator will wait for the candle to close before issuing the alert and painting the signal on chart.
For higher time frames, the indicator will wait for the candle in the higher time frame to close before issuing a signal if repaint is turned off. Default is set to Repaint on, so please be aware of this if you do not want repainting.
How to use alerts:
- Before you do anything, make sure your current time frame is the lowest time frame you’d like alerts on, as you will still receive alerts for the higher time frames you selected in settings.
- Once you have all the settings changed to how you like, save your chart first. Then right click on any of the indicator’s buy/sell signals on the chart and click “Add Alert on MAs + Stoch RSI”.
- Make sure “Any alert() function call” is selected under the Condition.
- You can delete or change the text in “Alert name” if you want as the alert message is already built into the indicator, and it will tell you in the alert message which asset and time frame to buy or sell.
Other things to note:
- The indicator will not display the buy/sell signals of lower time frames when you are on a higher time frame. This was done purposely to reduce clutter on the chart when you switch to higher time frames.
- While the alert message will tell you which time frame a signal was generated, the plots on the chart will instead show “Buy/Sell TF1, or TF2, or TF3”.
If the signal is from the current time frame that the alert was created on, then it will simply show “Buy” or “Sell”.
Hope you guys enjoy using this one, please drop a like if you found it useful. If anyone wants to modify my script in any way, please just credit me for the original work when you publish the script. Good luck!

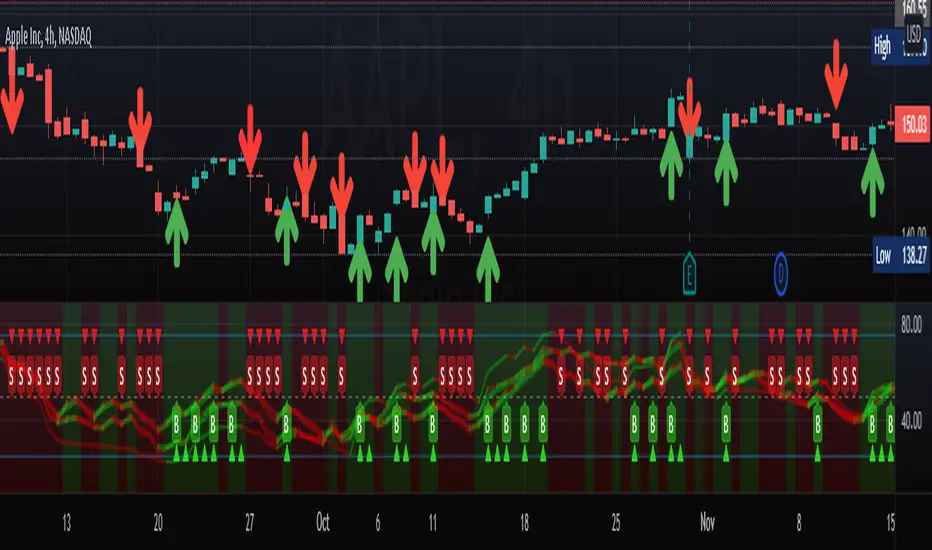
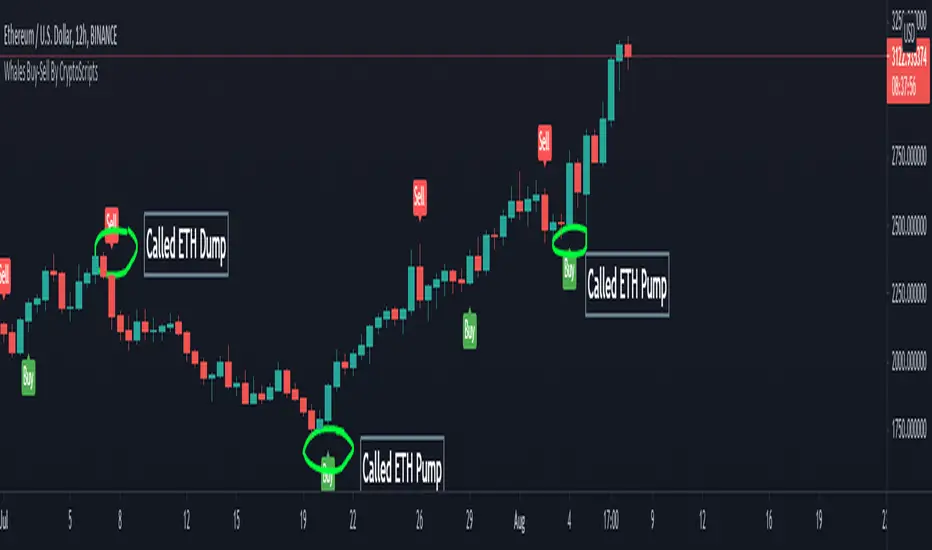
Whales Buy-Sell By CryptoScriptsThe Whales Buy-Sell indicator is very unique because it uses a combination of the smoothing range, average ranges, and hi-band/low-bands combined with various moving averages to nail whenever the overall trend is changing. This is extremely important during periods of high volatility and large moves. It helps to keep someone in a trade longer and get out fast if the trend is changing. The big caveat I can stress is waiting until the candle closes so that you know the signal is confirmed! Use the Bar Replay feature to further understand the intricacies of how the indicator produces signals. I find it is better on larger timeframes (1h and higher) because it's measuring larger trends. It can still be used on smaller timeframes but may not be as accurate. The big shortcoming is that is doesn't do well in choppy environments (i.e barely any price movement up or down) and you may get a lot of back and forth buy/sell signals so PLEASE keep that in mind. Experiment with various tickers/timeframes and see what works best for you :)
This indicator is a trend analysis indicator. Trend analysis is a technique used in technical analysis that attempts to predict future stock price movements based on recently observed trend data. Trend analysis is based on the idea that what has happened in the past gives traders an idea of what will happen in the future, but that is NOT always the case! Past performance is NOT indicative of future returns. There are three main types of trends: short-, intermediate- and long-term. Trend analysis tries to predict a trend, such as a bull market run, and then ride that trend until data suggests a trend reversal, such as a bull-to-bear market.
Alerts
You can set alerts for either a 'Buy Signal' or 'Sell Signal'. I recommend setting alerts for the candle close so that you know the signal is confirmed! If the "Add Alerts" option is greyed out for the indicator, just refresh your tradingview page and you should be able to see it :)
PM me to obtain access and please let me know if you have any questions!
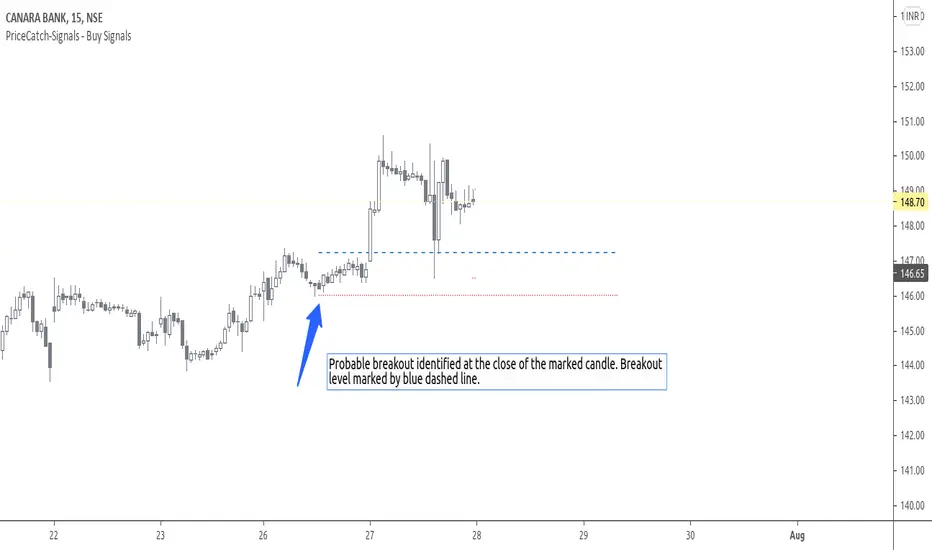
PriceCatch Breakout Signals IOHi TradingView Community.
Here is a script that identifies and marks two different breakout levels on the chart. It works on all instruments - equities, forex, crypto & commodities.
Probable Breakout Buy Level
Stop-Reverse Buy Level
The above chart is self-explanatory. The script uses two different formulas to look out for breakouts. This logic opens up more opportunities.
As the levels are marked in advance before the breakouts occur, it will give traders ample time to study further and plan the trade.
PLAYING SAFE
After taking the trade, to play safe, I follow this method that once the Low of the price goes above the Breakout Level, I usually shift the stop loss to buy price to protect against any sudden reversal. For me protecting capital is important. As usual with price action, longer time-frames produce more reliable signals.
STOP LOSS
While the initial stop level is suggested, traders may also use the ATR to set stop loss. Users may find my free script 'ATR value on Chart' useful.
NOTE - PRIOR TO USING THIS SCRIPT:
You may use this script in addition to your other indicators or independently. Please remember that the script is shared with absolutely no assurances and warranties whatsoever regarding usability and as a responsible trader, please satisfy yourselves thoroughly and use it only if you are convinced it works for you. Remember, you are 100% responsible for your actions. If you understand and accept that, you may use the script. The script does not identify any short signals.
QUERIES/FEEDBACK
Please PM me.
Regards to all and wish everyone all the best with trading.

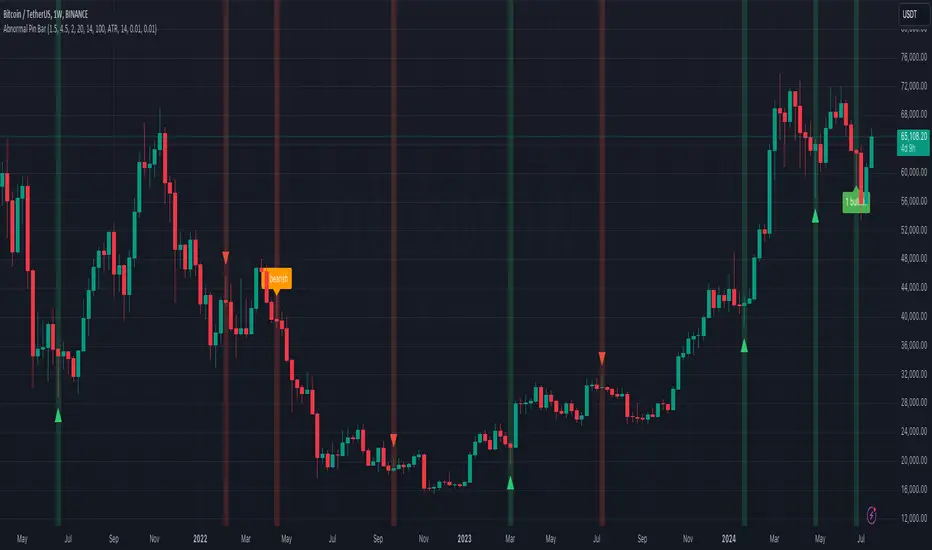
Abnormal Pin BarPin Bar is one of the most important candlestick patterns. Almost every time you see a pin bar, you can expect the price to turn in the opposite direction.
You should pay more attention to the abnormal ones among the pin bars. What I mean by abnormal pin bar is that the long leg is at least 3 times larger than the body.
With this indicator, you can set your own abnormal pin bar settings. The indicator will highlight abnormal pin bars according to the settings you specified.
The indicator uses the following three factors to indicate abnormal pin bar:
- Minimum body ratio in the pattern in percent
- Minimum ratio of the long shadow to the body
- Minimum ratio of the long shadow to the short shadow
Also, there is a volume strength check to confirm the pin bar. If the volume where the pin bar is formed is greater than the 20 volume average, it indicates that the pin bar is more important. Of course, confirming the pin bar with the volume is optional and you can disable it in settings if you wish.
You can use the highlights of this indicator as an entry signal if the pin bar appears at the trend key levels or in support or resistance zones.
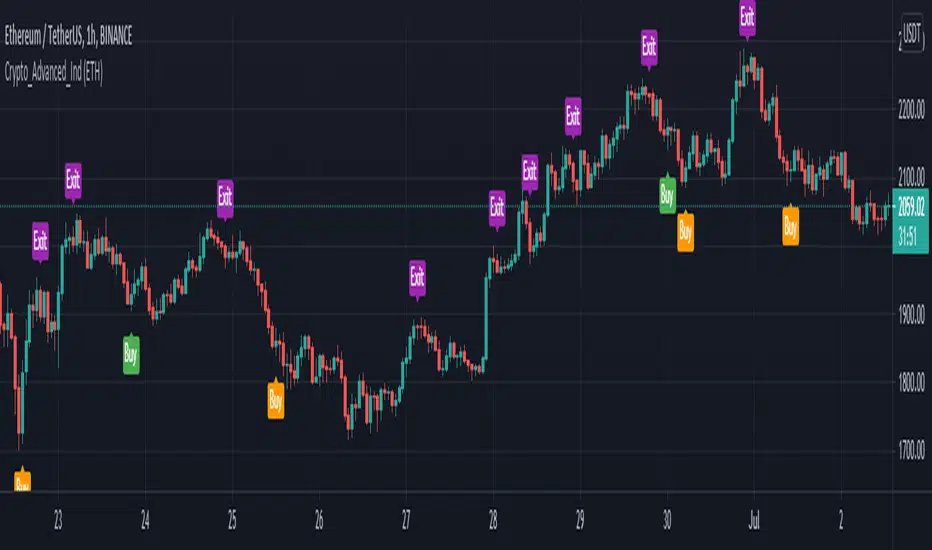
Crypto Advanced Trading IndicatorThe Crypto Indicator gives you a true picture of the market entry points, after a scan it does every period (after every candlestick closes) . It is pretty straightforward in its use with clear visual representation of the entry and exit points provided by the indicator.
This allows you to make improved entry and exit points and accommodates many trading styles, systems, and strategies.
It will work along most TradingView indicators and the timeframes we recommend you using it in are the 1H and sometimes the 4H chart.
The specific components of the indicator are:
Methodology:
The indicator uses a MACD oscillator to determine the local trend direction and to give buy & exit signals when its conditions are met.
An optional TradingView indicator, exponential moving average cross (EMA cross), can be used to filter out 'false' signals.
The calculation of the entry points are drawn from specific different prices for every one of the coins hardcoded in the script, and the filter function in the indicator settings, allows the user to change those prices based on the coin he is currently watching, based on the specific coin it is chosen in the filter.
Persistent variables are used for buy and exit prices, enabling color-coding of the signals (profitable or not).
Features:
Color coded labels - Buy, Exit = purple
Two types of entries - Bull Buy = green, Bear Buy = orange
Coin filter
Buy signal alerts
Remarks:
In our experience and therefore recommendation, the values used for each crypto coin work best on the 1-Hour timeframe. We encourage everyone to experiment, but the best results we had, were on this specific timeframe or higher.
Using the indicator on non-standard charts (Heikin Ashi, Renko etc.) can produce unrealistic results.
- Thanks to John Aslanis and Alexandros Temelkou the idealists and creators of this indicator.
Use the link below to watch a tutorial video, request a trial, or purchase for access:
Pivot Boss -- Squat bars and Non Squat Bars 2.0Squat Bar Signal -- current Volume is greater than previous volume but Current bar MFI(Market Facilitation index) is lesser than previous bar MFI
Other Conditions -- Current Bars Range is lesser than (Average Range * Range Multiplier)
Non Squat Bar Buy Signal(Green Up Triangle) -- Volume and MFI is greater than previous bar, Close greater than open, Close is greater than midpoint
Non Squat Bar Sell Signal(Red Down Triangle) -- Volume and MFI is greater than previous bar, Close lesser than open, Close is lesser than midpoint
Usually Squat signal is confirmed by Non Squat Bar Signal..
Other indicator used -- PEMA -- Pivot based EMA
For Better results use it along with Advanced Volume indicator and PEMA
PriceCatch NASDAQ Breakout Stocks Screener FHi,
Tradingview community and NASDAQ traders. Warm Greetings.
NASDAQ Breakout Stocks Screener
I am sharing a script that screens NASDAQ stocks for Probable Breakout Buy signal and Stop-Reverse Buy Signal. This script may prove to be useful to traders who trade NASDAQ listed stocks.
I have already shared the script "PriceCatch Signals Buy Signals" that marks the following levels on the chart.
Probable Breakout Buy Level
Stop-Reverse Buy Level
While the script "PriceCatch Signals Buy Signals" can be used independently, this script is intended to be used with the script "PriceCatch Signals Buy Signals".
Used together, these two scripts may help you identify probable breakout opportunities. This Screener will help you screen stocks that have broken out of any of the Breakout levels marked by the "PriceCatch Signals Buy Signals" script. This way you can quickly and automatically identify breakout stocks without manually going through every stock in your watchlist searching for breakout signals.
Please read the Notes of the script "PriceCatch Signals Buy Signals" for explanation of its functionality.
STOCKS SET
This Free screener scans a list of 20 stocks. The full version scans a list of 160 stocks. Care has been taken to include liquid stocks with over 500K daily volume.
Chart resolution vs. Script resolution
It is suggested to set the chart resolution to a lower time-frame than the Screener resolution. For example, if the screener resolution is set to 1 Hour time-frame, set the chart resolution to less than 1 Hour time-frame and run the Screener.
CHART
The Screener runs independently and you may have any chart on your screen. As you can see chart is showing XLNX and the screener has identified a set of other stocks.
NOTE - PRIOR TO USING THIS SCRIPT:
Please remember that the script is shared with absolutely no assurances about usability and any warranties whatsoever and as a responsible trader, please satisfy yourselves thoroughly and use it only if you are satisfied it works for you. Remember, you are 100% responsible for your actions. If you understand and accept that, you may use the script.
QUERIES/FEEDBACK
Please PM me.
Regards to all and wish everyone all the best with trading.

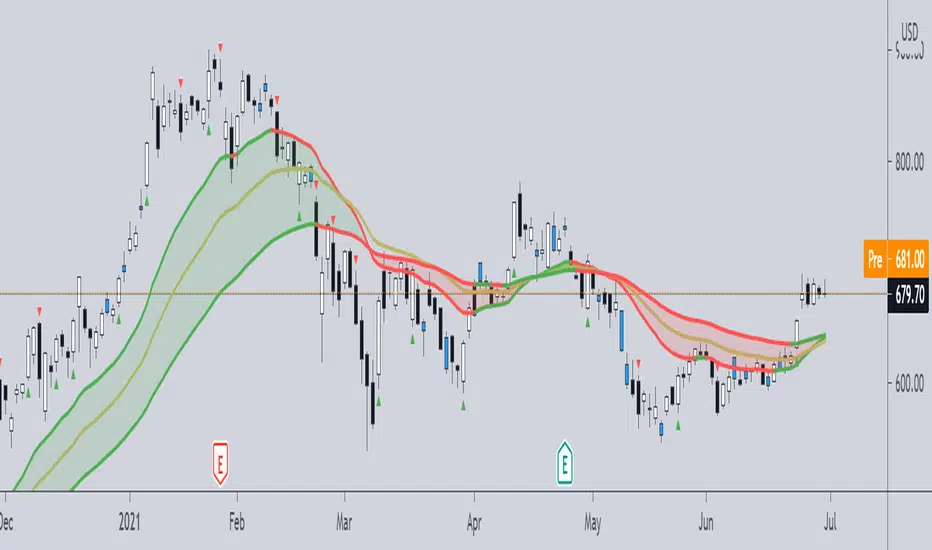
PriceCatch-Signals - Buy SignalsHi,
TradingView Community.
Here is a script that identifies and marks two different buy levels on the chart. It works on all asset classes - equities, forex, crypto.
Probable Breakout Buy Level
Stop-Reverse Buy Level
The bottom images are self-explanatory.
PROBABLE BREAKOUT BUY LEVEL EXAMPLE:
STOP-REVERSE BUY LEVEL EXAMPLE:
IDENTIFICATION OF LEVELS:
The Blue Dotted line represents Probable Breakout Buy Level and the Blue Dashed Line Stop-Reverse Buy Level. The corresponding Red Dotted line below each level should be your initial stop loss price point.
PLAYING SAFE
After taking the trade, to play safe, I follow this method that once the Low of the price goes above the Buy Level, I usually shift the stop loss to buy price to protect against any sudden reversal. For me protecting capital is important. As usual with price action, longer time-frames produce more reliable signals.
NOTE - PRIOR TO USING THIS SCRIPT:
The script uses Heikin-Ashi Candles data to identify the levels. You may use this script in addition to your other indicators or in isolation. Please remember that the script is shared with absolutely no assurances and warranties whatsoever and as a responsible trader, please satisfy yourselves thoroughly and use it only if you are satisfied it works for you. Remember, you are 100% responsible for your actions. If you understand and accept that, you may use the script. The script does not identify any short signals.
ADDITIONAL NOTE:
I shall also be releasing Screener scripts that scan the following markets for the above two conditions or signals thereby helping traders spot opportunities at the right time by making the task of finding right stocks a breeze.
NASDAQ Stocks Screener (Can screen a total number of 160 stocks. 40 stocks at a time)
UK LSE Stocks Screener (Can screen a total number of 90 stocks. 30 stocks at a time)
Euronext Paris Stocks Screener (Can screen a total number of 50 stocks. 25 stocks at a time) - in development.
Singapore Stocks Screener is in development
Other International exchanges will be added based on response from users.
SOME MORE CHARTS:
QUERIES/FEEDBACK
Please PM me.
Regards to all and wish everyone all the best with trading.
PriceCatch-Signals - Buy SignalHi,
TradingView Community.
Here is a script that identifies and marks two different buy levels on the chart. It works on all asset classes - equities, forex, crypto.
Probable Breakout Buy Level
Stop-Reverse Buy Level
The bottom images are self-explanatory.
PROBABLE BREAKOUT BUY LEVEL EXAMPLE:
STOP-REVERSE BUY LEVEL EXAMPLE:
IDENTIFICATION OF LEVELS:
The Blue Dotted line represents Probable Breakout Buy Level and the Blue Dashed Line Stop-Reverse Buy Level. The corresponding Red Dotted line below each level should be your initial stop loss price point.
PLAYING SAFE
After taking the trade, to play safe, I follow this method that once the Low of the price goes above the Buy Level, I usually shift the stop loss to buy price to protect against any sudden reversal. For me protecting capital is important. As usual with price action, longer time-frames produce more reliable signals.
NOTE - PRIOR TO USING THIS SCRIPT:
The script uses Heikin-Ashi Candles data to identify the levels. You may use this script in addition to your other indicators or in isolation. Please remember that the script is shared with absolutely no assurances and warranties whatsoever and as a responsible trader, please satisfy yourselves thoroughly and use it only if you are satisfied it works for you. Remember, you are 100% responsible for your actions. If you understand and accept that, you may use the script. The script does not identify any short signals.
ADDITIONAL NOTE:
I shall also be releasing Screener scripts that scan the following markets for the above two conditions or signals thereby helping traders spot opportunities at the right time by making the task of finding right stocks a breeze.
NASDAQ Stocks Screener (Can screen a total number of 160 stocks. 40 stocks at a time)
UK LSE Stocks Screener (Can screen a total number of 90 stocks. 30 stocks at a time)
Euronext Paris Stocks Screener (Can screen a total number of 50 stocks. 25 stocks at a time) - in development.
Singapore Stocks Screener is in development
Other International exchanges will be added based on response from users.
SOME MORE CHARTS:
QUERIES/FEEDBACK
Please PM me.
Regards to all and wish everyone all the best with trading.

PriceCatch-SignalsHi,
TradingView Community.
Here is a script that identifies and marks two different buy levels on the chart. It works on all asset classes - equities, forex, crypto.
Probable Breakout Buy Level
Stop-Reverse Buy Level
The bottom images are self-explanatory.
PROBABLE BREAKOUT BUY LEVEL EXAMPLE:
STOP-REVERSE BUY LEVEL EXAMPLE:
IDENTIFICATION OF LEVELS:
The Blue Dotted line represents Probable Breakout Buy Level and the Blue Dashed Line Stop-Reverse Buy Level. The corresponding Red Dotted line below each level should be your initial stop loss price point.
PLAYING SAFE
After taking the trade, to play safe, I follow this method that once the Low of the price goes above the Buy Level, I usually shift the stop loss to buy price to protect against any sudden reversal. For me protecting capital is important. As usual with price action, longer time-frames produce more reliable signals.
NOTE - PRIOR TO USING THIS SCRIPT:
The script uses Heikin-Ashi Candles data to identify the levels. You may use this script in addition to your other indicators or in isolation. Please remember that the script is shared with absolutely no assurances and warranties whatsoever and as a responsible trader, please satisfy yourselves thoroughly and use it only if you are satisfied it works for you. Remember, you are 100% responsible for your actions. If you understand and accept that, you may use the script. The script does not identify any short signals.
ADDITIONAL NOTE:
I shall also be releasing Screener scripts that scan the following markets for the above two conditions or signals thereby helping traders spot opportunities at the right time by making the task of finding right stocks a breeze.
NASDAQ Stocks Screener (Can screen a total number of 160 stocks. 40 stocks at a time)
UK LSE Stocks Screener (Can screen a total number of 90 stocks. 30 stocks at a time)
Euronext Paris Stocks Screener (Can screen a total number of 50 stocks. 25 stocks at a time) - in development.
Singapore Stocks Screener is in development
Other International exchanges will be added based on response from users.
SOME MORE CHARTS:
QUERIES/FEEDBACK
Please PM me.
Regards to all and wish everyone all the best with trading.


CryptoSignalScanner - MACD Multiple Time FramesDESCRIPTION:
After receiving some multiple request to provide a MACD indicator that displays multiple timeframes at the same time I created this simple script.
You can use this script for free and adjust it as much you like.
With this script you can plot 6 MACD lines & 6 Signal lines.
• Current Timeframe MACD Line
• Current Timeframe Signal Line
• 15 minute candle MACD Line
• 15 minute candle Signal Line
• 30 minute candle MACD Line
• 30 minute candle Signal Line
• 1 hour candle MACD Line
• 1 hour candle Signal Line
• 2 hour candle MACD Line
• 2 hour candle Signal Line
• 4 hour candle MACD Line
• 4 hour candle Signal Line
HOW TO USE:
• When multiple MACD lines on an uptrend are grouped together it is time to SELL.
• When multiple MACD lines on a downtrend are grouped together it is time to BUY.
• The higher to length of the MACD lines the stronger the BUY/SELL signal.
FEATURES:
• You can show/hide the preferred MACD lines.
• You can show/hide the preferred Signal lines.
How MACD works
The MACD indicator is generated by subtracting two exponential moving averages (EMAs) to create the main line (MACD line), which is then used to calculate another EMA that represents the signal line. In addition, there is the MACD histogram, which is calculated based on the differences between those two lines. The histogram, along with the other two lines, fluctuates above and below a center line, which is also known as the zero line.
The MACD indicator consists of three elements moving around the zero line:
• The MACD line. By default the MACD line is calculated by subtracting the 26-day EMA from the 12-day EMA.
MACD line = 12d EMA - 26d EMA
• The signal line. By default the signal line is calculated from a 9-day EMA of the MACD line.
Signal line = 9d EMA of MACD line
• Histogram. The histogram is nothing more than a visual record of the relative movements of the MACD line and the signal line.
It is simply calculated as: MACD line - signal line
REMARKS:
• This advice is NOT financial advice.
• We do not provide personal investment advice and we are not a qualified licensed investment advisor.
• All information found here, including any ideas, opinions, views, predictions, forecasts, commentaries, suggestions, or stock picks, expressed or implied herein, are for informational, entertainment or educational purposes only and should not be construed as personal investment advice.
• We will not and cannot be held liable for any actions you take as a result of anything you read here.
• We only provide this information to help you make a better decision.
• While the information provided is believed to be accurate, it may include errors or inaccuracies.
Good Luck,
SEOCO

Wealthy Tech v1.4This script was design to guide the trader in three different ways as a "one stop" place so the trader can have all the basics covered and working together , the indicator is organized by two control panels and one set of technical tools.
1 - First Panel - "Advanced Trading Tools"
- Providing many important parameters that a trader must know before sending an order.
- Displays a green, yellow or red signal in front of the current data helping the trader to quickly identify the overall status of the asset.
- Parameters such as :
Average Daily Range in the past 20 days (ADR)
Current ADR of the day, Live ADR of the current Open/Close
Relative Strength , if in a Bull or Bear Market
Minimum and recommended Dollar Volume to guarantee the necessary liquidity
StochRSI warnings if oversold or bought
Volume /relative volume corresponds to a minimum for a good liquidity
Distance of the current price to the majors moving averages
Also a quick way to have your order size automatically calculated with a stop loss set at either the lows of the day or the last Lower High, giving you an order size and max risk/loss at all times.
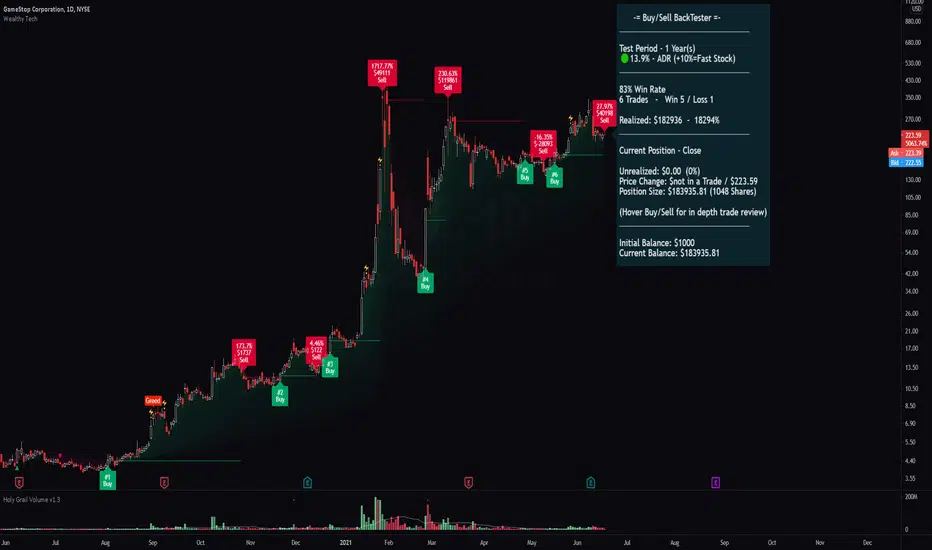
2 - Second Panel - "Buy/Sell Signal tool with live Backtester"
- Buy and Sell signals are provided for the beginner/busy trader. Using a set of combinations to determine the most probable period to enter and exit with adjustability by the user being able to choose how fast or slow the parameters should track the data.
- The live Backtester shows positions and historically calculations of all the Buy/Sell signals during the requested period. Showing how much you would've profit/lose if you had took those trades, helping you to decide which timeframe to use in conjunction to the Buy/Sell speed to give the most profitable probability.
- By hovering on the Buy/Sell, you'll find in depth information about each trade (Trading View limits the number of information the is being showed in a chart. If you have too many trades going back in history, it'll only show the max available)
- Keep in mind that the Buy/Sell signal repaints only while the candle is open. If you don't want to take your chances for a better entry, just wait for the candle to close so you have your confirmation. Over time you'll evolve a sense of all the functionalities and learn how to quickly identify what the indicator is trying to show. It takes a few tries to catch a big move, don't be afraid to be stopped or a low Win rate. What really matter is how much you're realizing by the end of the day. You most probably won't have any success in trade if you aren't able to stop your bad trades.
3 - Technical indicators and Visual Implementations
- Tools such as:
Open Range High/Low showing the first 30 min of the day. One of the best ways to identify and perfect breakout entry point
Improved MAs with auto color change indicating when it is strong or weak
MAs Flow Cloud for a generalized asset visualization of a Bull/Bear Market
Scalp line with variable speed helps you get in and our of a scalp with confidence.
High Volatility Reversals and Fear/Greed shows you the most probable point of a reversal/resistance to happen.
Volume Spike
Higher High / Higher Low / Lower High / Lower Low plots to help you visualize the channels.
The indicator is in BETA version, improvements and fixes will be added constantly.
New ideas and recommendations are welcomed.
Thank you very much for your time
No-lose trading targets (based on RSI) By Mustafa ÖZVERThis code shows expected reaction target prices after sudden moving based on RSI. Red area means the price is on overbought area, green area means the price is on oversold area. If you see red area under price, you can make short option to next to the horizontal beginning price of red area. If you see green area over price, you can make long option to next to the horizontal beginning price of green area.
When this code works
- The green area starts where rsi value is on oversold
- The red area starts where rsi value is on overbought
Of course, this code may be failed, do not forget the target may never come. But hopefully price will cross over the target.
And you (as developers) can develop this code by using anything instead of rsi to get up-down target prices.
But only this values can not guarantee good results for trading. BE CAREFUL
