Larry Williams Qualified Trend Break Signals [tradeviZion]Larry Williams Qualified Trend Break Signals - Description
📖 Introduction
Welcome to the Larry Williams Qualified Trend Break Signals indicator. This description explains how the indicator works, its settings, and how to use it.
This indicator demonstrates Larry Williams' Qualified Trend Line Break technique - his preferred method for timing precise entries on daily charts when you already have a confirmed market setup.
---
🎯 About This Script
This indicator implements the Qualified Trend Line Break system - an entry technique that qualifies trend line breaks for better timing.
Important: This is NOT a signal generator. It's an entry timing tool for traders who already have a market setup and confirmation. Use it only after establishing weekly bias and daily confirmation.
Why We Made This Indicator:
This indicator demonstrates Larry Williams' favorite entry technique for daily timeframe trading. It's designed to be used as part of his complete methodology:
How To Use It Properly:
First, establish your setup: Check weekly chart for overall market bias (bullish/bearish)
Then confirm on daily: Look for confirmation signals on daily timeframe
Finally, use trend breaks: Enter trades only when trend breaks align with your setup direction
Important Warning: This is NOT a standalone buy/sell signal indicator. Using trend breaks without proper setup and confirmation will likely produce poor results. It's a timing tool for entries, not a signal generator.
---
About The Qualification Rules
The system improves on qualification methodology with these key changes:
For BUY signals (breaking above downtrend lines):
Break is usually bad if previous bar closed higher
But can still be good if:
Previous bar was inside the prior bar AND that prior bar closed lower
Price gaps above trend line and moves up at least one tick
Previous bar closed below its own opening price
For SELL signals (breaking below uptrend lines):
Break is usually bad if previous bar closed lower
But can still be good if:
Previous bar was inside the prior bar AND that prior bar closed higher
Price gaps below trend line and moves down at least one tick
Previous bar closed above its own opening price
---
📐 How The Qualification System Works
The trend break system is based on qualification methodology as developed by Larry Williams . It solves the problem where trend line breaks often fail and price goes back.
Trend Line Setup:
For BUY signals: Connect the two most recent declining swing highs to make a downtrend line
For SELL signals: Connect the two most recent rising swing lows to make an uptrend line
Inside Bar Rule:
A key principle: Trend breaks that occur on inside bars are completely ignored. The system only evaluates breaks that occur on regular bars, making signals more reliable.
How It Works In The Code
The indicator follows these steps:
Finds swing points: Identifies highs and lows in the price action
Draws trend lines: Connects 2 recent swing points to make trend lines
Checks inside bars: Ignores breaks that happen on inside bars
Qualifies signals: Uses the rules to check if breaks are good or bad
Shows signals: Only displays qualified BUY/SELL signals
Optional feature: Can show disqualified signals
⚙️ Settings
The indicator has 3 groups of settings to customize how it works.
---
📊 Signal Settings
Show Signals
Default: ON
ON: Displays green/red labels when trend breaks qualify for entry
OFF: Hides entry labels (trend lines still show for analysis)
Remember: These are entry TIMING signals, not standalone buy/sell signals
Signal Selection
Default: Both | Options: Buy Only, Sell Only, Both
Buy Only: Shows only BUY signals
Sell Only: Shows only SELL signals
Both: Shows both BUY and SELL signals
Break Validation
Default: Close | Options: Break Level, Close
Break Level: Signal when price touches the trend line (more signals)
Close: Signal when bar closes beyond trend line (fewer signals)
Tip: Try "Close" first for better signals
Show Disqualified
Default: OFF | Options: ON/OFF
What it does: Shows bad breaks
ON: Shows gray ❌ labels with explanations
OFF: Hides bad signals
👁️ Display Settings
Show Trend Lines
Default: ON
What it does: Shows trend lines on the chart
Looks like: Dashed blue lines connecting swing points
Goes to: Extends into future bars
Why: Shows where breakouts are expected
Show Swing Points
Default: ON
What it does: Marks highs/lows used for trend lines
Looks like: Shape markers at swing locations
Shows: How trend lines are constructed
Marker Style
Default: Circle | Options: Circle, Triangle, Square, Diamond, Cross
What it does: Choose shape for swing markers
Options: Circle, Triangle, Square, Diamond, Cross
Best choice: Circle is clear without being busy
Marker Size
Default: 3 | Range: 1-10
What it does: Controls marker size
Range: 1 (tiny) to 10 (large)
Show Inside Bars
Default: ON
What it does: Highlights inside bars
Looks like: Light orange background on inside bars
Note: These bars are ignored for break qualification
Important: Inside bars are ignored for break qualification
🎨 Colors
Signal Colors
Buy Signal (Default: Green) - Color for good BUY signals
Sell Signal (Default: Red) - Color for good SELL signals
Disqualified (Default: Gray) - Color for bad signals
Display Colors
Trend Line (Default: Blue) - Color for trend lines and markers
Inside Bar (Default: Light Orange) - Background for inside bars
💡 How To Use It In Larry Williams Methodology
Step 1 - Weekly Setup: Identify market bias on weekly chart (clear bullish/bearish trend)
Step 2 - Daily Confirmation: Find confirmation signals on daily timeframe
Step 3 - Trend Break Entry: Use qualified trend breaks only in setup direction
Important: Never enter based on trend breaks alone - always require setup + confirmation first
⚠️ Important Notice
This indicator implements Larry Williams' trend break entry technique. It should NOT be used as standalone buy/sell signals. Only use trend breaks for entry timing after you have established a proper market setup and confirmation. Poor results will occur if using signals without the complete Larry Williams methodology.
Credits: Based on Larry Williams' trading approach and qualification methodology. Swing detection logic adapted from "Larry Williams: Market Structure" by Smollet.
Buysellsignals

Leswin Stocks Ribbon Signals (SPY/QQQ)
Leswin Ribbon Signals – Day Trading Indicator (Stocks & Crypto)
Leswin Ribbon Signals is a trend-based momentum indicator designed for day traders and scalpers who trade stocks, ETFs, options, and crypto.
Built for fast execution on 5m, 15m, and 1H timeframes, it uses a dynamic EMA ribbon, trend filtering, and volatility conditions to help identify high-probability BUY and SELL zones while avoiding low-quality chop.
Features:
• Trend-following EMA ribbon
• Automatic higher-timeframe trend filter
• Smart BUY & SELL signals
• Volatility (ATR) filter to avoid dead zones
• Regular Trading Hours (RTH) filter for stocks
• Optimized for SPY, QQQ, DIA, IWM, TSLA, AAPL, META
• Works on crypto, forex, and futures
• Mobile-friendly
• Non-repainting logic
This indicator is best used as a confirmation tool, not a standalone system. Always combine with your own levels, structure, and risk management.

Buy on Blue, Sell on Red (EMA + optional RSI) TyusEThis indicator is a trend-following system that helps traders identify potential buy and sell opportunities using a combination of EMA crossovers and an optional RSI filter for confirmation.
It plots:
🔵 Blue dots (BUY signals) when the fast EMA crosses above the slow EMA — signaling bullish momentum.
🔴 Red dots (SELL signals) when the fast EMA crosses below the slow EMA — signaling bearish momentum.
You can optionally filter these signals using the RSI (Relative Strength Index) to avoid false breakouts — for example, only taking BUY signals when RSI is above 55 (showing strength) and SELL signals when RSI is below 45 (showing weakness).
⚙️ Features
Adjustable Fast EMA and Slow EMA lengths
Optional RSI confirmation filter
Customizable RSI thresholds for entries
“Confirm on bar close” setting to reduce repainting
Built-in alert conditions for real-time notifications
💡 How to Use
Use blue dots as potential long entries and red dots as potential short entries.
Confirm direction with overall trend, structure, or higher timeframe alignment.
Combine with support/resistance, volume, or price action for best results.
⚠️ Note
This is a technical tool, not financial advice. Always backtest and use proper risk management before trading live markets.
T.E

Professional ORB Strategy - BUY & Sell signal- Ganesh SelvarayarORB 15 mins strategy buy and sell signal, with point system for your target

Reversal Trading Bot Strategy[BullByte]Overview :
The indicator Reversal Trading Bot Strategy is crafted to capture potential market reversal points by combining momentum, volatility, and trend alignment filters. It uses a blend of technical indicators to identify both bullish and bearish reversal setups, ensuring that multiple market conditions are met before entering a trade.
Core Components :
Technical Indicators Used :
RSI (Relative Strength Index) :
Purpose : Detects divergence conditions by comparing recent lows/highs in price with the RSI.
Parameter : Length of 8.
Bollinger Bands (BB) :
Purpose : Measures volatility and identifies price levels that are statistically extreme.
Parameter : Length of 20 and a 2-standard deviation multiplier.
ADX (Average Directional Index) & DMI (Directional Movement Index) :
Purpose : Quantifies the strength of the trend. The ADX threshold is set at 20, and additional filters check for the alignment of the directional indicators (DI+ and DI–).
ATR (Average True Range) :
Purpose : Provides a volatility measure used to set stop levels and determine risk through trailing stops.
Volume SMA (Simple Moving Average of Volume ):
Purpose : Helps confirm strength by comparing the current volume against a 20-period average, with an optional filter to ensure volume is at least twice the SMA.
User-Defined Toggle Filters :
Volume Filter : Confirms that the volume is above average (or twice the SMA) before taking trades.
ADX Trend Alignment Filter : Checks that the ADX’s directional indicators support the trade direction.
BB Close Confirmation : Optionally refines the entry by requiring price to be beyond the upper or lower Bollinger Band rather than just above or below.
RSI Divergence Exit : Allows the script to close positions if RSI divergence is detected.
BB Mean Reversion Exit : Closes positions if the price reverts to the Bollinger Bands’ middle line.
Risk/Reward Filter : Ensures that the potential reward is at least twice the risk by comparing the distance to the Bollinger Band with the ATR.
Candle Movement Filter : Optional filter to require a minimum percentage move in the candle to confirm momentum.
ADX Trend Exit : Closes positions if the ADX falls below the threshold and the directional indicators reverse.
Entry Conditions :
Bullish Entry :
RSI Divergence : Checks if the current close is lower than a previous low while the RSI is above the previous low, suggesting bullish divergence.
Bollinger Confirmation : Requires that the price is above the lower (or upper if confirmation is toggled) Bollinger Band.
Volume & Trend Filters : Combines volume condition, ADX strength, and an optional candle momentum condition.
Risk/Reward Check : Validates that the trade meets a favorable risk-to-reward ratio.
Bearish Entry :
Uses a mirror logic of the bullish entry by checking for bearish divergence, ensuring the price is below the appropriate Bollinger level, and confirming volume, trend strength, candle pattern, and risk/reward criteria.
Trade Execution and Exit Strateg y:
Trade Execution :
Upon meeting the entry conditions, the strategy initiates a long or short position.
Stop Loss & Trailing Stops :
A stop-loss is dynamically set using the ATR value, and trailing stops are implemented as a percentage of the close price.
Exit Conditions :
Additional exit filters can trigger early closures based on RSI divergence, mean reversion (via the middle Bollinger Band), or a weakening trend as signaled by ADX falling below its threshold.
This multi-layered exit strategy is designed to lock in gains or minimize losses if the market begins to reverse unexpectedly.
How the Strategy Works in Different Market Conditions :
Trending Markets :
The ADX filter ensures that trades are only taken when the trend is strong. When the market is trending, the directional movement indicators help confirm the momentum, making the reversal signal more reliable.
Ranging Markets :
In choppy markets, the Bollinger Bands expand and contract, while the RSI divergence can highlight potential turning points. The optional filters can be adjusted to avoid false signals in low-volume or low-volatility conditions.
Volatility Management :
With ATR-based stop-losses and a risk/reward filter, the strategy adapts to current market volatility, ensuring that risk is managed consistently.
Recommendation on using this Strategy with a Trading Bot :
This strategy is well-suited for high-frequency trading (HFT) due to its ability to quickly identify reversal setups and execute trades dynamically with automated stop-loss and trailing exits. By integrating this script with a TradingView webhook-based bot or an API-driven execution system, traders can automate trade entries and exits in real-time, reducing manual execution delays and capitalizing on fast market movements.
Disclaimer :
This script is provided for educational and informational purposes only. It is not intended as investment advice. Trading involves significant risk, and you should always conduct your own research and analysis before making any trading decisions. The author is not responsible for any losses incurred while using this script.

Smart Adaptive Signal SystemSmart Adaptive Signal System
Description: The Smart Adaptive Signal System is a sophisticated indicator that generates intelligent buy/sell signals by dynamically adapting to market conditions. It predicts target prices based on momentum and volatility, providing more accurate and reliable trading opportunities.
How It Works:
Dynamic Signal Generation: The system predicts target prices by considering factors such as volatility and momentum. This allows it to react instantly to trend changes and market fluctuations.
Adaptive Thresholds: Buy and sell signals are triggered with adaptive thresholds, adjusting according to market volatility. This ensures flexibility in the face of sudden market changes.
Trend-Based Reset: Users can choose to reset threshold values based on a time interval or trend change. This feature helps the system re-adapt to current market conditions for greater accuracy.
Target Price Prediction: Target prices are calculated using momentum and volatility, helping the system predict future price movements.
How to Use:
Buy/Sell Signals: The indicator generates buy and sell signals based on market conditions. Look for a "down arrow" for a buy signal and an "up arrow" for a sell signal on the chart.
Target Price Lines: Along with buy and sell signals, the system draws target price lines. This helps you visualize potential future price levels.
Flexible Settings: Users can customize analysis periods, minimum change percentages, and other parameters to fit their needs.
Features:
Dynamic buy and sell signals
Target price predictions
Volatility and momentum-based analysis
User-friendly and flexible settings
Trend-based adaptive resetting
Alerts: The Smart Adaptive Signal System responds quickly to sudden market changes, but always use it in conjunction with other indicators like support and resistance levels. Signal accuracy may vary depending on market conditions.
mr.crypto731Description:
📊 Enhanced MACD with Strong Buy/Sell Signals 🚀
This script is designed to enhance the standard MACD indicator by adding clear, strong buy and sell signals. It includes:
MACD Line: A fast-moving average that reacts quickly to price changes.
Signal Line: A slower-moving average that smooths out price fluctuations.
MACD Histogram: The difference between the MACD Line and Signal Line, helping to identify trend strength and direction.
Key Features:
Strong Buy/Sell Signals: Uses crossovers of the MACD Line and Signal Line to generate strong buy/sell signals.
Color-Coded Background: Provides visual cues with background colors to highlight strong signals.
User-Friendly Interface: Customizable settings for MACD Fast Length, Slow Length, and Signal Smoothing.

External Indicator Analysis Overlay | Buy/Sell | HTF Heikin-AshiThis chart overlay offers multiple candlestick display options. The Regular (Japanese) and the Heikin-Ashi candles are well known. The Mari-Ashi (or Renko) option is something special as it should be timeframe independent, so that sideways action should be represented in one candle. That is difficult to realize as an overlay on the normal candlestick structure, but perhaps the chosen implementation is useful nonetheless. The Velocity option is experimental and is designed to show if the price has accelerated too much in a trend direction. In this case, the highs and lows do not reflect the actual highs and lows, but indicate the overshooting velocity. The opening of the candle also depends on the inherent velocity, but the close of the candle is always the actual close. Anyway, it doesn't look very useful, but the option is there.
All options can be applied to higher timeframes. A usable setting is obtained by disabling only the body of the TradingView candles in regular mode and enabling this overlay.
A large part of this overlay consists of buy/sell indication settings. For activation it is necessary to select an external source. For example the “Relative Bi-Directional Volatility Range”, specifically the Trend Shift Signal (TSS). This signal switches from 0 to 1, if the trend becomes bullish or from 0 to -1, if the trend becomes bearish. It will be automatically detected without specifying the Indication Type. Alternatively, the Volatility Moving Average (VMA) would meet the requirements for the Indication Type “Buy = positive | Sell = negative”. The Moving Average Convergence Divergence (MACD) also fulfills these conditions. Another example is to use any Moving Average with the Indication Type “Buy = rising | Sell = falling”. In the chart above the Hull Moving Average (HMA) is used. In addition, it is possible to reverse the signal, so that positive signals become negative and vice versa. The signals will be labeled as Buy or Sell on the chart.
The user can analyze whether the provided signals are good or bad indications for going long or short or simply for rebalancing a portfolio. Therefore, it is possible to set a starting point for the analysis and choose a weighting for the investments from 0% to 100% of the portfolio. To avoid sleepless nights, a very reliable (and conservative) setting seems to be Rebalancing with 50% (very similar to the well-known 60/40 portfolio). The calculation results are shown in a table.
As a small addition there is the possibility to label the peaks by setting the distance between the highs/lows. This will make the quality of the buy and sell signals even more clear.

Faytterro Estimator StrategyWhat is "Faytterro Estimator Strategy"?
"Faytterro Estimator Strategy" is strategy of faytterro estimator. if you want to know more about faytterro estimator:
What it does?
It trades according to the signals given by faytterro estimator and some additional restrictions.
How it does it?
Using the faytterro estimator and the following variables, it gives buy and sell signals in different sizes at ideal points.
How to use it?
The "source" part is used to change the source of faytterro estimator.
The "length" is the length of the fayterro estimator.
"Minimum entry-close gap" is the minimum distance between two transactions opened in opposite directions. For example, if you opened long at 20 500 and "Minimum entry-close gap" is 400, you will not receive a sell signal before the price goes above 20900.
If "minimum entry-entry gap" is the minimum difference between two transactions opened in the same direction. For example, if you open long at 20500 level and the "minimum entry-entry gap" is 400, you will not receive a "buy" signal before the price goes below the 20100 level.
"strong entry size" determines the size of strong signals. The size of ordinary signals is always 1.
note: default values for btc/usdt 1 hour timeframe.

TriexDev - SuperBuySellTrend (PLUS+)Minimal but powerful.
Have been using this for myself, so thought it would be nice to share publicly. Of course no script is correct 100% of the time, but this is one of if not the best in my basic tools. (This is the expanded/PLUS version)
Github Link for latest/most detailed + tidier documentation
Base Indicator - Script Link
TriexDev - SuperBuySellTrend (SBST+) TradingView Trend Indicator
---
SBST Plus+
Using the "plus" version is optional, if you only want the buy/sell signals - use the "base" version.
## What are vector candles?
Vector Candles (inspired to add from TradersReality/MT4) are candles that are colour coded to indicate higher volumes, and likely flip points / direction changes, or confirmations.
These are based off of PVSRA (Price, Volume, Support, Resistance Analysis).
You can also override the currency that this runs off of, including multiple ones - however adding more may slow things down.
PVSRA - From MT4 source:
Situation "Climax"
Bars with volume >= 200% of the average volume of the 10 previous chart TFs, and bars
where the product of candle spread x candle volume is >= the highest for the 10 previous
chart time TFs.
Default Colours: Bull bars are green and bear bars are red.
Situation "Volume Rising Above Average"
Bars with volume >= 150% of the average volume of the 10 previous chart TFs.
Default Colours: Bull bars are blue and bear are blue-violet.
A blue or purple bar can mean the chart has reached a top or bottom.
High volume bars during a movement can indicate a big movement is coming - or a top/bottom if bulls/bears are unable to break that point - or the volume direction has flipped.
This can also just be a healthy short term movement in the opposite direction - but at times sets obvious trend shifts.
## Volume Tracking
You can shift-click any candle to get the volume of that candle (in the pair token/stock), if you click and drag - you will see the volume for that range.
## Bollinger Bands
Bollinger Bands can be enabled in the settings via the toggle.
Bollinger Bands are designed to discover opportunities that give investors a higher probability of properly identifying when an asset is oversold (bottom lines) or overbought (top lines).
>There are three lines that compose Bollinger Bands: A simple moving average (middle band) and an upper and lower band.
>The upper and lower bands are typically 2 standard deviations +/- from a 20-day simple moving average, but they can be modified.
---
Base Indicator
## What is ATR?
The average true range (ATR) is a technical analysis indicator, which measures market volatility by decomposing the entire range of an asset price for that period.
The true range indicator is taken as the greatest of the following:
- current high - the current low;
- the absolute value of the current high - the previous close;
- and the absolute value of the current low - the previous close.
The ATR is then a moving average, generally using 10/14 days, of the true ranges.
## What does this indicator do?
Uses the ATR and multipliers to help you predict price volatility, ranges and trend direction.
> The buy and sell signals are generated when the indicator starts
plotting either on top of the closing price or below the closing price. A buy signal is generated when the ‘Supertrend’ closes above the price and a sell signal is generated when it closes below the closing price.
> It also suggests that the trend is shifting from descending mode to ascending mode. Contrary to this, when a ‘Supertrend’ closes above the price, it generates a sell signal as the colour of the indicator changes into red.
> A ‘Supertrend’ indicator can be used on equities, futures or forex, or even crypto markets and also on daily, weekly and hourly charts as well, but generally, it will be less effective in a sideways-moving market.
Thanks to KivancOzbilgic who made the original SuperTrend Indicator this was based off
---
## Usage Notes
Two indicators will appear, the default ATR multipliers are already set for what I believe to be perfect for this particular (double indicator) strategy.
If you want to break it yourself (I couldn't find anything that tested more accurately myself), you can do so in the settings once you have added the indicator.
Basic rundown:
- A single Buy/Sell indicator in the dim colour; may be setting a direction change, or just healthy movement.
- When the brighter Buy/Sell indicator appears; it often means that a change in direction (uptrend or downtrend) is confirmed.
---
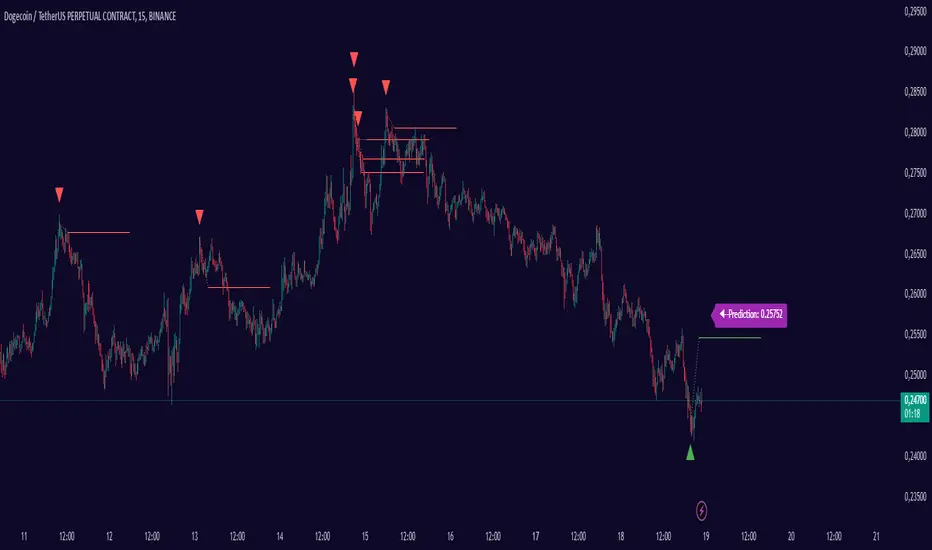
You can see here, there was a (brighter) green indicator which flipped down then up into a (brighter) red sell indicator which set the downtrend. At the end it looks like it may be starting to break the downtrend - as the price is hitting the trend line. (Would watch for whether it holds above or drops below at that point)
Another example, showing how sometimes it can still be correct but take some time to play out - with some arrow indicators.
Typically I would also look at oscillators, RSI and other things to confirm - but here it held above the trend lines nicely, so it appeared to be rather obvious.
It's worth paying attention to the trend lines and where the candles are sitting.
Once you understand/get a feel for the basics of how it works - it can become a very useful tool in your trading arsenal.
Also works for traditional markets & commodities etc in the same way / using the same ATR multipliers, however of course crypto generally has bigger moves.
---
You can use this and other indicators to confirm likeliness of a direction change prior to the brighter/confirmation one appearing - but just going by the 2nd(brighter) indicators, I have found it to be surprisingly accurate.
Tends to work well on virtually all timeframes, but personally prefer to use it on 5min,15min,1hr, 4hr, daily, weekly. Will still work for shorter/other timeframes, but may be more accurate on mid ones.
---
This will likely be updated as I go / find useful additions that don't convolute things. The base indicator may be updated with some limited / toggle-able features in future also.

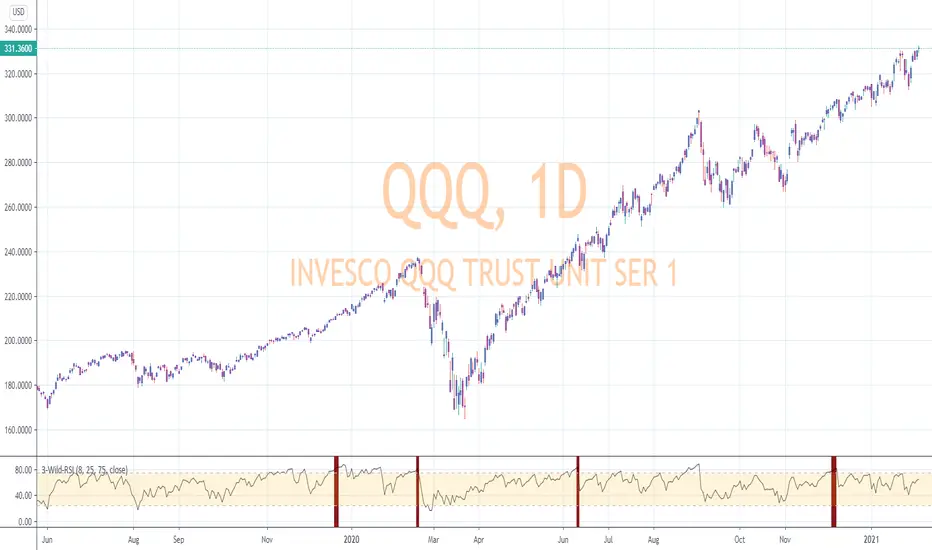
RSI-Last-3-ExtremaThis script indicates when the current Relative Strength Index of the last 8 closes is beyond a level from center oscillation which signals the equity is likely to reverse course. When it is the lowest RSI reading of the prior 3 readings and below 25, a green vertical bar will appear signaling a potential BUY point. Likewise, the highest reading of the prior 3 RSI readings and above 75 will signal a vertical red bar or SELL signal. The bar has to have a final close price for the signal to be active. Reversal could take a few more bars to occur depending on the timeframe and equity symbol.
You will be able to find many charts that have this signal perfectly finding the top or bottom of a significant trend.
It successfully indicates profitable reversal around 80% of the time. So far, It is 85% accurate or better in determining downtrend start points on the Daily, 120, 60, 30 Minute charts according to the study of more than 10,000 occurrences. It is 86% accurate on the 30 Minute chart.
This is another tool I use in finding or confirming potential price action. Hope you find it useful.
To add this, favorite the script by clicking "Add to your Favorite Indicators" at the top of the code portion below. On your top tool bar is an "fx" button with a downward arrow to the right of it. Click on the downward arrow/caret and scroll down to "RSI-Last-3-Extrema". Click on this title and it should add to the bottom of your current chart. If you do not see BUY (green vertical bars) or SELL (red vertical bars) right away, try other charts and timeframes.
Chaikin Money Flow with Volume PercentsShowing the CMF, with green / red fill for positive / negative values, overlaid with Volume Percentage, displaying buying as green and positive, selling as red and negative.

Buy/Sell IndicatorBased on logic from many top contributors here, the script utilizes LazyBear's WaveTrend Oscillator Indicator along with custom code to plot a few key components for daily trading;
Boundaries for entry and exit points which are based on a 6-day trend in OPEN/HIGH and OPEN/LOW prices.
Daily HIGH and LOW points to establish a good view of stock's movements
Entry and exit points with confidence levels. These can be treated as entry points for short to medium term investments
Entry points come in the colours of White and Lime, where white is slightly confident and lime is extremely confident
Exit points come in the colours of Maroon, and Red, where maroon is slightly confident and red is extremely confident
Each Entry and Exit point also comes without text, or with a M or H above it, where M indicates medium confidence on the point and an O indicates overconfidence.
Use Case:
The best possible use case is to enter a trade on a LIME point with O text, this means that is an overconfident entry point.
The trade should be exited on a RED point with O text, this means that is an overconfident exit point.
But you can do with the indicators as you please.
In addition to LazyBear's code, the following existing models and indicators are taken into account:
RSI of closing price over a period of 25
EMA of RSI
