BTC Cycle Halving Thirds NicoThe bold black vertical lines are the INDEX:BTCUSD halvings.
The background speak for itself.
Time to be bearish?
Btcusdshort

3GBH - RSI + HMAs Included in this indicator:
- RSI
- 2x HMA's w/ Zones of Fast HMA
- BTCUSD RSI + Comparison
- Highlight Saturdays & Sundays
-----
User-friendly.
You can change all the inputs, they are labelled for ease-of-use.
You can toggle On/Off any or all of the options.
-----
I was inspired to create this indicator, which is an exact copy of my very first
except this time we're using HMA's rather than EMA's.
Hull Moving Averages stick to price action a lot closer in my opinion.

BTC Longs & Shorts Profile WHAT DOES THIS INDICATOR DO?
I started with the idea of creating another premium indicator with a bunch of features and add it to the bundle. However, the more complex the code was becoming, the less helpful the indicator actually was. So I started from scratch and made BTC Longs & Shorts Profile super simple (as you can see in the code).
The advantage over other similar indicators is that this one has a drop-down menu and allows you to select whether you want to see Longs, Shorts, Ratio, or Difference. Having Longs and Shorts at the same time is a bit confusing because Longs pretty much dwarf the Shorts and the ups and downs are not clearly visible. Also, you can configure the colors for each visible line.
My suggestion is to add this indicator to your BTC chart, save it as a template from the top menu on TradingView and stop switching between BTC, Bitfinex Longs and Shorts. You have everything in one simple window (that's especially the case if you are not a pro or premium member and can't have more than 2 screens simultaneously).
ANYTHING ELSE ?
On a side note, if you are planning on working on a similar indicator, let me tell you what I've tried so far and it didn't work for me:
- RSI calculations including Longs and Shorts as a base
- Longs and Shorts in relation to BTC itself and a relationship with the volume
- Directional Movement Index, where Longs are DM+ and Shorts are DM-
- Smoothing both Longs and Shorts and trying to find a relationship (including some pseudo MACD lookalikes)
Anyway, if you have any ideas or suggestions on improving this indicator, please let me know. Thanks!

Bitfinex BTC Open InterestBitfinex open interest, or bitcoin open interest chart, shows the amount of open positions currently on Bitfinex BTC / USD trading pairs. Usually when open interest reaches unusually high numbers we'll see an increased volatility in Bitcoin's price. The open interest chart could also be useful for determining the tops and bottoms for Bitcoin.

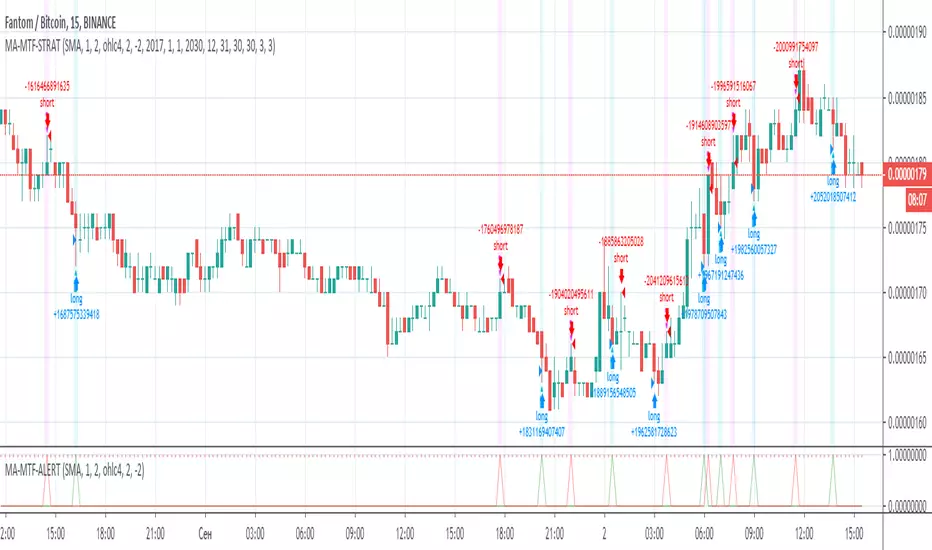
MA-MTF-ALERT// Alerts based on SMA strategy
// Time frame 5M, 10M, 15M
// Created and based on Binance chart
// Working with comission
// No repaints


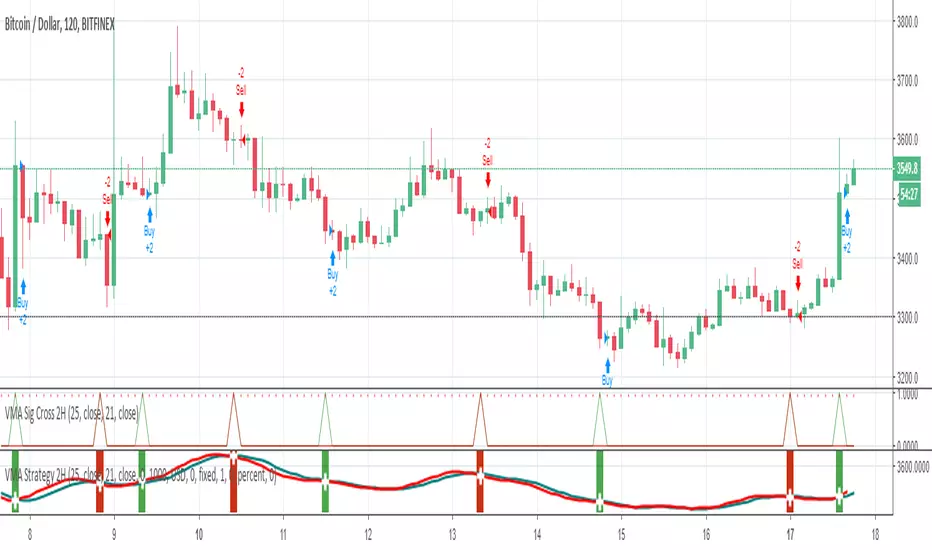
VMA Sig Cross 2H // Strategy based on Variable Moving Average. VMA automatically adjusts its smoothing constant on the basis of Market Volatility.
// Greatest profit index on 2H time frame
// Created and based on Binance chart
// Working with comission
// No repaint
EMA SMA ALERTS V1 2H// Strategy based on Simple Moving Average (SMA) and Exponential Moving Average (EMA)
// Greatest profit index on 2H time frame
// Created and based on Binance chart
// Working with comission
// No repaint
// Alerts +

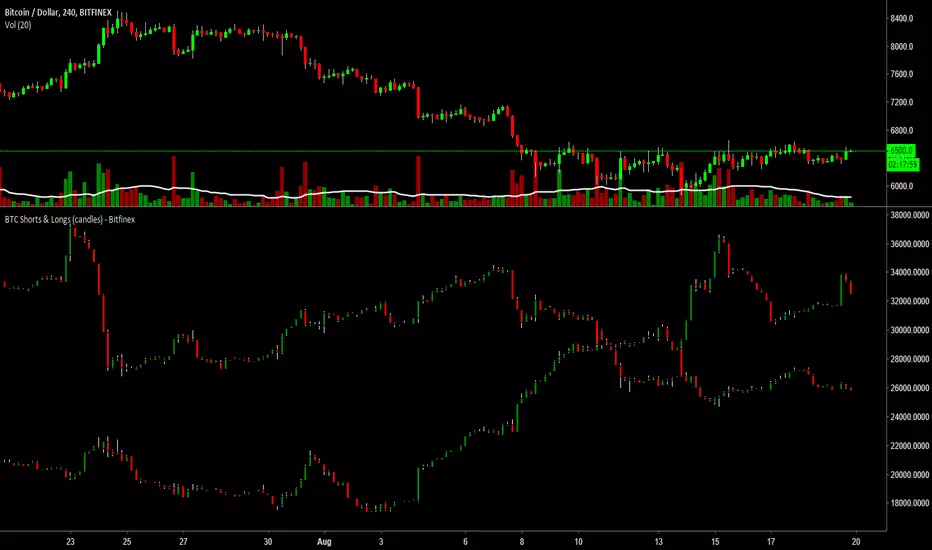
BTC Shorts & Longs (candles) - BitfinexBTCUSDLONGS and BTCUSDSHORTS indicator people like to use but I combined them into one chart/indicator to make them easier to see how the longs or shorts may be building.
Please give it a like if you use or enjoy the indicator.
Closing Leverage and Rate of ChangeShows BTCUSDLONGS vs BTCUSDSHORTS along with their rate of change on a scale that's friendly for a combined indicator. ROC is increased proportionally so you can see it in relationship to Open Shorts and Open Longs on the same graph without zooming. I had been using an offset as well, but using an offset to adjust position causes the highs to look lower and it makes the lows look less low. It was significant enough to seem like a bad idea to include.

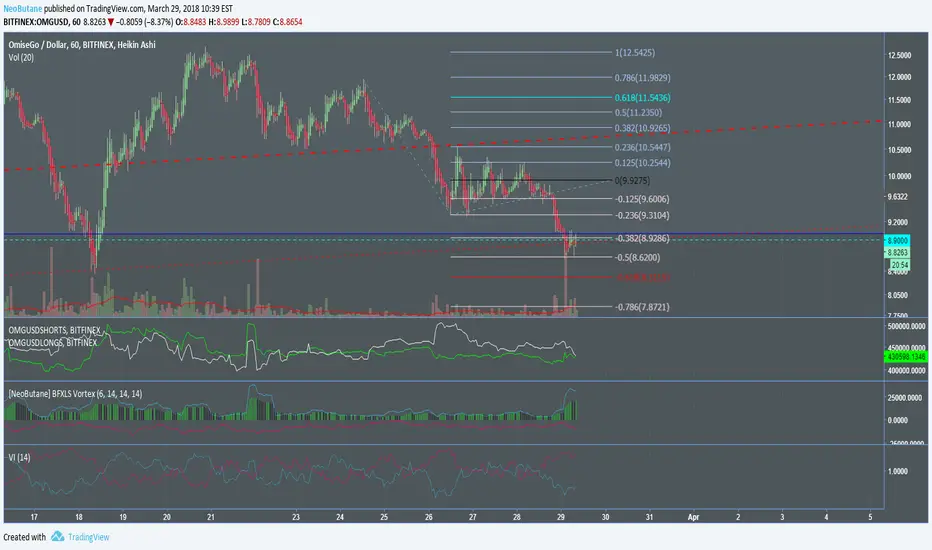
NeoButane Bitfinex BFXLS Vortex IndicatorScripted longs and shorts to the vortex indicator. It doesn't work like Vortex due to the two plots never crossing to congest.
Blue line: longs
Red line: shorts
Histogram: net volume, ohlc4 of both. Green if previous candle close had lower net volume, black if the previous candle close had more.
Deviance from the histogram: increased volume for the long or short side
Optional ADX line with customizable lookback; it can be difficult to understand due to it being completely horizontal unless you turn off the other plots.
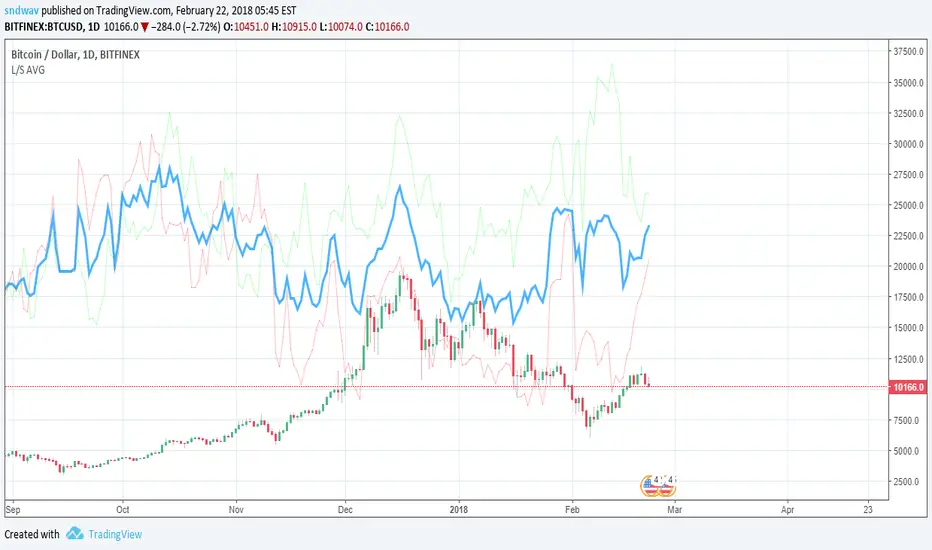
BTCUSD Long/Short Average (By Shimozen)This indicator takes Bitfinex's SHORTS and LONGS charts, and overlays the Average of the 2 on top of the current chart.
This script was created in order to check possible correlations between the Shorts/Longs average and the current BTCUSD price.
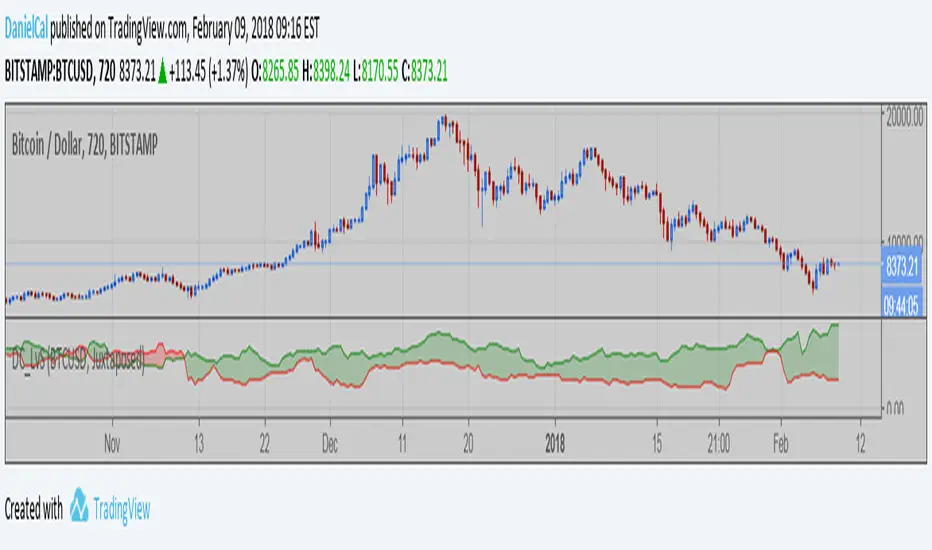
Margin Longs vs Shorts for BTC ETH & all Bitfinex pairs
Two modes of use...
a) The script detect chart symbol and show corresponding Bitfinex Longs & Shorts (if data exist).
b) You select BTCUSD or ETHUSD Bitfinex Longs & Shorts to show on any chart.
Two comparison views...
a) Juxtaposed: longs and shorts in same direction, side by side. (My preferred view)
b) Counterposed: longs and shorts in opposite polarity, separated by zero line. Another line is plotted representing the difference.