BTCUSD
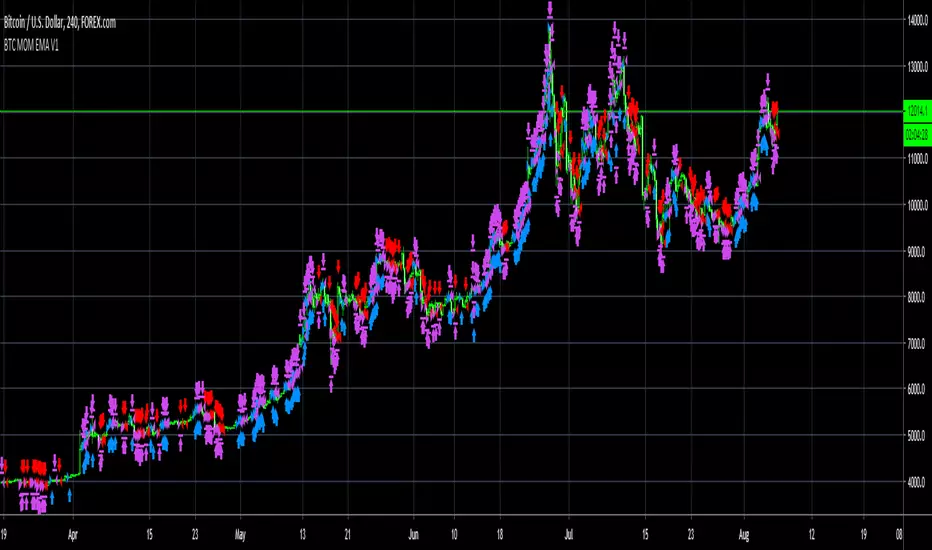
The K2 v2.0 StrategyThe updated version of THE K2 is finally here! A lot of changes were made when creating the second version of the K2, but the result was a much higher level of performance.
The new K2 consists of a 1 minute 'fast' CCI and 15 minute slow CCI. We identified key thresholds for each one to construct a more complex trading approach. The green shapes on the chart represent buy signals and the red shapes are sell signals. The text above them is the percentage of equity used in each trade. These percentages are based on the CCI's position relative to the fixed thresholds. By doing this, the strategy achieves a higher frequency of trades and lower max drawdown.
Here's a guide to help understand the various shapes:
Circles: Slow CCI trades using 50% equity.
Squares: 25%
Triangles: 15%
Crosses(X's): 10%
We will update the user guide on our website(ProfitProgrammers.com) to include an in-depth guide to using the new K2.
The results displayed on the chart are the results for the month of April. As always, the K2 strategy comes with its study equivalent(at no extra cost).
If you're interested in the K2, message us for a free 3 day trial!
All of our invite only studies and strategies can be found on our website ProfitProgrammers.com

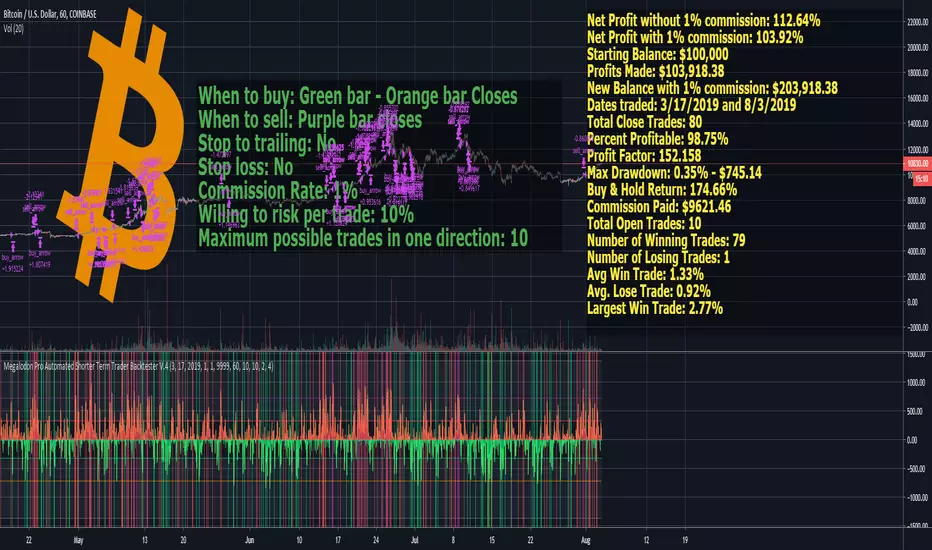
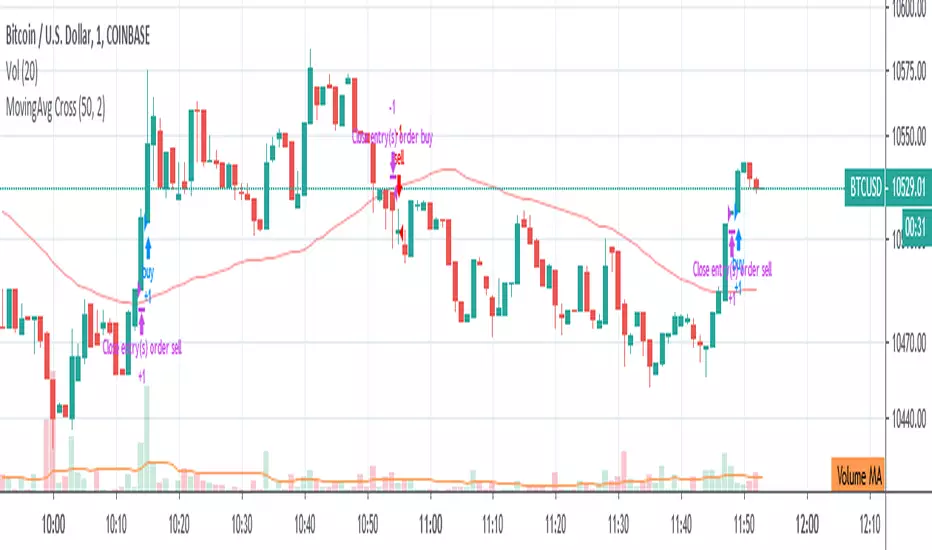
Megalodon Pro Automated Shorter Term Trader BacktesterSTRATEGY
When to buy: Green bar - Orange bar Closes
When to sell: Purple bar closes
Stop to trailing: No
Stop loss: No
Commission Rate: 1%
Willing to risk per trade: 10%
Maximum possible trades in one direction: 10
RESULTS
Net Profit without 1% commission: 112.64%
Net Profit with 1% commission: 103.92%
Starting Balance: $100,000
Profits Made: $103,918.38
New Balance with 1% commission: $203,918.38
Dates traded: 3/17/2019 and 8/3/2019
Total Close Trades: 80
Percent Profitable: 98.75%
Profit Factor: 152.158
Max Drawdown: 0.35% - $745.14
Buy & Hold Return: 174.66%
Commission Paid: $9621.46
Total Open Trades: 10
Number of Winning Trades: 79
Number of Losing Trades: 1
Avg Win Trade: 1.33%
Avg. Lose Trade: 0.92%
Largest Win Trade: 2.77%
Let me know what you guys think about the results?
Due to the tradingview's limitations on providing the shorter time frame price data, we had to provide a 60 minute time frame backtesting results.
The shorter time frames including 1 minute and 15 minutes backtesting results are way more accurate and precise than 60 minutes time frame results.
Megalodon Trading
Enlightening the Modern Investors
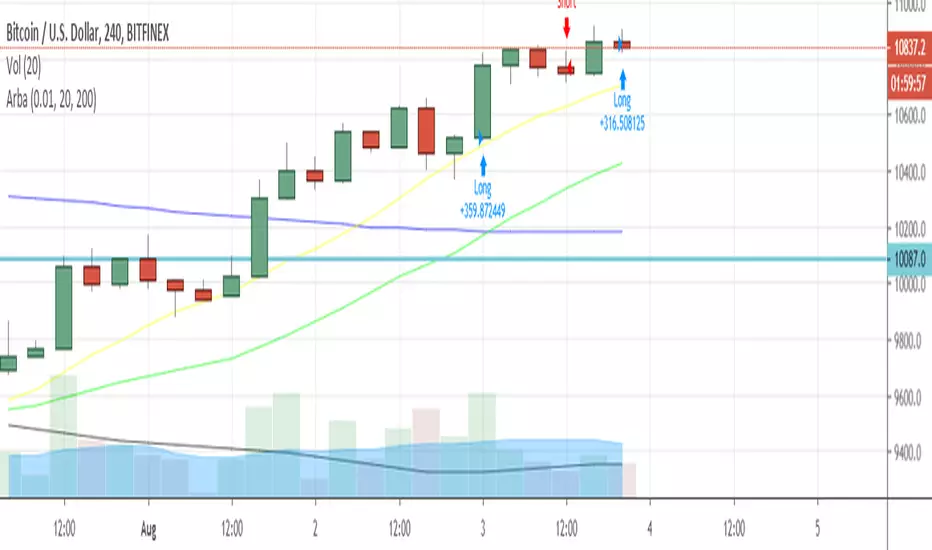
ArbaArba is a trading strategy automation to use in ranges of 4H and D and it may be configured by setting up the ranges of slow simple moving average and fast simple moving average.
The strategy filters in a number of possibilities for possible entries and exits for this specific pair.
You can use it connected to your Poloniex API keys to make automated trading in the above-mentioned timeframes.
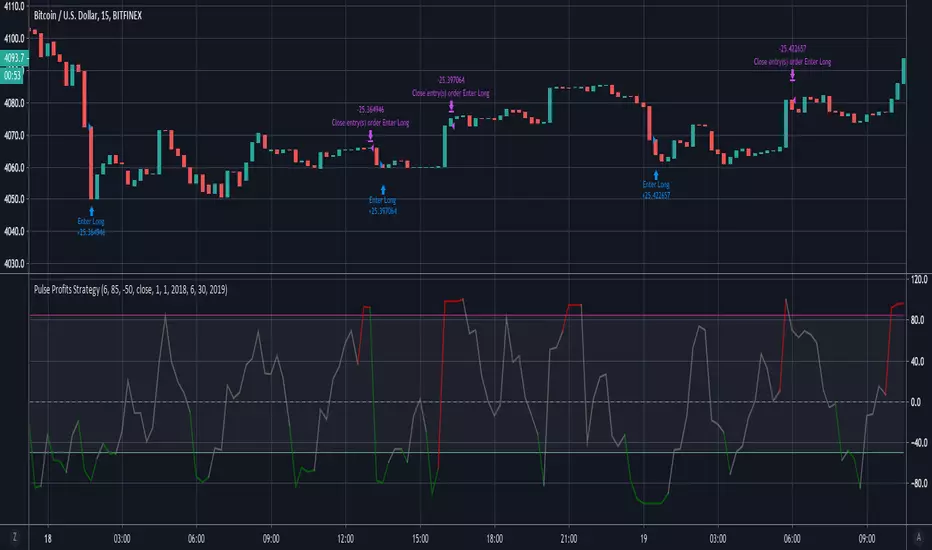
Pulse Profits Strategy v2.0This is the strategy version that is included with the Pulse Profits+ study. This strategy is based on the Chande Momentum Oscillator and Elder's Force Index(EFI).
The strategy includes options to add a stop loss and adjust all input options based on specific usage.

Profit Runner Strategy v2.0This is the strategy version of the recently posted Profit Runner v2.0 study. We include both together so that users can use the strategy for backtesting and figuring out the optimal settings for their specific usage and then implement those settings in the study version(which includes alerts for automated trading).
Green background highlights are buy signals and red background highlights are sell signals. Red and green filled area show the user's stop loss .

RSI - Oversold BTC StrategyWhen BTC goes through a large swing downward, it often goes into oversold territory and quickly swings back upwards. This strategy is designed to capitalize on the swings without gettings stopped-out with the surrounding volatility. I find that this strategy works best on the 5 minute chart.
You can set the maximum loss (in dollars), trade size (in BTC ), plus your trailing stop and offset (pips).
The blue line on the graph indicates your stop loss point, which trails your buy-in point by your specified maximum loss. Remember, in this strategy, this stop-loss is only used to protect you from unexpected large swings, your trailing stop loss is used to capture profits.


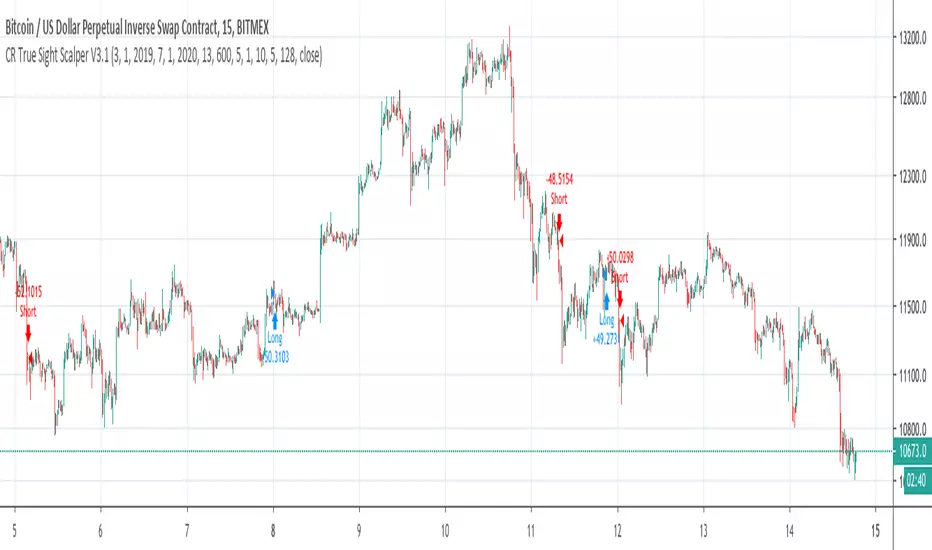
CR True Sight Scalper V3.1True Sight Scalper V3.1 is an incompatible update to V3.0, with much smaller losses.
$100,000 Initial capital.
From 2019-04-04 to 2019-07-14
Cyatophilum Scalping Bot V2 [ADVANCED SETTINGS] [BACKTEST]Advanced Settings version of Cyatophilum Scalping Bot V2
For people who like tweaking settings =)

Abacus (CMF + Stoch. + Chop.) StrategyThis strategy combines uses Chaikin Money Flow, Stochastic Oscillator, and the Choppiness Index to determine trend strength and direction and generate entry and exit signals. This is a strategy adaptation of our earlier CMF + Stoch + Choppiness Index indicator.

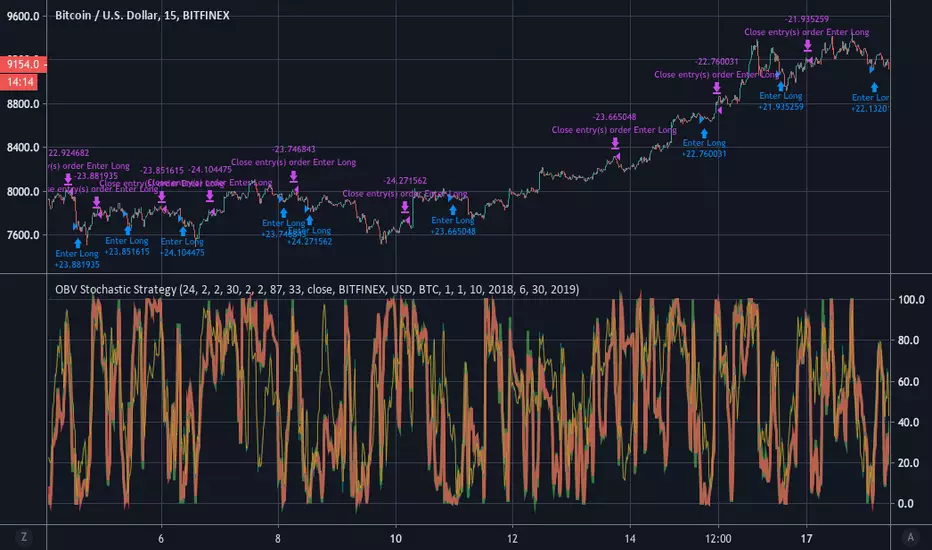
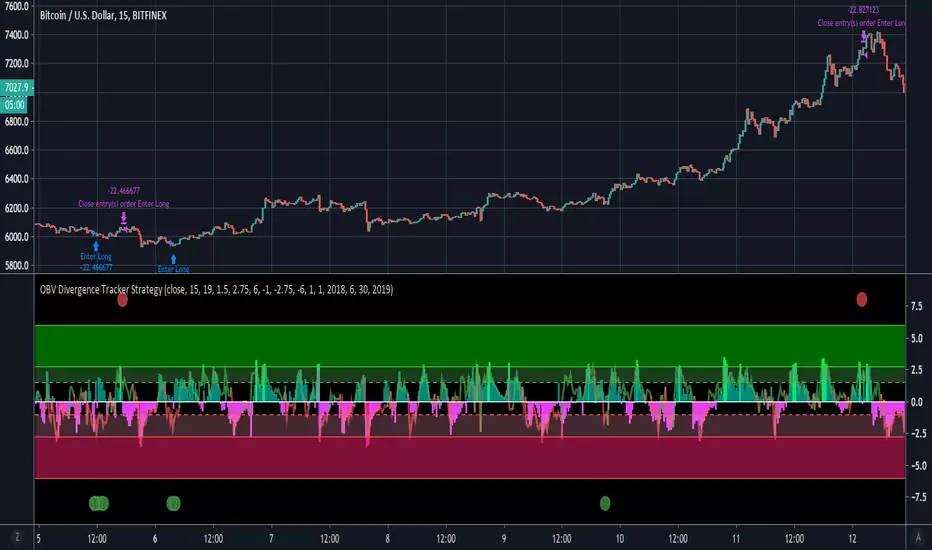
OBV Divergence Tracker StrategyThis strategy combines OBV Z Scores and price Z Scores to identify divergences and generate entry and exit signals.
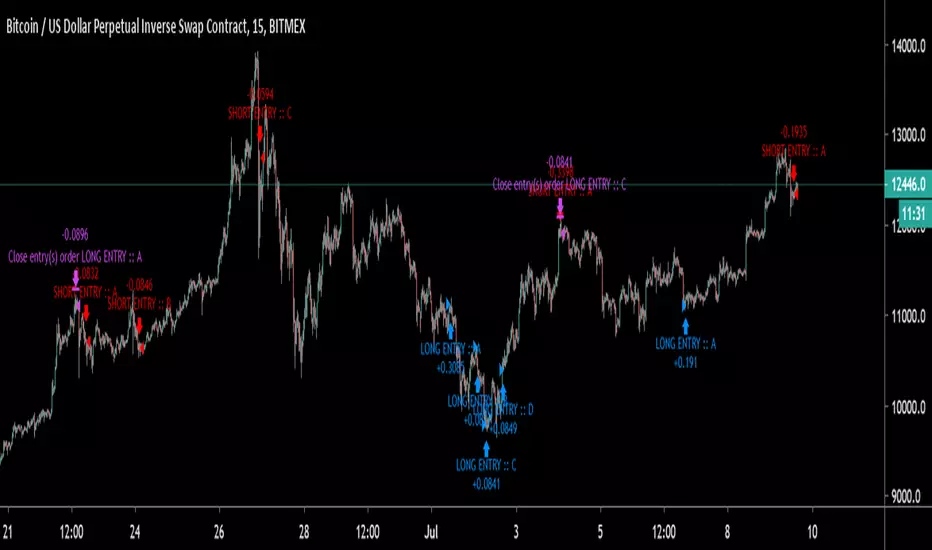
The K2 StrategyStrategy version of the K2 Indicator. The K2 uses a fast and slow CCI to identify optimal long entry and exit opportunities.

Pulse Profits+ StrategyStrategy Version of the Pulse Profits+ Indicator based on Elder's Force Index and Chande Momentum Oscillator.