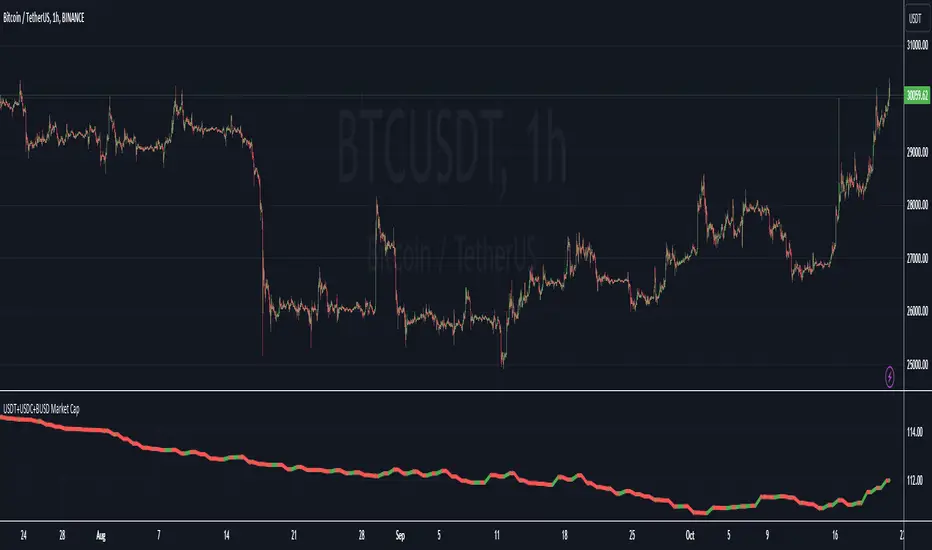
USDT+USDC+BUSD Market CapThis Pine Script indicator visualizes the combined market capitalization of three prominent stablecoins: USDT, USDC, and BUSD, on a daily basis.
It fetches the daily closing market caps of these stablecoins and sums them. The resulting line graph is displayed in its own separate pane below the main price chart.
The line is color-coded: green on days when the market cap is increasing compared to the previous day, and red when it's decreasing.
Btc-usdt
Fierytrading: Volatility DepthDear Tradingview community,
I'd like to share one of my staple indicators with you. The volatility depth indicator calculates the volatility over a 7-day period and plots it on your chart.
This indicator only works for the DAILY chart on BTC/USD.
Colors
I've color coded the indicator as follows:
- Red: Extreme Volatility
- Orange: High Volatility
- Yellow: Normal Volatility
- Green: Low Volatility
Red: extreme changes in price. Often during local tops and bottoms.
Orange: higher than average moves in price. Often before or after a "red" period. Often seen in the middle of bear or bull markets.
Yellow: normal price action. Often seen during early stage bull-markets and late stage bear-markets.
Green: very low price movement. Often during times of indecision. Once this indicator becomes green, you can expect a big move in either direction. Low volatility is always followed by high volatility.
In a long-term uptrend, a green period often signals a bullish break out. In a long-term downtrend it often signals a bearish break out.
How to use
Save the indicator and apply it to your chart. You can change the length in the settings, but it's optimized for 7 days, so no need to change it.
I've build in alerts for all 4 different volatility periods. In most cases, the low volatility alert is enough.
Good luck!

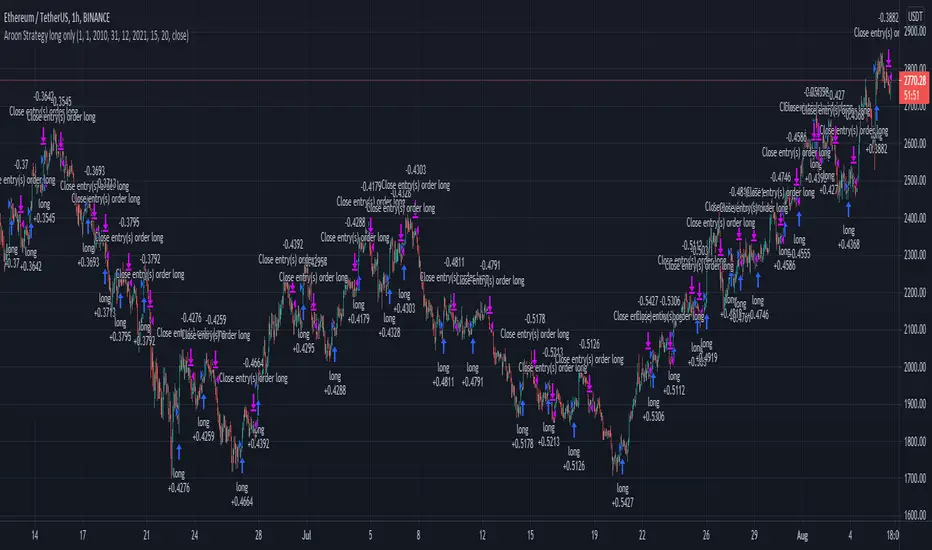
Aroon Strategy long onlyThis is a simple long only strategy made of Aroon and Least Square moving average.
The rules are simple:
Long entry = crossover of upper part with the lower part from aroon and close of the candle is above the moving average
Long exit = crossunder of upper part with the lower part from aroon and close of the candle is below the moving average
IF you have any questions let me know !
BTC Spot vs Tether Volumespot_volume / tether_volume
spot = Coinbase + bitFlyer + Kraken + Bitstamp
tether = Bitfinex + binance + Huobi + HitBTC
