Brandon BollSecond day at Pinescript and I am attempting to tweak the Bollinger Bands directed strategy to send alerts to Zignaly in order to automate long buy/sells.
I've left in the short script though for completeness.
The buy and sell instructions work perfectly but I don't know how to do a cancel order alert (as included in the original strategy)
Btc!

Bitcoin Prices InfoPanelHello traders
This script is based on the great Ricardo Santos InfoPanel script
It will display all the Bitcoin prices
The script is public so you can adjust according to your own needs
PS
You might have to scroll right on your chart to see the panel
Enjoy :)
Dave

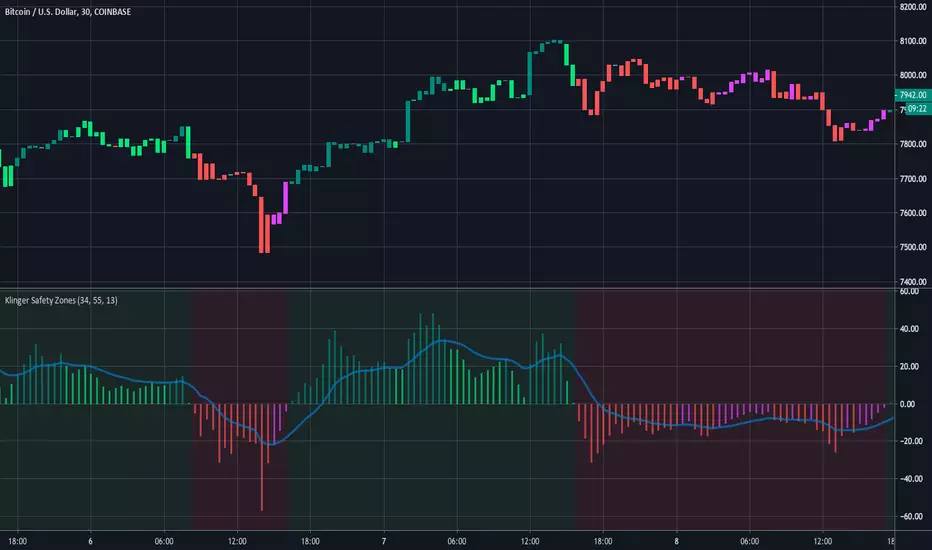
Klinger Safety ZonesThis indicator is based on the Klinger Volume Oscillator, or KVO. The KVO is pretty cool since it can track long-term changes in money flow (both into and out of a market), as well as respond and predict short term price fluctuations.
The Klinger Oscillator determines the direction (or trend) of money flow based on the high, low, and closing price of the security. It then compares all three values (HLC/3) to the previous period’s values to determine how volume should be factored into the KVO. If the current period’s price is greater than that of the previous period, then volume is added. It is subtracted, however, if the price is less than the previous period. This utilization of volume is what makes it an accurate tracker of money flow and a valuable confirmation indicator. This value is often called volume force or the “trend” line.
A fast and slow EMA of the volume force are then calculated. The fast EMA has a smaller window length, while the slow EMA has a larger window. Traders can adjust the lengths of each EMA in the input option menu, but we chose the standard 55 and 34 period lengths as the default settings. We are finally left with the actual KVO value after subtracting the slow EMA from the fast EMA.
The Klinger Oscillator uses a signal line similar to the MACD and many other indicators. The default length for it is 13, but that length can also be adjusted in the input menu. A shorter length will result in more responsiveness but possibly more false signals and whipsaws.
The Chart and Interpretation:
The histogram shows the KVO series. Remember, since the Oscillator represents the difference between the fast and slow EMA, the KVO is bullish when it is greater than zero and bearish when it is less than zero.
When the KVO is greater than zero, the background on the chart is green, meaning that the trend is bullish and traders should look to go long. On the flip side, the background is red when the KVO is less than zero meaning traders should look to go short.
The aqua line plotted on top of the histogram is the signal line.
Here is a quick summary of the histogram colors:
(if KVO > 0 and KVO > signal)
then (color = teal)
if (KVO > 0 and KVO < signal)
then (color = lime)
if (KVO < 0 and KVO < signal)
then (color = red)
if (KVO < 0 and KVO > signal)
then (color = pink)
Users can choose to have the candles change color to match the KVO histogram color by adjusting the setting in the input menu.
~Happy (and safe) trading~
indicator StrategyBITMEX5 FOR LONG BUY2This indicator was developed for trading using RCI .
It performs well in day trading and swing trading.
* Signal conditions for long entry *
It is displayed when the short-term RCI crossovers the lowerband.
* Take profit condition *
It is displayed when the short-term RCI crossunders the lowerband.
* Optimized the entry conditions using CM_Williams_Vix_Fix created by ChrisMoody.
************************
Hello everyone!
I am very pleased with your evaluation.
This script is a masterpiece of the current stage of successful development of a technical analysis of cryptocurrencies over two years.
This has been published for cryptocurrency fans like you, but it may be closed in the near future.
If you like this indicator, please support money for my activities.
We would like to use that money as an activity cost for further indicator updates and better strategy development.
This development work is very hard and requires careful attention, but I am passionate about making them successful.
The amount of money does not matter.
The value you felt was that amount.
BTC
39LbiVReUjxX7k2gqWxQeDAVJtYfTCREzB
LTC
MVAJG4ubzugi2jxZ6P6wqXJXA3RqzmNqYK
ETH
0x7c5715b87a268993c4d78086016015b39985c835
USDC
0x7c5715b87a268993c4d78086016015b39985c835
Thank you.

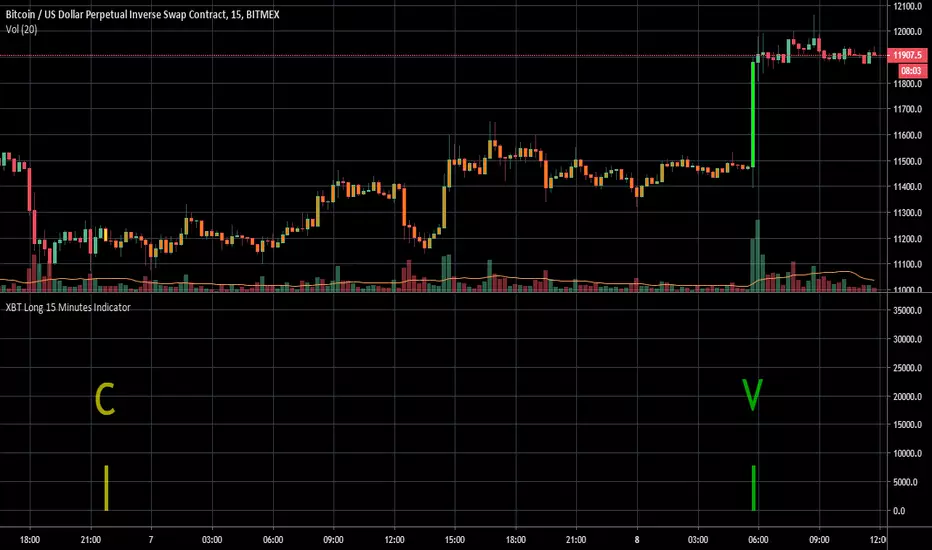
XBT Long 15 Minutes IndicatorXBT Long 15 Minutes Indicator shows Buy and Sell signals on XBT / Bitmex.
Open Long position with "C" and close it with "V".
It was designed to use it in 15 Minutes Scale.
Stop Loss: 3.3%.
Stop Gain: 4.3%.
Statistics from 5/1/19 untill 7/8/19.
23 Win Trades.
8 Loss Trades.
Effectiveness: 74.2%.
Profit: 66.3%.
I use it with 10X leverage.
PROFIT FACTOR: 3.75.
I am using it from 6/1/19.
You are responsible for the use.
I can not assure the future success.
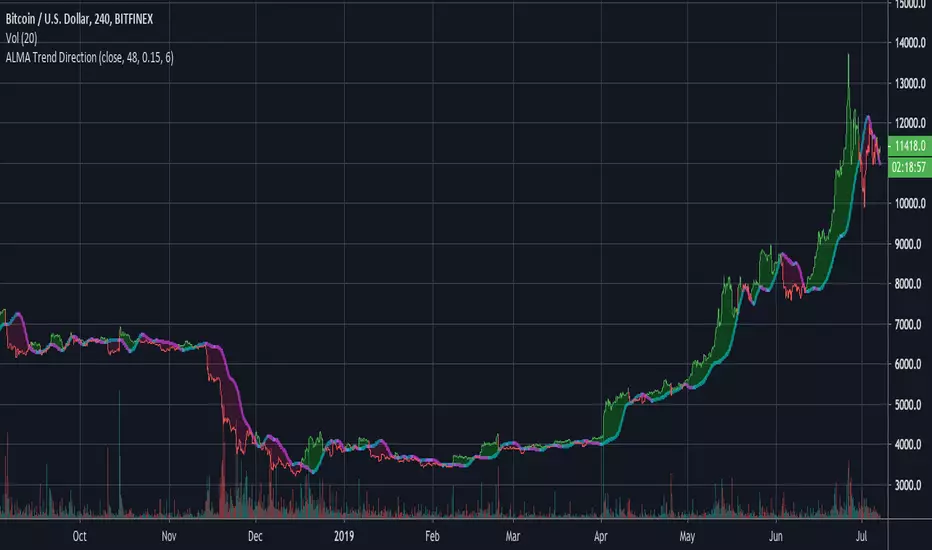
ALMA Trend DirectionHere is a very simple tool that uses the Arnaud Legoux Moving Average(ALMA). The ALMA is based on a normal distribution and is a reliable moving average due to its ability to reduce lag while still keeping a high degree of smoothness.
Input Options:
-Offset : Value in range {0,1} that adjusts the curve of the Gaussian Distribution. A higher value will result in higher responsiveness but lower smoothness. A lower value will mean higher smoothness but less responsiveness.
-Length : The lookback window for the ALMA calculation.
-Sigma : Defines the sharpe of the curve coefficients.
I find that this indicator is best used with a longer length and a 4 Hour timeframe. Overall, its purpose is to help identify the direction of a trend and determine whether a security is in an uptrend or a downtrend. For this purpose, it is best to use a lower offset value since we are looking to identify long-term, significant price movement rather than small fluctuations.
The Chart:
The ALMA is plotted as the aqua and pink alternating line. It is aqua when bullish and pink when bearish.
The low price for each candle is then compared to the ALMA. If the low is greater than the ALMA, then there is a bullish trend and the area between the candles and ALMA is filled green. The area between the ALMA and candles is filled red when the low price is less than the ALMA.
The difference between the slow ALMA and candles can reveal a lot about the current market state. If there is a significant green gap between the two, then we know that there is a significant uptrend taking place. On the other hand, a large red gap would indicate a significant downtrend. Similarly, if the gap between the two is narrowing and the ALMA line switches from aqua to pink, then we know that a reversal could be coming shortly.
~Happy Trading~
AutoFib
The AutoFib Pro is a useful tool that automatically calculates and plots Fibonacci Retracement levels. Each period, the AutoFib evaluates the price history over a user-specified number of bars. It then finds the extreme high and extreme low points for that window and then uses those values to establish 5 levels based on Fibonacci’s golden ratio.
This provides a simple visual representation of support and resistance levels. The tool’s automated nature means that the levels are dynamically adjusted to account for new extreme highs and lows, as well as irregular movements.
When the bands are located closely together, the security is experiencing high volatility. A large gap between the top and bottom levels signify a price outbreak. When the price crosses the middle 50% level, it is likely (but not guaranteed) to continue in that direction.

The WaveRunner Multiple Moving AveragesThe WaveRunner consists of a Triple Exponential Moving Average (or TEMA). This study first calculates the exponential moving average(EMA) of the security. It then finds the EMA of that first EMA and then finally calculates a third EMA based on the second EMA. Then, we added in a volume weighted moving average, allowing us to place greater emphasis on periods with higher volume.
Due to its minimal lag, the triple exponential moving average is a good tool for trend identification and volatility measurement. Adding in a VWMA further improves its accuracy as it provides another way to check the strength of a trend.
The first EMA is shown as the green line of circles. The EMA of that line is then plotted as the middle yellow line. Finally, the third EMA is the red line of circles. When the first EMA is greater than the third, it indicates a sustained positive trend and the area between the two lines is filled green. On the other hand, when the third EMA is greater than the first EMA, it indicates a negative trend and the area between the two lines is filled red. Finally, the VWMA is shown as the darker green and red areas both below and above the first EMA.
This indicator is best used for trend identification and confirmation, filtering out volatility. Reduced lag allows traders to interpret sharp price fluctuations.

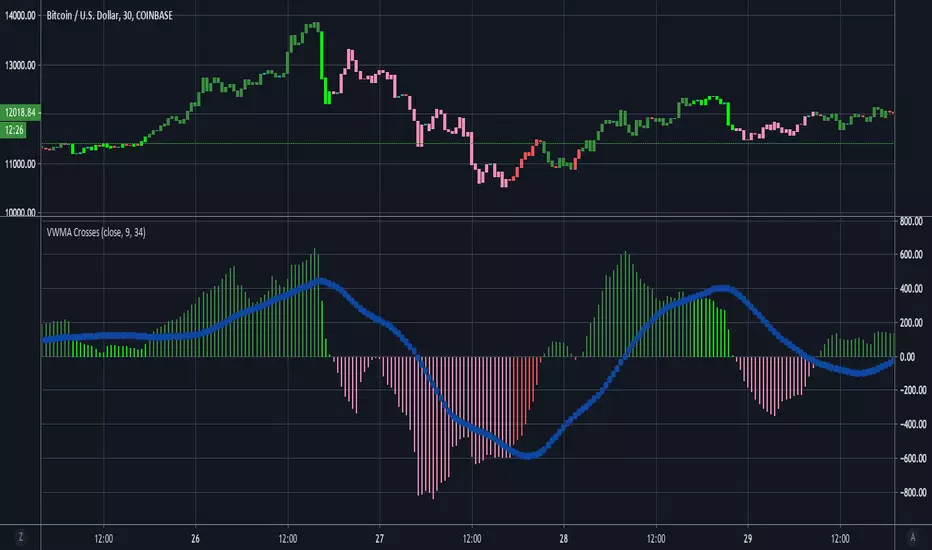
VWMA CrossesThis is a simple tool that gives traders a simple visual representation of Volume-Weighted Moving Average ( VWMA ) crossovers that is pretty similar to the MACD . We don't typically trade solely based on the VWMA , but it is definitely one of our go-to tools when combining multiple indicators.
When trading with VWMA's, it is common to enter a position when the fast VWMA crosses over the slow VWMA . In other words, the fast VWMA was previously less than the slow VWMA and is now greater in value than the slow VWMA . Conversely, traders often exit their positions when the fast VWMA crosses under the slow VWMA .
This tool plots the absolute value of the difference between the fast and slow VWMA's as a histogram. When the difference between the fast and slow VWMA's is greater than zero (meaning fast > slow), then the bars are green. The bars then turn red when the fast VWMA is less than the slow VWMA . The blue circle-line is a Simple Moving Average of the difference between the two lines.
Here's a quick guide to interpreting the chart:
if (fast VWMA > slow VWMA ) and (difference < sma of differences)
then color = lime green
if (fast VWMA > slow VWMA ) and (difference > sma of differences)
then color = dark green
if (fast VWMA < slow VWMA ) and (difference < sma of differences)
then color = light red
if (fast VWMA < slow VWMA ) and (difference > sma of differences)
then color = dark red
~Happy Trading~
indicator:StrategyBITMEX5 FOR LONG BUY1This indicator shows the entry signal and timing of profit determination under specific conditions.
This indicator shows high performance in 3 hours of XBTUSD of BITMEX.
/ / / / / / / / / / / / / / / / / / / / / / / / / / / / / / / / / / / / / / /
* longCondition 1
// Zero Lag MACD
crossover (ZeroLagMACD, signal)
(Display Alert signal when Zero Lag MACD makes a golden cross.)
* CloseCondition1
crossunder (ZeroLagMACD, signal)
/ / / / / / / / / / / / / / / / / / / / / / / / / / / / / / / / / / / / / / /
* longCondition 2
// SAR
longentry4 = From SARdown to SARUP and uptrend of moving average line
(A signal is issued when the parabolic SAR shows an uptrend.)
* CloseCondition 2
closelong4 = From SARUP to SARdown
/ / / / / / / / / / / / / / / / / / / / / / / / / / / / / / / / / / / / / / /
In general, if only MACD and signal cross timing or SAR signal conversion is used as the entry timing, our account balance will be increasingly reduced.
So I added some filters to longCondition1 and longCondition2.
Of course this logic is no repaint.
It does not employ multi-time frames.
/ / / / / / / / / / / / / / / / / / / / / / / / / / / / / / / / / / / / / / /
Entry filter
* Filter 1
When fighting against resistance lines with closing or high prices.
* Filter 2
MACD Divergence
* Filter 3
When market volatility is low.
//////////
version up
2019/07/04 - Responding to falling long entries

Vortex Trend TrackerThough it may sound complex, the Vortex Indicator is essentially an uptrend line and a downtrend line. The vortex indicator can be used for a variety of purposes, including tracking the strength of trends, identifying/anticipating reversals, and generating entry/exit signals. It’s calculation is shown in the open-source code below.
To reduce the number of whipsaws produced by the indicator, we used an Exponential Moving Average of vmPlus and vmNegative values with a default length of 10. Decreasing this length will result in a more responsive vortex at the cost of more whipsaws and false signals.
The chart shows the absolute value of the difference between the uptrend and downtrend line displayed as the main histogram.
If the uptrend line is greater than the downtrend (thus indicating positive movement), then the histogram bars will be either light green or dark green. If the uptrend line has just now crossed the downtrend line, then the bar will be dark green. Bars will also be dark green when the uptrend line is greater than the downtrend line and the uptrend line is increasing. This means the trend is increasing in strength still. If the uptrend line is greater than the downtrend line, but is decreasing, then the bars will be light green. This means that the upwards trend is losing strength.
If the downtrend line is greater than the uptrend line, then there is a negative trend occurring and the bars will be either red or light red. If the downtrend line has just crossed over the uptrend line or is increasing in value, then the bar will be red. If the downtrend line is greater than the uptrend line, but is decreasing in value, then the bars will be light red (meaning the downtrend is weakening).
One way to trade using this vortex is to enter a long position when the bar color changes from red to light red. This would mean that the downtrend is decreasing in strength and an upwards reversal is likely to occur soon. Then, traders can exit their long position when the bars change from dark green to light green. When that color change occurs it means that the uptrend is running out of steam and price is unlikely to continue its upwards climb.
Traders can also choose to have the uptrend and downtrend lines plotted as well in the input menu. This may make it easier to visualize the Vortex and its usefulness in identifying reversals.

Bitmex Dollar Value CalculatorWith this indicator you can easily calculate either the bitcoin value of a certain amount of dollars or the dollar value of your bitcoin (particularly helpful when trading on bitmex)
Tipjar : 38uGQJDDZDL6wX48x4gYTccPeQ3ZHVYmY4 (btc)

Fully Adjustable BTC Longs/ShortsThis indicator shows you Bitfinex Longs&Shorts charts in one handy indicator. It's fully adjustable to your own prefference.
Tipjar : 38uGQJDDZDL6wX48x4gYTccPeQ3ZHVYmY4 (btc)

Megalodon Pro Utility PanelHow to use?
Simply, add the indicator and follow the timing and kill zone signals on the screen.
This indicator is designed for Daily time frame for longer term analysis and 1 minute time frame for shorter term analysis.
Turn on the kill zone feature for overlaying different kill zones.
Turn on Day Trading checklist feature for becoming a better Day Trader using Megalodon indicators.

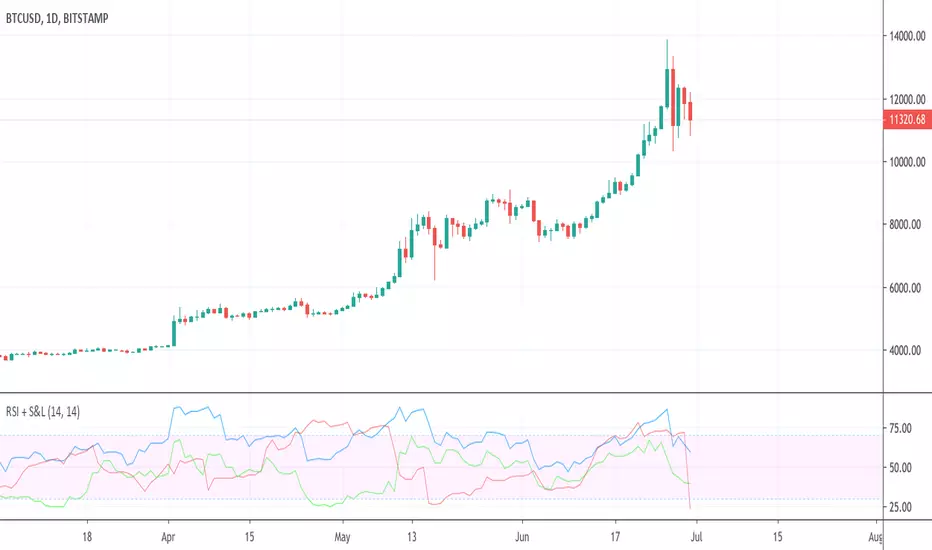
RSI + BTC Short & Long RSIsPlots the RSI for the current chart (same as the built-in RSI indicator) and adds the RSI values for the Shorts and Longs (S&L) from Bitmex. The main reason I've used the RSI value is to have it on the same scale as the price chart's RSI. The general trend of the S&L is preserved.
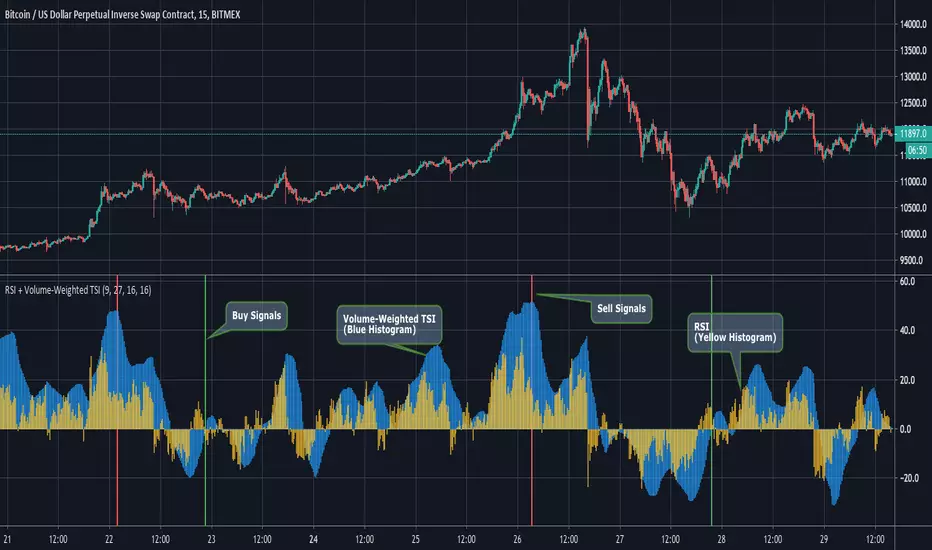
RSI + Volume-Weighted TSIThis indicator combines a standard RSI with a modified TSI.
Although a double smoothing process is already used in calculating the normal TSI, we decided to apply a volume weighted moving average of length (length_of_slow_TSI_EMA // 2) to it. This resulted in a smoother TSI that picked up on large-scale swings very nicely.
Entry Signals are generated when the Volume-Weighted TSI crosses above zero from negative into positive territory. Exit signals are generated when the TSI is above 40 and then begins its downward fall, along with a declining RSI value.
The Graph:
The Volume-Weighted TSI is plotted as the blue histogram, wile the RSI is plotted as the yellow histogram. We definitely wanted to go the simplicity route on this one's graphics, since the RSI and TSI are both classic and reliable indicators.
The green background highlights indicate an entry signal and red highlights signify an exit signal.
Input Options:
-length of Slow EMA for TSI
-length of Fast EMA for TSI
-Length of Volume Weighted MA of TSI.
-Length of RSI.
~Happy Trading~
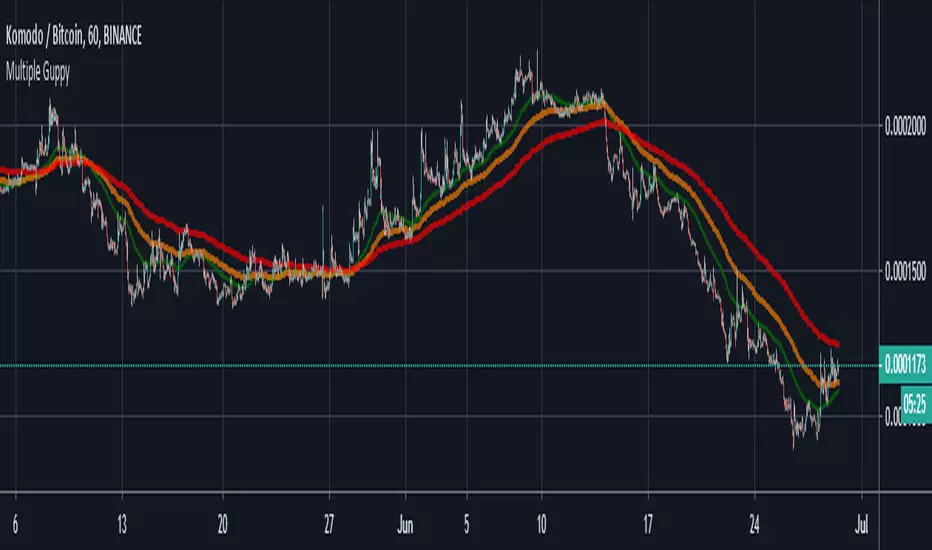
Multiple GuppyGreen crosses DOWN Orange = Early Sell
Green crosses DOWN Orange and Red = Prepare to get out
All crosses DOWN = Strong Sell
Green crosses UP Orange = Early Buy
Green crosses UP Orange and Red = Prepare to get in
All crosses UP = Strong Buy
Easy to observe on 1hr, 2hr, and 4hr charts. Works best on trend reversals.
Good luck.
@eugenie9
CME & XBT - BTC Futures Settlement DatesHi everyone
This in an indicator inspired by Scarrff
I added the XBT quarterly and yearly settlement dates
Enjoy
David

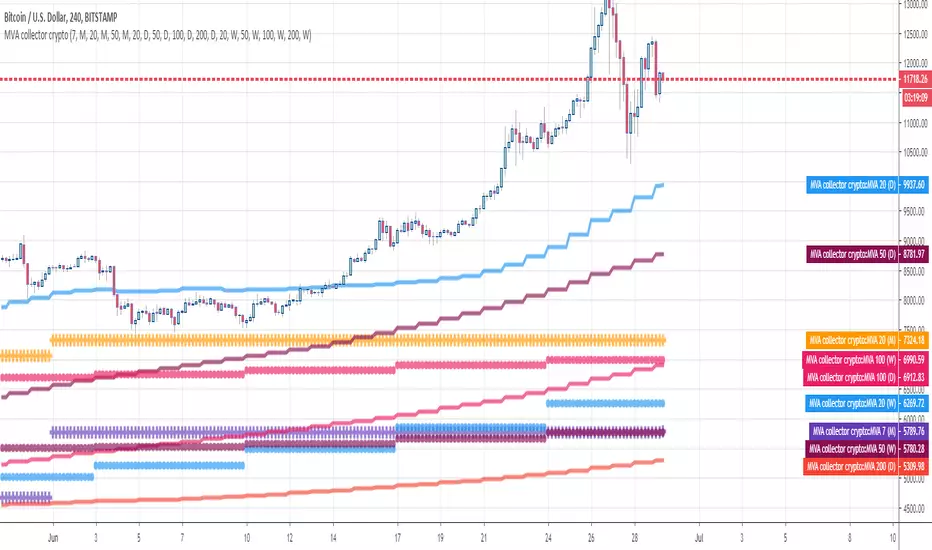
MVA collector cryptoHello Traders
This indicator draw multiple Simple Moving Averages multi-timeframes at once
I use it to define take profit zones for my crypto trading
Hope you'll like it
Enjoy
Dave
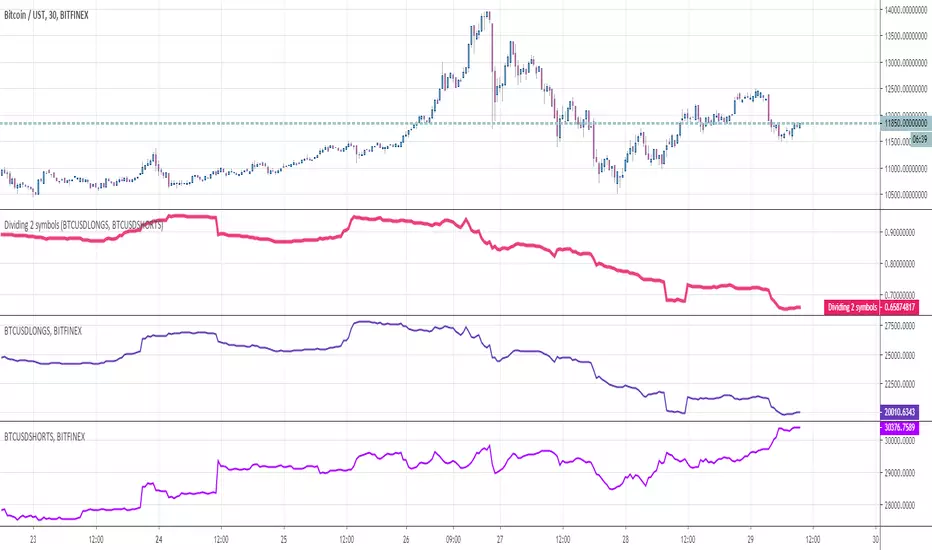
Dividing 2 symbolsHello Traders
This indicator is used to divide two assets between them. Why you would ask ?
For instance, in crypto trading, traders often look at the ratio Longs/Shorts or Shorts/Longs to figure out which side is leading the market and use this information as a powerful hedge for their next trade
Enjoy
Dave
OBV Z-ScoresThis study calculates the On-Balance Volume (OBV) and displays it in terms of its Z-Score.
OBV is a great momentum indicator . As the name suggests, OBV predicts changes in price based on the security's volume flow.
Formula:
if (Current Price > Previous Price)
then Current OBV = Previous OBV + Current Volume
if (Current Price < Previous Price)
then Current OBV = Previous OBV - Current Volume
if (Current Price == Previous Price)
then Current OBV = Previous OBV
As the formula shows, the OBV goes a step beyond just looking at the pure volume of a security. Instead, it factors in relative price action from period to period to reflect investor sentiment. As a result, we often look to the OBV to spot bullish or bearish trends while they are in the early stages of development or simply predict impending uptrends or downtrends.
To make the OBV easier to visualize, we converted the value to a Z-Score. The Z-Score is a simple statistical measurement and represents the current OBV value's distance from the mean OBV value in terms of # of standard deviations.
Users can adjust the values for the 2 upper bounds for Z Scores and 2 lower bounds. Additionally, the n value for z score calculation can be adjusted in the input menu. A higher n value means the z score will be based on a longer lookback period. A lower value will result in more sensitive readings.
Overall, I think this is an interesting way to represent OBV values and will be a valuable leading indicator.
~Happy Trading~

Modiied Elder Ray Index(Bull or Bear)Here's a modified version of the Elder Ray Index created by the famed Dr.Alexander Elder. This indicator has proven to be especially helpful lately given the crazy state of crypto.
Slow Moving Average :
The top chart shows the moving average used to filter trends. I recommend using a higher window length(can be adjusted with the 'lenSlowMA' input option). I wanted this to be a very smooth moving average, so I used the following formula:
slow MA = ema(vwma(close, 64), 64)
This resulted in a pretty smooth line that still detects major price movements very well.
-The background and bar colors both change in response to the Slow MA's value. The background and bars change to green when a bullish trend is detected and red when bearish.
Bear and Bull Power :
To balance things out a little, I included two histogram's based on Elder's Ray. Here, a more responsive EMA with a shorter window length is used to calculate the bull and bear power values and track short-term price fluctuations.
NOTE: The length of the EMA used here can be adjusted in the input menu.
Bull Power = current high - EMA(close, 13)
Bear Power = current low - EMA(close, 13)

Momentum TraderThis study combines two versatile momentum indicators :
Chande Momentum Oscillator:
-Measures trend strength, with higher absolute values meaning greater strength.
-Also tracks divergence. When price increases, but is not accompanied by an increase in Chande Momentum Oscillator values, it signifies bearish divergence and a reversal is likely to follow.
-Shown as the teal and pink histogram.
Percentage Price Oscillator:
-Similar to the MACD, except that it expresses the difference between the two moving averages in terms of a percentage. This makes it a little easier to visualize.
-PPO values greater than zero indicate an uptrend, as that means the fast EMA is greater than the slow (and vice versa).
Entry and Exit Conditions:
Enter When:
1) Chande Momentum crosses over zero from negative to positive territory. AND
2) It has been less than 3 bars since Chande Momentum was less than the lower green line. AND
3) Chande Momentum is rising(positive slope).
Exit When:
1) Chande Momentum is greater than the upper line. AND
2) It has been less than 6 bars since the PPO value was greater than the upper bound. AND
3) PPO is less than 5 (meaning the difference between the two EMA's is less than 5%). AND
4)PPO has a negative slope.
This study comes with alert conditions for long entries and exits.
~Happy Trading~
