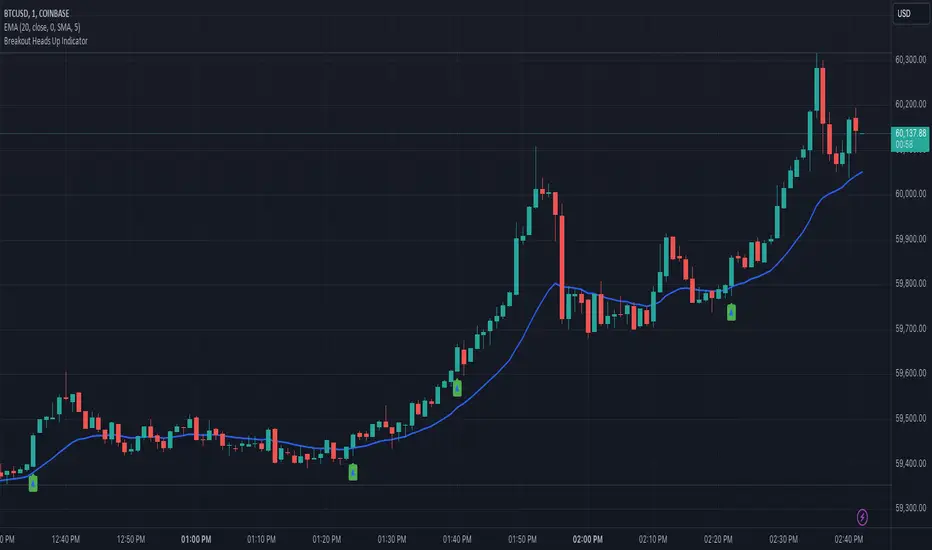
Heads UpAn indicator that gives you the "heads up" that that bullish/ bearish strength is increasing.
I wanted an indicator that could give me the "heads up" that bullish/ bearish strength is increasing. This would help me get into a breakout early or avoid entering a breakout that had a high probability of failure.
Here are my definitions for this indicator:
My bull bar definition:
- A green candle that closes above 75% of it's candle range.
- The candle's body does not overlap the previous candle's body. Tails/ wicks CAN overlap.
My bear bar definition:
- A red candle that closes below 75% of it's candle range.
- the candle's body does not overlap the previous candle's body. Tails/ ticks CAN overlap.
Bullish strength increasing (arrow up):
- Bull bars are increasing in size (the candle's range) compared to previous 5 bars.
- 2 consecutive bull bars.
Bearish strength increasing (arrow down):
- Bear bars are increasing in size (the candle's range) compared to previous 5 bars.
- 2 consecutive bear bars.
You will not see this indicator trigger very often but when it does - it's because there is a change in bullish bearish strength.
Things to be aware of:
Use the indicator in line with the context of the previous trend. You will get triggers that fail. These are usually because they appear counter trend. When in doubt zoom out.
It will not call every successful breakout. If you understand the definitions you'll understand why it appears.
This is my first indicator and used for my personal use. Feedback and other ideas are welcome.
Breakouttrade
Pips Breakout CandlePips Breakout Candle measures price changes in pips. This indicator can be used to identify major price moves! The indicator comes with a sentiment line which is the sum of the Up versus Down price changes. It gives a good understanding of the current trend and identifies divergences.
Set alerts for major price moves!
Identify the trend!
Identify divergence!
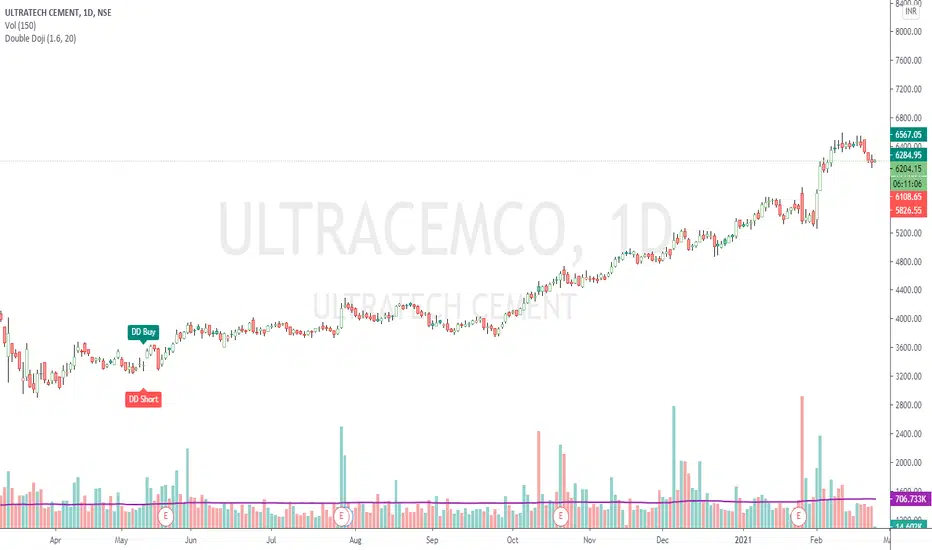
Double DojiStrategy Kiss = 'Keep It Simple, Stupid' or 'Keep It Simple, Smart'
The script simply identifies 2 consecutive Doji candles, and calculates Target on both the sides for given Reward : Risk factor.
The High-Low to Open-Close ratio is set to default value 20. The Reward : Risk ratio is of default value 2.
Both can be set to values of your choice.
Accuracy best on Daily chart. Can be tried on any timeframe though.
Trading Rules: Buy at higher / Short at lower of the 2 candles, with other as Stop Loss.
If a Stop Loss is hit, go for reverse trade. If again a SL is hit, switch to other instrument.
Important: If trading in Futures and target is achieved, hedge the position by buying an option (subject to liquidity).
Reason is, the trend may condition to any extent and you would definitely not want to miss out the whole action.
Check the shared example. For a risk to 175 points, reward is 2200+ points (more than 12.5 times).