Market Structures + ZigZag [TradingFinder] CHoCH/BOS - MSS/MSB🟣 Introduction
🔵 Market Structure
Grasping market structure entails examining market behavior. Essentially, market structure refers to the formation and progression of the market within its trends.
Market structures are generally fractal and nested, leading us to classify them into internal (minor) and external (major) structures. There are several definitions of market structure, with differing perspectives such as Smart Money and ICT offering their own interpretations.
🔵 Zig Zag
The Zigzag indicator is a lagging tool that identifies points on a price chart where significant changes occur compared to the previous wave. By connecting these points, it helps traders detect trends.
This indicator minimizes random price fluctuations, aiming to clarify the primary price trend.
Pivots are points on a price chart where the direction changes. Also known as reversal points, pivots form when supply and demand forces overpower one another.
There are various types of technical analysis pivots, which can be divided into two categories: minor pivots and major pivots, each with distinct significance in analysis.
Major Pivot : These pivots signify substantial changes in the chart's direction and occur at the end of trends. Analysts focusing on primary analysis prioritize major pivot points. In fact, most technical analysis tools are evaluated and based on major pivots.
Minor Pivot : These pivots highlight smaller, subsidiary points and directions, appearing at the end of corrections. Analysts who focus on minor pivots represent small trends. It's important to note that minor pivots are not suitable for use in primary technical tools.
Identifying Minor and Major Pivots :
Minor pivots are formed between two major pivots and do not break the opposing major pivot. (Internal Pivot)
Major pivots are those that either successfully break the opposing pivot or move beyond the previous pivot of the same type. (External Pivot)
🟣 How to Use
🔵 Identifying Break of Structure (BOS)
In a given trend, such as a downtrend, a Break of Structure occurs when the price drops below the previous low and forms a new low (LL). In an uptrend, a BOS (MSB) happens when the price rises and exceeds the last high.
To confirm a trend, at least one BOS is required. The break above or below the previous high or low must be validated by the closing of at least one candle beyond that level.
🔵 Identifying Change of Character (CHOCH)
Change of Character (CHOCH) is an essential concept in market structure analysis, indicating a trend change. In other words, a trend concludes with a CHOCH (MSS). For example, in a downtrend, the price declines with BOS.
While BOS highlights the trend's strength, a CHOCH occurs when the price rises and surpasses the last high, signaling a transition from a downtrend to an uptrend.
This does not imply immediately entering a buy trade; instead, it is prudent to wait for a BOS in the upward direction to confirm the uptrend.
Unlike BOS, confirming a CHOCH does not require a candle to close; simply breaking above or below the previous high or low with the candle's wick is sufficient. The following examples illustrate bearish and bullish CHOCH.
Terms :
Market Structure Shift = MSS
Market Structure Break = MSB
🔵 Zig Zag
Based on identifying pivots and drawing zigzag lines, you can have different uses of this indicator.
Including :
Identifying pivot types along with major and minor recognition.
Identifying internal and external breakouts.
Identifying support and resistance levels.
Identifying Elliott Waves.
Identifying classic patterns.
Identifying pivots with higher validity.
Identifying trends and range areas.
🟣 Settings
Pivot Period Market Structure and ZigZag Line: Using this input, you can determine the pivot period for identifying swings.
Through the settings, you can customize the display, visibility, and color of each line as desired.
Breakofstructure

Market Structures SMC [TradingFinder] BOS/CHoCH Major & Minor🟣Introduction
Understanding market structure involves analyzing market behavior. In other words, market structure encompasses how the market forms and evolves within trends.
Market structures are typically fractal and nested, so we categorize them into internal (minor) and external (major) structures. There are various definitions of market structure, with different approaches such as Smart Money and ICT providing their own interpretations.
🟣How to Use
The first step in identifying market structure is to analyze key highs and lows. An uptrend is formed when highs and lows are successively higher than previous ones. Similarly, in a downtrend, lows and highs are successively lower than previous ones.
Market trends consist of two types of movements :
•Impulsive movements
•Corrective movements
Impulsive movements align with the main trend and possess high strength and momentum. Conversely, corrective movements go against the main trend and have lower strength and momentum. The following example illustrates these concepts.
🔵 Identifying Break of Structure (BOS)
In a specific trend, for example in a downtrend, when the price breaks below the previous low and forms a new low (LL), a Break of Structure occurs. In an uptrend, a BOS (Market Structure Break or MSB) happens when the price rises and surpasses the last high.
We need at least one BOS to confirm a trend. Breaking above or below the previous high or low must be confirmed by closing at least one candle after that level.
🔵 Identifying Change of Character (CHOCH)
Change of Character (CHOCH) is a key concept in market structure analysis. A change in structure signals a trend change. In other words, a trend ends with a CHOCH (Market Structure Shift or MSS). For instance, in a downtrend, the price declines with BOS.
BOS indicates the strength of the trend, but when the price increases and surpasses the last high, a CHOCH occurs, signaling a shift from a downtrend to an uptrend.
This does not mean entering a buy trade; instead, we should wait for a BOS in the upward direction to confirm the uptrend. Unlike BOS, confirming a CHOCH does not require a candle to close; simply breaking above or below the previous high or low with the candle's wick is sufficient. The following examples show bearish and bullish CHOCH.
🔵 Range Market Structure
Besides uptrends and downtrends, a third structure often found in the market is the range or sideways structure. In this state, the power of buyers and sellers is almost equal, and the market lacks a clear trend.
Many traders believe that the Forex market ranges 80% of the time. Therefore, it requires a lot of patience to wait for a new trend to start.
🟣 Settings
Through the settings, you can customize the display, visibility, and color of each line as desired.

Market Structure (Intrabar) [LuxAlgo]The Market Structure (Intrabar) indicator is designed to automatically detect and highlight real-time intrabar market structures, a core component of the Smart Money Concepts methodology.
🔶 USAGE
The proposed indicator gives a detailed picture of the most recent candle lower timeframe trends, highlighting market structures within them.
This can be particularly useful to assess the price dynamic within the most recent candle. For example, we can see how pronounced a trend is by the number of opposite bullish/bearish market structures formed within the candle.
Users can select the intrabar timeframe of interest from the "Intrabar Timeframe" setting, using a timeframe significantly lower than the chart timeframe will return more intrabar candles and potentially more market structures.
🔹 Dashboard
Users have access to a dashboard returning useful statistics such as the number of formed CHoCH's and BOS's from the intrabar prices. These can be indicative of how predominant a trend is within the intrabar data or if there exist multiple trends.
🔶 DETAILS
Market structures allow determining trend continuations as well as trend reversals in the market through two distinct structures:
🔹 Change of Character (CHoCH)
A change of character (CHoCH) refers to a shift in the market behavior of a security that is driven by changes in the underlying supply and demand dynamics. CHoCH's are indicative of confirmed reversals.
🔹 Break of Structure (BoS)
The break of structure (BoS) refers to the point at which a key level of support or resistance is broken. BOS's are indicative of confirmed trend continuations.
🔶 SETTINGS
🔹Inside the Bar Market Structure
Intrabar Timeframe: Lower timeframe setting option, if set to 'Auto' the script will determine the lower timeframe based on the chart timeframe.
Intrabar Market Structure, Length: Toggles the visibility of the break of structures and change of characters. Length defines the detection length of the swing levels.
Intrabar Swing Levels: Toggles the visibility of the swing levels, including a color customization option for highs and lows.
Intrabar Statistics: Toggles the visibility of the dashboard. Some further statistical details are presented in the tooltips of the table cells
🔹 General
Market Structure Colors: Color customization option for the break of structure and change of character lines and labels.
Intrabar Candle Colors: Color customization option for intrabar candles.
Intrabar Candles Horizontal Offset: Adjusting the intrabar candles horizontal position
Dashboard: Dashboard position and size customization option
🔶 LIMITATIONS
Please note that seconds-based intervals are available for premium and professional plan holders, which implies that the seconds-based intervals usage of the indicator may not be available for all users depending on their subscription plan.
🔶 RELATED SCRIPTS
Smart-Money-Concepts
ICT-Concepts

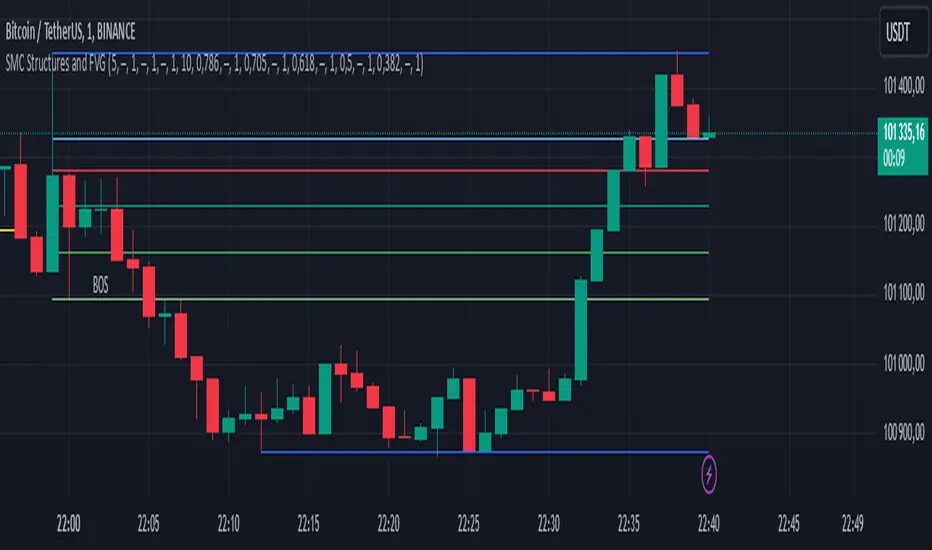
SMC Structures and FVGThe SMC Structures and FVG indicator allows the user to easily identify trend continuations (Break Of Structure) or trend changes (CHange Of CHaracter) on any time frame. In addition, it display all FVG areas, whether they are bullish, bearish, or even mitigated.
Fair Value Gap :
The FVG process shows every bullish, bearish or even mitigated FVG liquidity area. When a FVG is fully mitigated it will directly be removed of the chart.
There is an history of FVG to show. By selecting specific number of FVG to show in the chart, the user can focus its analysis on lasts liquidity area.
Here's the rules for FVG color :
Green when it's a bullish FVG and has not been mitigated
Red when it's a bearish FVG and has not been mitigated
Gray when the bullish / bearish FVG has been mitigated
Removed when the FVG has been fully mitigated
Structures analysis:
The Structure process show BOS in grey lines and CHoCH in yellow lines. It shows to the user the lasts price action pattern.
The blue lines are the high value and the low value of the current structure.
Market Dynamics Pro [ChartPrime]ChartPrime Market Dynamics Pro is designed to cater to those traders who are more interested in market structures, price action and fundermentals. Analysing volume, key levels in the market, market phases and multi-timeframe can help a trader build a clearer and more actionable view of the market. ChartPrime performs analysis on data in a unique way therefore attempting to give insights into the market otherwise unseen.
Major Features:
Order blocks: The ChartPrime order blocks provide sleek and clear levels in the market where the price might find support and resistance. It is important to note this data isn't availible currently therefore these are derived from data outside of order books. Order blocks are segmented into 4 sections reflecting the volume at a given levels. Low, Medium, High and very high based on relevant and dynamic averages. This allows a trader to identify how significant a level is in the market in a simpler method. Bearish order blocks have a red color bias and bullish order blocks have a green color bias allowing a trader to identify what type of order block it is. The order blocks also dynamically show the remaining volume at that given level.
Pattern Detection: ChartPrime leverages unique pattern identification methods providing earlier and cleaner chart formations. Patterns are commonly used in trading to assess whether bulls or bears are performing optimally in a market or losing strength. ChartPrime identifies; Ascending wedges, descending wedges, symmetrical Triangles, H&S, iH&S, broadening wedges and double tops/bottoms. Patterns often have associated theory behind them for entries and targets that we suggest a trader covers before using this feature. ChartPrime also allow for the user to adjust where a pattern is drawn from. In pattern theory there are 2 main approaches to drawing a formation; from candle body and candle wick. ChartPrime allows for this to be adjusted by a user and also allow for alerts to be set on these patterns.
MTF SR: Taking into account multi timeframes when trading is a key idea. Having ideas of the larger market moves can provide deeper context when trading. ChartPrime Market Dynamics Pro allows for 3 varying SR plots from 3 varying user desired timeframes. These are graded via pivot analysis and grid analysis. This rank is on a 1-10 scale with 1 being the highest rank and 10 is the lowest.
Market Stucutures : These labels are commonly found and used by the Smart Money community. They denote a break of stucture and a chance of character. BOS are labelled when the price breaks a lower low or higher high (in the trending markets) and a CoC occurs when price breaks a trending market pivot. These break a market into clearer breakouts of price action and can help a trader deduce relevant moves. The indicator allows for the user to adjust the detection length of these structures.
Premium and Discount Zones: Premium and Discount zones are underpinned by a simple piece of logic. A premium zone is taken from a higher swing point and the discount from a lower swing point. Although a very generic approach this can show areas in the market that could see a reaction. An asset being in a discount zone implies the price is undervalued. An asset being in a premium zone implies the asset is overpriced or overextended. These are excellent when used in confluence with other SR methods. These naturally will have a delay as they are derived from swing points in a market but still are extremely relevant levels.
Fair Value Gaps: These are gaps in the market where price has seen a highly volatile move and they are assumed to act as magnets in the market. The price may come back and visit these 'gaps' after the move has occured. These are a common technique now used by traders and added to this toolkit for convinience.
Settings:
Order Blocks: Select the scale of the order blocks displayed
BoS/CoC: Toggle these on/off and adjust the lookback on these market structures
Premium/Discount Zones: Toggle on/off and adjust lookback
Enable FVG: Toggle on/off FVGs
Swing Levels: Enable basic swing levels in market
MTF Support/Resistance: Enable and select the relevant timeframe to obtain MTF SR levels on your chart. Up to 3 timeframes at a time.
Predictive Ranges: Toggle on/off
Trend Lines Detection: Toggle on/off trendlines
Wedge Detection: Adjust how patterns are detected; whether from wick or candle body
Toggles provided for relevant patterns.
Example usecases:
ChartPrime order blocks give a deeper insight into market support and resistance levels. Looking for order blocks labelled with High can indicate this level being a significant support or resistance in the market. Adding in further confluences here can assist further in deciding where the price may see a reaction. Take the screenshot below:
Adding in confluences from other timeframes can also help give a broader view. Using the multi time frame graded frame support and resistance levels we can use these to further assist us in finding significant levels in the market.
ChartPrime also provides breaker blocks. These are still significant levels in the market despite being "broken" prior. These too can be used in a classical manor and act as relevant areas in the market. These are particularly effective when used in confluence with Premium and discount zones. We can see in the example below price sees a strong reaction and bounces at these levels.
Market Dynamics Pro provides a comprehensive toolkit of unique features and mixes in the classical concepts allowing for a cleaner charting experience.
All content and indicators provided by ChartPrime are purely for informational & educational purposes only. Past performance does not guarantee future results.
Ücretli komut dosyası

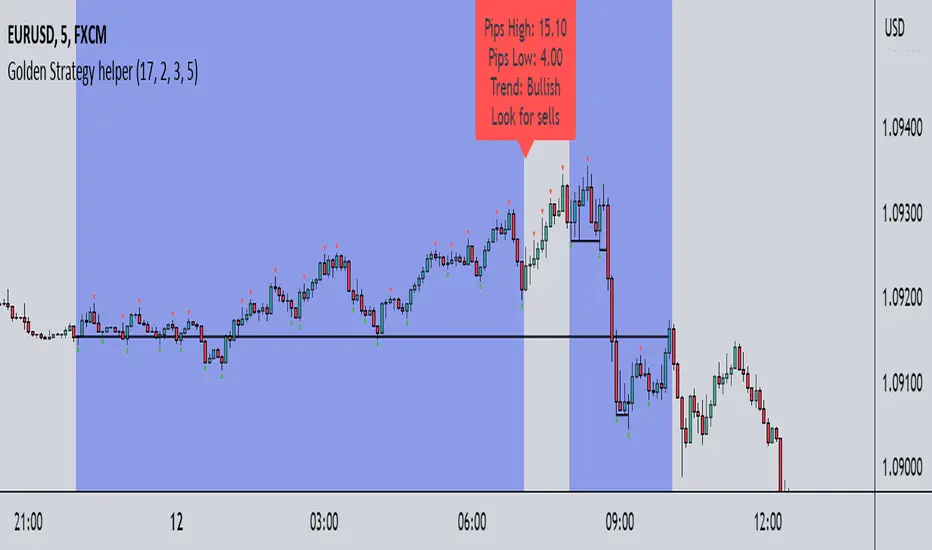
Golden Strategy helperIndicator that was made to be used in BilzSMC Golden Strategy.
It Includes:
-Asian and Trading Sessions
-Label with Asian Trend and what direction you should follow in the trading session
-Line representing the Open price of Asian Session
-Identification of Swing Points
-Identification of Breaks of Structures ( ONLY in the trading direction) and custom alerts when this happens
-Custom inputs for you to adapt the indicator to your liking
If you find any bug or have any suggestion feel free to comment or message me directly.
Happy Trading!
"The Stocashi" - Stochastic RSI + Heikin-AshiWhat up guys and welcome to the coffee shop. I have a special little tool for you today to throw in your toolbox. This one is a freebie.
This is the Stochastic RS-Heiken-Ashi "The Stocashi"
This is the stochastic RSI built to look like Heikin-Ashi candles.
a lot of people have trouble using the stochastic indicator because of its ability to look very choppy at its edges instead of having nice curves or arcs to its form when you use it on scalping time frames it ends up being very pointed and you can't really tell when the bands turn over if you're using a stochastic Ribbon or you can't tell when it's actually moving in a particular direction if you're just using the K and the D line.
This new format of Presentation seeks to get you to have a better visual representation of what the stochastic is actually doing.
It's long been noted that Heikin-Ashi do a very good job of representing momentum in a price so using it on something that is erratic as the stochastic indicator seems like a plausible idea.
The strategy is simple because you use it exactly the same way you've always used the stochastic indicator except now you can look for the full color of the candle.
this one uses a gradient color setup for the candle so when the candle is fully red then you have a confirmed downtrend and when the candle is fully green you have a confirmed up trend of the stochastic however if, you a combination of the two colors inside of one candle then you do not have a confirmed direction of the stochastic.
the strategy is simple for the stochastic and that you need to know your overall trend. if you are in an uptrend you are waiting for the stochastic to reach bottom and start curving up.
if you are in a downtrend you are waiting for the stochastic to reach its top or its peak and curve down.
In an uptrend you want to make sure that the stochastic is making consistently higher lows just like price should be. if at any moment it makes a lower low then you know you have a problem with your Trend and you should consider exiting.
The opposite is true for a downtrend. In a downtrend you want to make sure you have lower highs. if at any given moment you end up with a higher high than you know you have a problem with your Trend and it's probably ending so you should consider exiting.
The stochastic indicator done as he can actually candles also does a very good job of telling you when there is a change of character. In that moment when the change of character shows up you simply wait until your trend and your price start to match up.
You can also use the stochastic indicator in this format to find divergences the same way you would on the relative strength index against your price highs and price lows so Divergence trading is visually a little bit easier with this tool.
The settings for the K percent D percent RSI length and stochastic length can be adjusted at will so be sure to study the history of the stochastic and find the good settings for your trading strategy.

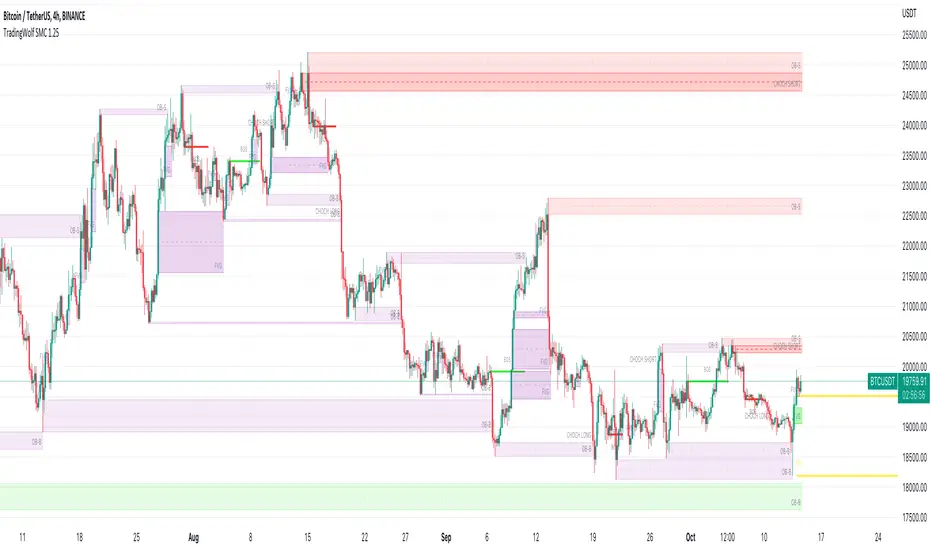
TradingWolf Smart Money
The TradingWolf Premium Smart Money Concept is a unique and enhanced selection of ideas designed to help give you an edge on the markets.
Within this one indicator you will have access to Fair Value Gap, Order Blocks, Break of Structure, Forecasting, Supply & Demand.
Below find each explanations on how to use each indicator
This script comes with the 'TradingWolf Premium' to get access, read the Author’s Instructions below.
There are extensive explanations on how to use this in our documentation on the website but we will give a simple overview here.
Order Blocks
There are several different ways people like to calculate order blocks, one of the ways we like is by using pivot points to identify levels of importance, from there we either highlight the highest/lowest closed candle or the wick. The user has the option to choose this in the settings.
As seen in the image above, you can see these levels are well respected and give people an opportunity to help where the market marker is placing their orders.
Fair Value Gaps
Fair value gaps can be a very useful concept in price action trading. They detect instances in which there are inefficiencies, or imbalances, in the market. In this case, we define imbalance as an instance in which buying and selling is not equal. This is often visualised as a large candle whose neighbouring candles’ wicks do not fully overlap the large candle. Below are a few examples of Fair Value Gap.
If price is in a downtrend and there is a fair value gap above, a trader might look to go short when that FVG fills. Inversely, if price is in an uptrend and there is a FVG below, a trader might look to go long when the FVG fills.
In this script we decided to highlight both types, one is simply marking up all technical FVGs which is the gap produced by the large candle, the other more commonly traded ones are market structure breaking ones.
These ones tend to be more respected so note they are highlighted in a separate colour to make them more visible.
If a FVG has been filled that box will dim away so it's not in your way.
ChoCh
‘Change of Character’ Hugely used by professional traders although they may not have heard of it called by this term. This is where price/market structure is trending in a certain direction but price starts to reverse.
This first happens when there is a break of structure, instead of another Lower High formed, price makes a Higher High like in the image above. This is where we highlight a break of structure or some people will just refer to this as the Choch line, once we have this we can look for an Order block / supply zone below to find an entry.
This is a hugely powerful tool dating back to one of the simplest and first concepts of trading where Market structure is King.
Peaks & Troughs
This tool helps you find potential reversal points in your support/resistance area, Simple candlestick patterns but incredibly powerful when used in confluence with our other tools.
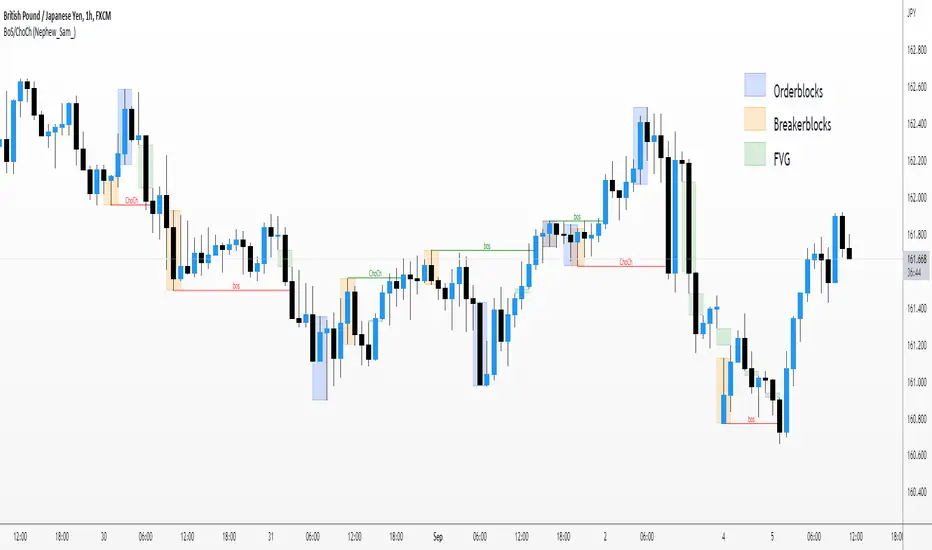
Market Structure BOS/CHOCH/MSB/FVG/OB/BB (Nephew_Sam_)This market structure indictor uses pivot points to find break of structure and change of character.
You can enable the options to find Fair Value Gaps, Breaker Blocks and Orderblocks too. The way this works is, once a bos/choch is found, it will loop back and find all fvg/ob/bb from that point until the previous pivot point.
Settings
Pivot strength - How many candles to the left/right requried to determine a swing high
Breakout Confitmation - The breakout candle should close under the previous pivot or the wick H/L should be under
Show xyz - show HH/LL, Break of structure and change of character
FVG/OB/BB - Show, bull/bear colors, extend boxes to the right, delete boxes once filled, fill type close or H/L
Mark StructureMark Structure is building the market swing structure, minor and sub structure and marks all possible insignificant pivots
Building such structure is really complex task to do, that has a lot of obstacles and challenges. I'm doing my best to develop this indicator behaving in absolutely expectable and right way. Fill free to leave any comments or bug reports.
it supports:
- Marking all pivots with labels or join them continuously with trend lines.
- Marking minor and sub structured swings with labels or join them continuously with trend lines. Marking BOS or SMS BOS, which are mbos. Minor and substructure are structures inside swing structure and it can differ from the structure of lower timeframe
- Marking swings of swing structure with labels or join them continuously with trend lines. Marking BOS or SMS BOS of swing structure
- Changing bullish and bearish colors of each kind of structures
- Changing pivot labelings
- Changing colors of BOSs
Remarks:
- As I told you guys before, it has a lot of challenging cases. eg we have swing low and high on the same candle and in order to decide which pivot goes first I take lower time frame data to figure out what pivot is the first, but it happens that on lower time frame the same issue takes place, due to limitation of TradingView I can't go infinitely to lower timeframes to solve this issue, so I mark those cases with labels
- Another issue is very beginning of the trend its hard to detect swing structure there due to missing historical data. so skip a few waves in the very beginning
- Don't expect to have minor and sub structure in each swing waves, its totally fine when you don't have them at all
- Swing structure is the most significant structure and shows real price direction. Trend change is confirmed when for bull->bear the last HLbull LH>HH and HH-HL-HH are confirmed. You can change labelling for unconfirmed swing trend in the settings. By default its already done

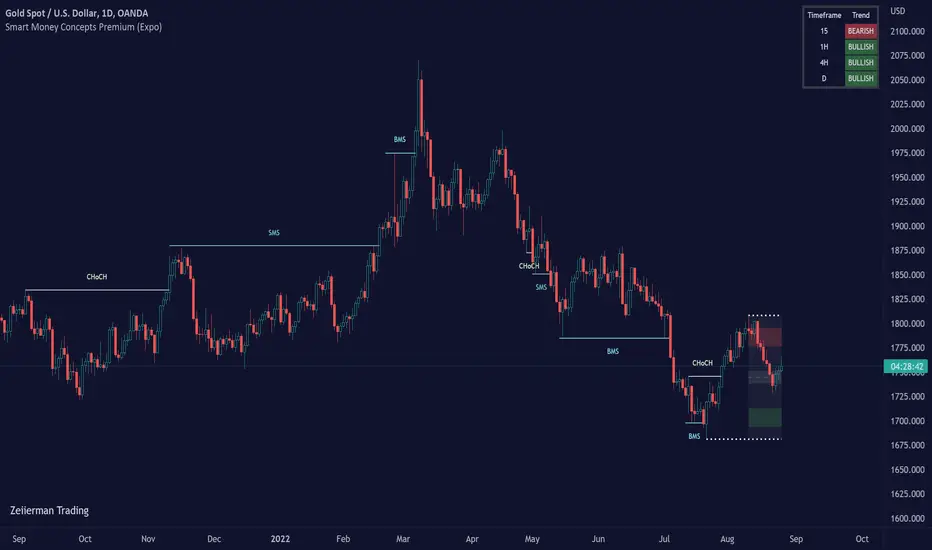
Smart Money Concepts Premium (Expo)Are you a professional Smart Money Concept Trader?
█ This premium version of our SMC indicator includes all advanced Smart Money Concept Trading techniques. The indicator includes all the important concepts such as Market Structure, Change of Character, Current Trading Range, Premium & Discount , Fractals, and Swing Structure. The indicator includes the popular SMC Market Structure Trend to help traders analyze the trend.
In addition to these features, this version adds the following:
Multitimeframe option
Predicted Structure and Range
Backtesting option
External Range Liquidity
Internal Range Liquidity
Liquidity Grab
Fair Value Gap (FVG)
True Fair Value Gap
Imbalance
Order block
Orderflow
Supply & Demand
Equal Highs and Equal Lows
Point of Interest
An alert function that allows you to set any combination of alerts.
This indicator aims to be an all-in-one SMC indicator that helps Smart Money Traders automate their analyzes.
█ HOW TO USE
Use the indicator to trade advanced SMC Trading techniques.
█ Settings
The indicator is fully customized and can be adjusted to fit Swing Trading, Trend Trading, Day Trading, or Scalping.
The indicator works in any market and timeframe.
-----------------
Disclaimer
Copyright by Zeiierman.
The information contained in my Scripts/Indicators/Ideas/Algos/Systems does not constitute financial advice or a solicitation to buy or sell any securities of any type. I will not accept liability for any loss or damage, including without limitation any loss of profit, which may arise directly or indirectly from the use of or reliance on such information.
All investments involve risk, and the past performance of a security, industry, sector, market, financial product, trading strategy, backtest, or individual's trading does not guarantee future results or returns. Investors are fully responsible for any investment decisions they make. Such decisions should be based solely on an evaluation of their financial circumstances, investment objectives, risk tolerance, and liquidity needs.
My Scripts/Indicators/Ideas/Algos/Systems are only for educational purposes!
Ücretli komut dosyası
Smart Money Concept (Expo)Are you Trading SMC? - Are you willing to learn how to apply SMC techniques? - Great, this indicator is for you!
█ This Smart Money Concept ( SMC ) indicator is a sophisticated and highly innovative indicator that combines all the necessary features to trade SMC trading techniques. It is built off of Smart Money Concepts inspired by inner trader circle (ICT) teachings. Smart Money is considered the capital allocated by institutional investors, funds, and other larger financial market participants. This indicator takes the Institutional trading behavior and makes it accessible to retail investors. By using an SMC indicator, you get professional insights into the market.
█ This indicator provides you with all of the most important SMC principles in one indicator. Fully automated and real-time Break of Market Structure, Change of Character, Current Trading Range, Premium & Discount , Fractals, and Swing Structure. In addition to the most important features, we have added a highly unique SMC Market Structure Trend based on the market structure principle. A confirmed swing structure trend background enhances the trend feature even more.
Swing Structure
Identifying major market structures with the indicator.
Current Trading Range
The Range feature ensures that traders always know where the current range is and where to find Premium and Discount within that range. In addition, the range is updated in real-time without any delay.
Premium & Discount Zones
Identifying Premium and Discounts zones automatically for you.
Structure break
Break of Market Structure ( BMS ) and Change of Character ( CHoCH ) - are automatically identified and plotted in real-time.
Supply and Demand
Use our Supply/Demand indicator to identify high probabilities trading zones.
█ HOW TO USE
Use the indicator to trade SMC Trading techniques.
Use the indicator to understand the current market structure.
Use the indicator to identify the current range and premium and discount levels.
█ Settings
The Market structure period is fully customized and can be adjusted to fit Swing Trading, Trend Trading, Day Trading, or Scalping.
The indicator works in any market and timeframe.
█ Basic Terminology
S&D - Supply & Demand
S2D - Supply to Demand
D2S - Demand to Supply
OB - Orderblock
AOI - Area of Interest
POI - Point of Interest
LOR - Level of Respect
FLOR - First Level of Respect
IMB - Imbalance
INF - Inefficiency
FVG - Fair Value Gap
IRL - Internal Range Liquidity
ERL - External Range Liquidity
HH - Higher High
HL - Higher Low
LL - Lower Low
LH - Lower High
BOS - Break of Structure
BMS - Break of Market Structure
mBOS - Minor Break of Structure
SMS - Shift in Market Structure
CHoCH - Change of Character
mCHoCH - minor Change of Character
EQH - Equal Highs
EQL - Equal Lows
BSL - Buy Side Liquidity
SSL - Sell Side Liquidity
LQ - Liquidity
EQ - Equilibrium
PA - Price Action
MTF - Multi Timeframe
HTF - Higher Timeframe
LTF - Lower Timeframe
PT - Protrend
CT - Counter trend
OF - Orderflow
EOF - Expectational Orderflow
LOD - Low of the Day
HOD - High of the Day
HOW - High of the Week
LOW - Low of the week
RE - Risk Entry
CE - Confirmation Entry
DCE - Double Confirmation Entry
SL - Stop loss
RR - Risk Reward
BFI - Banks & Financial Institutions
Hedgies - Hedge Funds
-----------------
Disclaimer
Copyright by Zeiierman.
The information contained in my Scripts/Indicators/Ideas/Algos/Systems does not constitute financial advice or a solicitation to buy or sell any securities of any type. I will not accept liability for any loss or damage, including without limitation any loss of profit, which may arise directly or indirectly from the use of or reliance on such information.
All investments involve risk, and the past performance of a security, industry, sector, market, financial product, trading strategy, backtest, or individual's trading does not guarantee future results or returns. Investors are fully responsible for any investment decisions they make. Such decisions should be based solely on an evaluation of their financial circumstances, investment objectives, risk tolerance, and liquidity needs.
My Scripts/Indicators/Ideas/Algos/Systems are only for educational purposes!

Super OrderBlock / FVG / BoS Tools by makuchaku & eFeThis super indicator is a Swiss army knife for Smart Money traders for OrderBlocks / FVG / BoS
It provides many options for drawing (non-repainting) boxes for OrderBlocks, Fair Value Gaps (FVG) and Break of Structures. The boxes are extended into the future, until the first retest/mitigation.
Some of the additional options (not explained in the diagrams above)
PPDD OB : An order block which is formed after interacting with Liquidity (old low/high, fractal low/high, etc). Since these OB's are in the most premium or most discount, they are Premium Premium Discount Discount OB's (PPDD OB)
HVB Bars : When the volume of any bar is higher than the average volume of last N bars, it could mean something important (in the right context). Hence, the indicator allows for coloring them differently.
This indicator was built as a collaboration between @makuchaku & eFe
Pro tip : This indicator is a simply a tool to visualize trading concepts on the candle stick chart. It is the job of the trader to sequence these effectively into a profitable trade.
If you come across any bug or have a question on how to effectively use the indicator, please don't hesitate to ask questions.
Good luck & good trading!

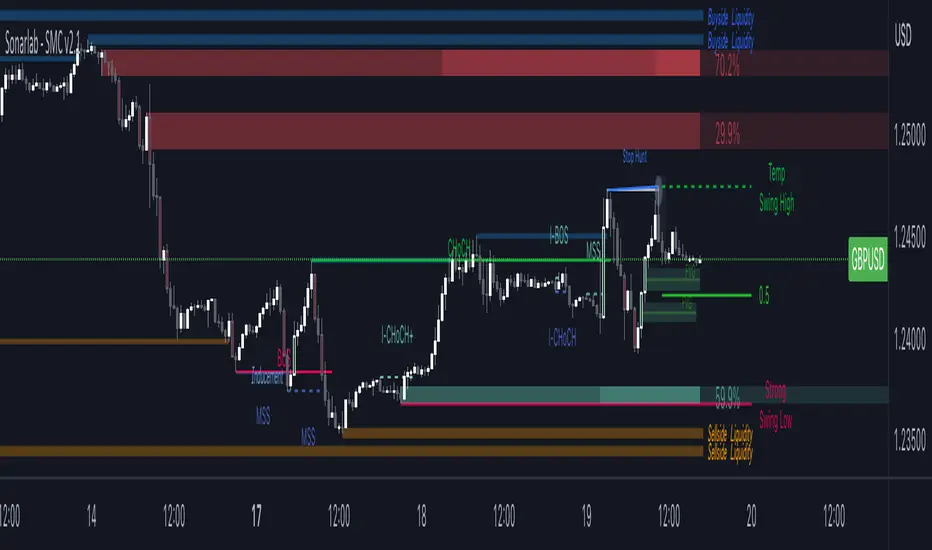
Sonarlab - Smart Money ConceptsSupply and Demand is one of the core strategies used in trading. It focuses on the ancient laws of supply and demand and how price moves in a free-flowing market. Supply and demand zones are a popular analysis technique used in all kinds of trading styles. The zones are the periods of sideways price action that come before explosive price moves, and are typically marked out using a box. We wanted to make these squares drawn automatically for you - so it will save you time spotting the zones.
Green Box
The green box defines demand - in these areas you will look for long opportunities. You can also use these zones for take profit levels when you are in a sell trade.
Blue Box
The blue box defines supply - in these areas you will look for short opportunities. You can also use these zones for take profit levels when you are in a buy trade.
Break of structure
For markets to move up and down a break in market structure must occur. A break in market structure occurs when the market begins to shift direction and break the previous HH and HL or HL and LL of the market. We also integrated the feature that you can see the BOS lines. In the indicator settings you can adjust the values:
1) Sensitivity
2) Min. candles in structure
3) BOS type: close or wick
Warning Never blindly take a position on each box - wait for a proper signal to occur before considering a position.
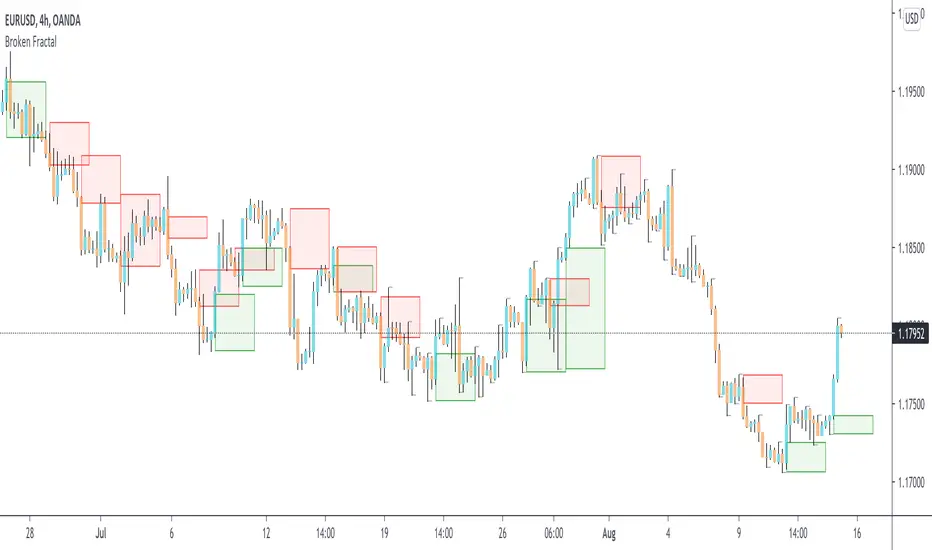
Broken Fractal : Someone's broken dream is your profit!Idea
The idea is simple : when market turns around, it traps a bunch of traders off guard. We trade with them, in the same direction of their exit!
Method
We let the market first create a fractal
We then let the market create an opposite fractal
We then let the market break the first fractal it created, thereby trapping lots of trades in the process
We then patiently wait till the market gives these trapped traders a chance to exit - and we trade in the same direction
How to use?
Green boxes are for long entry, red boxes are for short.
Whenever a box appears, that's the risk criteria - setup limit orders and trade along!
Works on all timeframes
If you like this script, please leave a note on how you are using it.
I personally use it with Higher Timeframe bias.
PS1 : some traders call this Break of market structure, some call it Breaker, I just call it "Broken Fractal"
PS2 : Break of a broken fractal is also very potent. Watch out for those!