Spot vs. Derivatives BasisThis indicator calculates the basis between average spot and average perpetual futures prices across selected exchanges. It helps identify deviations between spot and perp markets — a key signal for funding pressure, arbitrage, or market dislocation.
Key Features:
Manual Pair Control – Enable or disable specific trading pairs as needed
Flexible Basis Smoothing – Apply SMA, EMA, WMA, or VWMA to filter noise
Anomaly Highlighting – Automatically flags basis deviations beyond ±0.1%
Bitmex

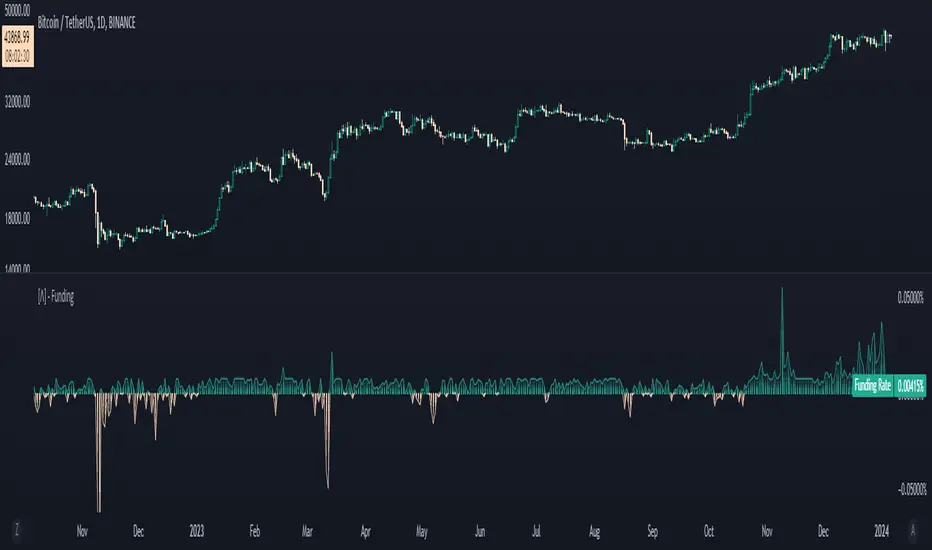
Aggregated Funding RateThis funding rate indicator combines data from two of the largest cryptocurrency exchanges, BitMex and Binance, and supports USD, USDT, and BUSD currency pairs. Moreover, it covers a wide range of 31 different crypto assets to choose from, providing users with a comprehensive view of the funding rate for each asset.
The aggregation is formed by calculating the funding rate of the cryptocurrency for each perpetual chart respectively (Binance - USDT & BUSD and BitMex - USDT & USD). The calculation itself is based on each exchange's official formula, hence the reasoning behind including only 4 sources, they are currently the only ones which can be calculated this way in Tradingview.
Afterwards, it is either summed or averaged based on the user input. Additionaly, the user may choose freely which of the four sources will be included.
What is Funding Rate ?
The funding rate is the cost of holding a cryptocurrency position on a futures exchange. It is essentially an interest rate paid by the long or short position holder to the counterparty. If the funding rate is positive, longs pay shorts, and if it is negative, shorts pay longs. This rate is adjusted periodically, typically every eight hours, to ensure that the futures price of the cryptocurrency remains close to its spot price.
Utility :
The funding rate indicator can be used in a variety of ways. Traders can use it to gauge the sentiment of the market. If the funding rate is consistently positive, it suggests that there is more demand for long positions than short positions, indicating that the market is bullish. On the other hand, if the funding rate is consistently negative, it suggests that there is more demand for short positions than long positions, indicating that the market is bearish.
In addition, the funding rate indicator can be used to identify potential trading opportunities. If the funding rate is significantly higher than usual, it may indicate that longs are overpaying shorts, creating a potential arbitrage opportunity. Alternatively, if the funding rate is significantly lower than usual, it may indicate that shorts are overpaying longs, creating a potential arbitrage opportunity in the opposite direction.
Key Features
Aggregation type
31 supported cryptocurrencies
Simple or Depth style options
Sources to aggregate
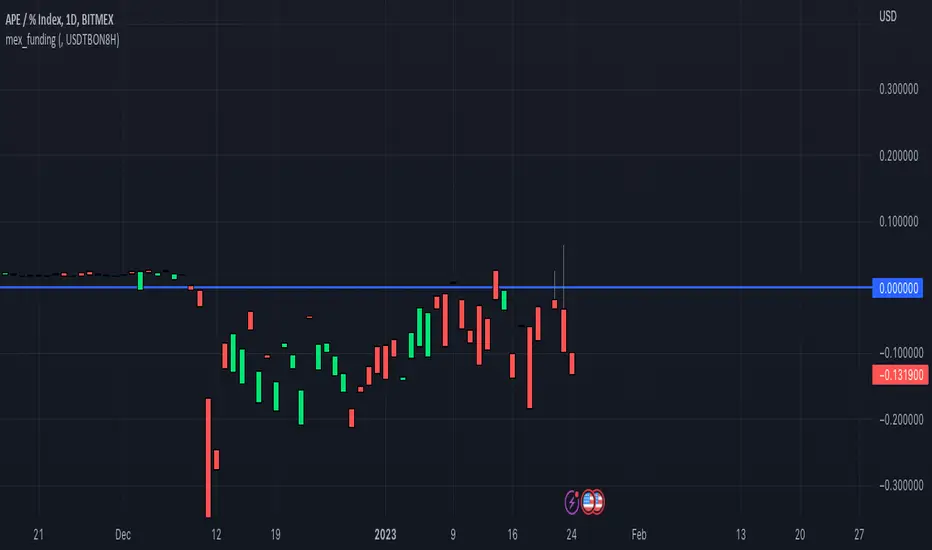
mex_fundingScript for calculating Bitmex funding based on the Premium tickers Bitmex submits to Tradingview
Make sure you add the correct Bitmex Interest Base and Quote Symbols in the input settings
For example for www.bitmex.com the inputs are:
Chart ticker: XBTUSDPI8H
Input Settings
Interest Base: XBTBON8H
Interest Quote: USDBON8H
WhaleCrew Crypto Open InterestUse Crypto Open Interest Data available on TradingView to your advantage.
Features
Auto-Detect Symbol (based on chart)
Preset Symbols (BTC, ETH, BNB, XRP, LUNA, ADA, SOL, AVAX and DOT)
Exchanges ( Binance and BitMex )
Inverse and USDT Pairs
Override Data Option to use any OI Data on TradingView
Customizable Candles

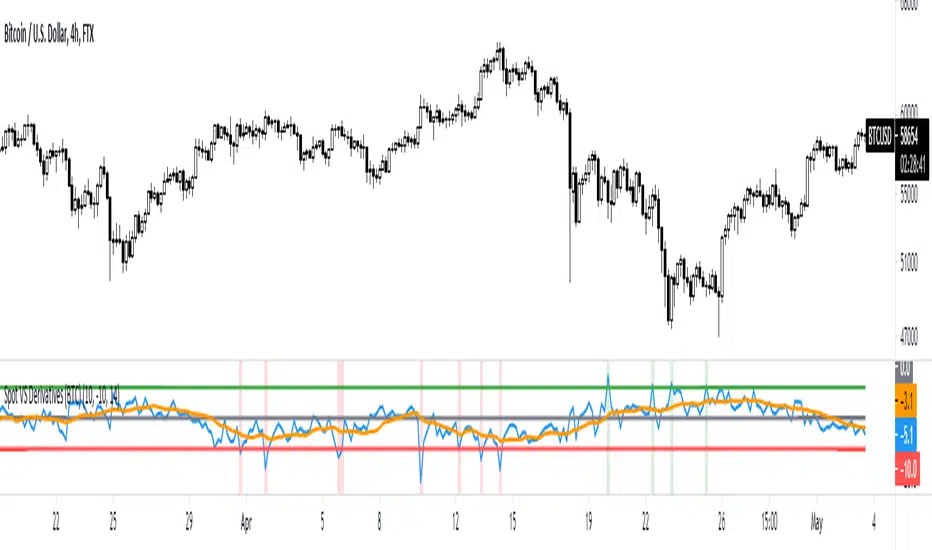
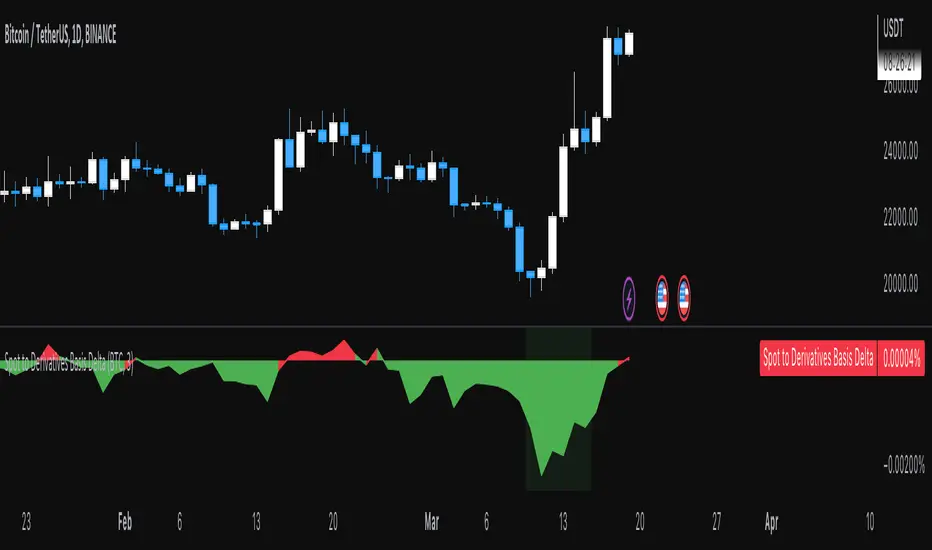
Spot VS Derivatives (BTC)This indicator shows you the difference between the price on the spot exchanges and the derivatives exchanges. When the ratio spikes upward, it is a good buying opportunity, and when it spikes downward, it is a good moment to sell. The best timeframe for this indicator is 4h. The calculation includes top 10 spot and derivatives exchanges by volume .
Spot & Derivatives BasisThis indicator allows you to track the basis between Spot and Futures trading.
This metric is great for showing when sellers have run out.
Exchanges:
Coinbase
Binance
Bitfinex
Okex
Bybit
Bitmex
Binance Futures
Okex Futures
FTX
Bitmex BTC Perpetual PremiumThis script tracks the premium of the Bitcoin Perpetual futures at Bimex exchange relative to 3 different reference prices.
The difference between this script and already published scripts is that it tracks the premium relative to 3 different reference prices. This tends to produce slightly different results.
This script is also open source, so you can verify the calculations, or use it as a basis for your own script.
The 3 plots uses the following reference prices:
Blue Area:
Bitmex Index price, ticker: BITMEX:XBT
Red line:
Bitmex Perpetual Premium, ticker XBTUSDPI
(This one is not used as reference, but simply plots the ticker*100)
Orange line:
The reference here is a price calculated by the tickers in trading view based on the Bitmex indices with weighing as follows:
Bitstamp:28,81%
Bittrex:5,5%
Coinbase: 38,07%
Gemini: 7,34%
Kraken: 20,28
Please note that Bitmex changes the bases of its indices regularly. Bitmex might also "rule out" on of these exchanges if there is a short term problem.

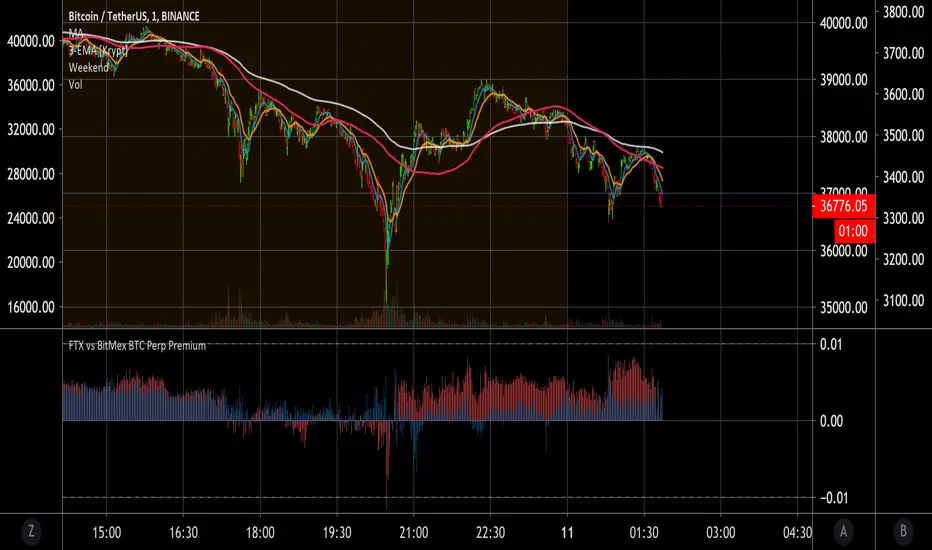
FTX vs BitMex BTC Perp PremiumThis script compares FTX BTC/PERP (BTC perpetual futures contract) price to Binance BTC/USDT spot and colors it red. It also plots Bitmex's BTC perpetual futures compared to Binance spot and colors it blue.
FTX = red
Bitmex = blue
Now you can easily see that you can get a 1% discount on FTX perpetuals when it is tanking. This tells you that you can set your limit buy orders extra low if you like to catch crashes. Also, you can see what your average trader on each platform is willing to pay above or below the spot premium. In general you want to do the opposite of what the average trading is doing on these exchanges unless you're in the main bull or mania phase of the Bitcoin cycle.
If you want to use Bitstamp or your favorite exchange it can be changed in the settings. Let me know if you find any settings that work well for you.
May you profit and enjoy! :)
Weighted derivatives premium BTCCan be extended with more derivative or spot pairs, see the comments in the code for instructions. Most importantly, the pairs need to be added to the respective arrays in the same order, so that the weights are applied to the correct pairs.

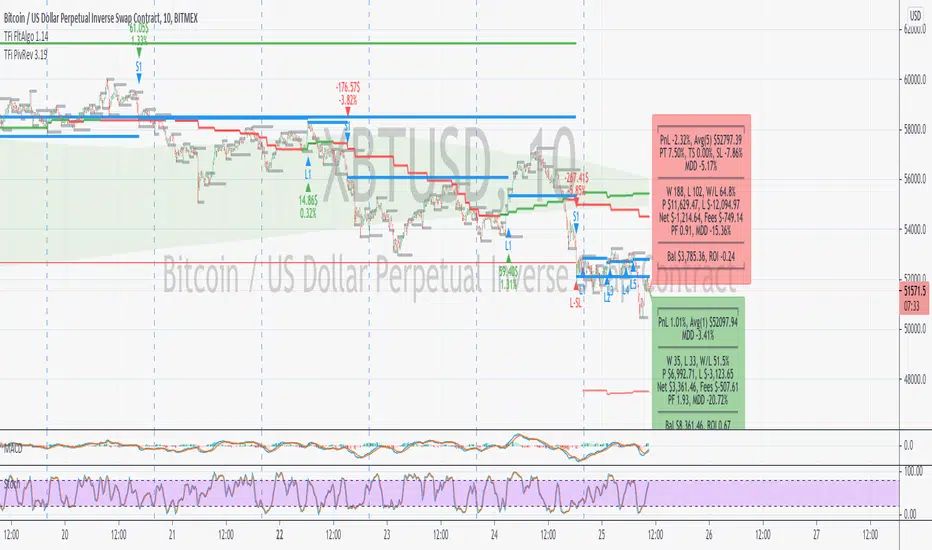
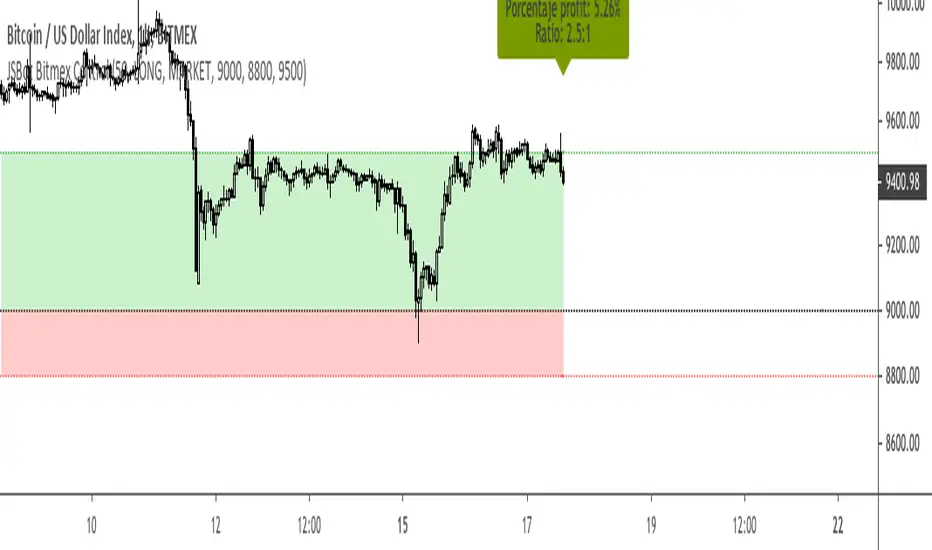
TFi Pivot Reversal V3The Pivot Reversal Study uses pivot points to create a support and resistance level; based on this levels the script creates virtual stop-market orders to catch the trend if the price is crossing the pivot lines.
A "Pyramiding" input allows to configure up to 3 entries; the script enters an additional position if the price falls by a configurable percentage amount (long), the reverse to short orders.
A configurable profit-target and stop-loss is being used to exit an open position.
An optional Moving Average filter can be used to enable only long or short positions.
The script renders a status box at the last bar, which shows the current position status and result of the built-in trading simulation results.
It shows the following statistic values:
current position PnL - also background turns green if position is in profit and red if in loss
the percentage distance to the profit-target and stop-loss level
the overall number of wins and losses and the win/loss ratio
the overall profit and loss amount (assuming a quantity of 1)
the net-profit and profit-ratio
For the correct simulation of entry/exit prices, the script contains inputs for a percentage entry and exit slippage.
The study also creates configurable alerts, which follow the exact position of the entry/exit markers. The default alert messages contain trading instruction to execute orders via Alertatron; but the message content can be replaced if configuring the alert in the Tradingview environment.
The script was mainly backtested with crypto-coins, e.g. XBTUSD at 15min timeframe. But the script also works with any other type of security and timeframe.
How to access
This strategy is a "Invite Only" script. You can can subscribe or purchase the strategy; please use the link below or send me a message via Tradingview to obtain access to the strategy and study script.
For enabling the script in your Tradingview chart window, click on "Indicators" and select "Invite-Only Scripts".
Full list of alerts
'Alertatron Exit' ... Exit all open positions.
'Alertatron Enter Long' ... Enter long position, w/o stop-loss being used.
'Alertatron Enter Short' ... Enter short position, w/o stop-loss being used.
'Alertatron Enter Long SL' ... Enter long position, w/ stop-loss being used.
'Alertatron Enter Short SL' ... Enter short position, w/ stop-loss being used.
Full list of parameters
"Pivot Left Bars" ... Number of bars on the left of the pivot point - used for pivot /peak detection.
"Pivot Right Bars" ... Number of bars on the right of the pivot point - used for pivot /peak detection.
"MA Filter Fast" ... Moving Average filter fast period.
"MA Filter Slow" ... Moving Average filter slow period.
"Profit Target Option" ... Configure the profit-target either as a fix percentage value or an ATR.
"Profit Target " ... Fix percentage profit-target.
"Profit ATR Period" ... ATR profit-target period.
"Profit ATR Factor" ... ATR profit-target factor/multiplier.
"Stop Loss Option" ... Configure the stop-loss either as a fix percentage value or disable the stop-loss completely.
"Stop Loss " ... Fix percentage stop-loss.
"Rebuy Loss " ... Percentage loss of the initial position before script enter a nw position in the same direction.
"Pyramiding" ... Maximum number of positions.
"Show MA Plots" ... Show/hide Moving average plots.
"Slippage Entry " ... Percentage slippage for entering a position.
"Slippage Exit " ... Percentage slippage for exiting a position.
"Statistic Label" ... Defines the position of the statistic label relatively to the last bar in the chart.
"Backtest Start" ... Backtest start time; area outside this timeframe will be grayed out.
"Backtest Stop" ... Backtest stop time; area outside this timeframe will be grayed out.
"Backtest Mode" ... Closes the currently opened position if chart switches to last bar; please only enable if backtesting, otherwise it leads to unwanted alerts.
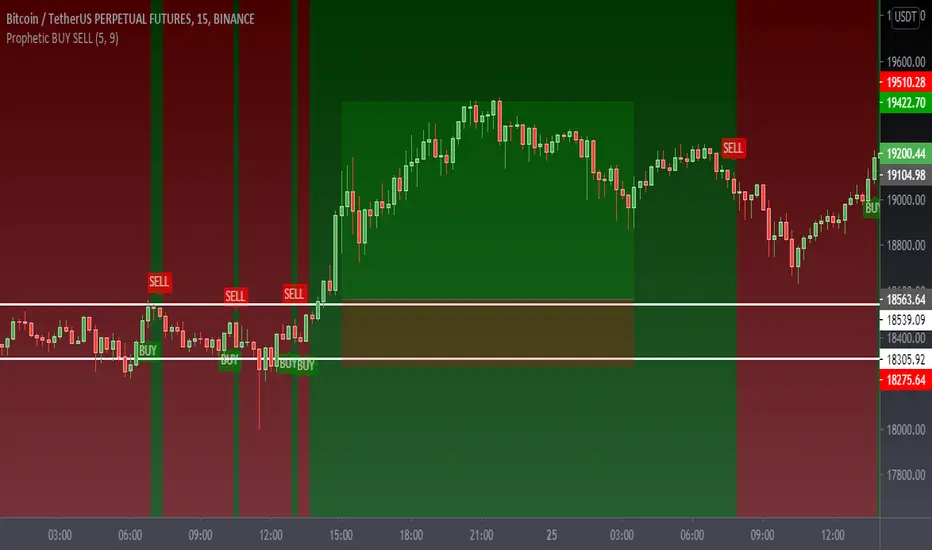
Prophetic BUY SELL IndicatorThis premium indicator will help you to do quick scalping on Cryptocurrencies, Forex, and Stocks.
This indicator is very simple to understand.
Green BUY Alert - Buy Signal Market is up
Red SELL Alert - Sell Signal Market is down
Caution:- Do not use it during market being choppy or sideways
Once the BUY signal appears the background changes green and same with SELL it turns red
can change the color according to requirements
It also has a moving average which also changes the color as the candles close above the MA or the below Default color are green and red
Please Like Share and Follow and if required please contact:- @mobudd (TELEGRAM)
or Ping me on trading view
Guys, It takes effort so please do not ask for free access.
You're always welcome to share any type of suggestion & feedback.
cosmic scalperCosmic Scalper is an intuitive & exotic trading engine, designed to Identify Trend, visually highlight our “Zone of Interest” & plot entry lines at its base, like a barcode, providing critical information to the trader’s mind in a clean, elegant way without cluttering the chart.
Components Of Script :
1. Trend Support Cloud : Based on Fibonacci ratio, the cloud has 3 layers or bands.
2. Entry Engine : The last band of the cloud gets highlighted when we enter “Zone of Interest” & vertical lines appear indicating possible entry points. Together this forms a trend fingerprint.
Mechanism Of Action :
1. Identify trend : The script observers multiple parameters on higher timeframes to identify trend & plots the fibonacci based 3 layer trend support cloud. The script will indicate a change of trend when the last band is breached & sustained.
2. Zone Of Interest : Once a trend is identified, we are looking for entries. But we wait for the other side to get exhausted first. When exhaustion is identified, the last band of the cloud gets highlighted. This “exhaustion” is measured using bespoke datasets created within the protocol. Conventional datasets like RSI, VWAP, MACD etc are only used as secondary or tertiary layer of information.
3. Entries : Once we have entered the highlighted ‘Zone of Interest’ the script will offer entry points represented by vertical lines in the last band, this Highlight + Vertical Lines together forms the trend fingerprint, giving traders crucial visual information to make informed decisions.
How to use :
1. Make a Higher Timeframe Analysis, 4hr, 6hr or Daily timeframe. Use TA or Bollinger Bands.
2. Once you have an informed bias, switch to the Cosmic Scalper on 1min timeframe to take position.
3. Target, Stop, Leverage : at user discretion
Have Questions? Feel free to PM me on TradingView

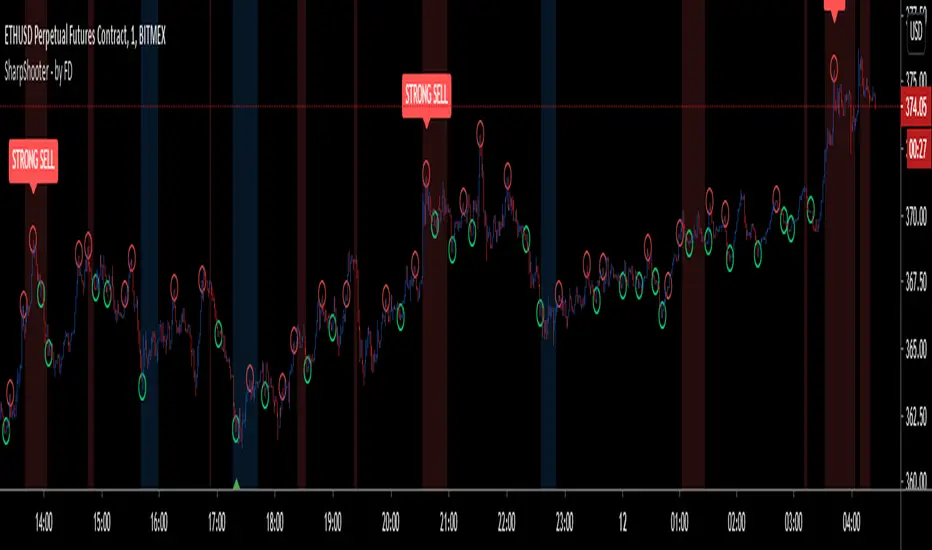
Sharp Shooter - by FiatDropoutThis is an experimental script and is intended to be used only on LTF charts for scalping. It may or may not be useful on other charts and time frame, but that is subject to back testing.
Now, coming back to this script. It has multiple features yet i tried to keep it as clean in representation as possible.
As obvious, few things are easily recognizable on chart, such as:
BUY - Go LONG
STRONG BUY - Heavy Uptrend is expected, Go LONG
SELL - Go SHORT
STRONG SHORT - Heavy Downtrend is expected, Go SHORT.
on addition to above signals, there are few other plot-shapes, which are:
Red Circle - Acts as TP for LONG during uptrend and acts as Add-On SHORT during downtrend
Green Circle - Acts as TP for SHORT during downtrend and acts as Add-on LONG during uptrend.
Red Background - Bearish Peak, potential start of downtrend
Blue Background - Bullish Peak, potential start of uptrend
------------------------------------------------------------------------------------------------------------------------------------------------------------------------------------
Now that plots are over, lets go to how to use them. As name of this script suggests, it intends to find most optimal entry and exit for long and short while taking profit on the way and adding to the position until trend changes.
Be aware that trend here is very much based on current time-frame and does not represent other time-frame's bias. Also, trend here is intended to be used as a scalp trend and not a swing trend.
Now once, you get a signal for BUY(example), then wait for "Bullish Peak"(blue background) to appear with either "STRONG BUY" or just "BUY" and take an entry at respective price, next look for "red circle" which acts as TP for long(refer sec, above) and either move stop to entry, or take partial profits or close position entirely.
Now every subsequent "green circle" will act as add-on for long and every "red circle" will act as TP for long, until "Bearish Peak" appears, which will reverse the order of how circles are used and direction of the trade. Now during "Bearish Peak" and until "Bullish Peak" appears, "red circle" will act as add-on for short and "green circle" will act as TP for short.
It might take some time to adjust to the plots, but i have decided to keep it that way in order to keep chart clean of too many signals.
------------------------------------------------------------------------------------------------------------------------------------------------------------------------------------
NOTE : Please use stops and be sure to place orders quickly as prices move faster on minute charts and you should be able to place orders and stop right away, so if you are new to trading and are currently in early stage of the business, scalping is strongly not advised, let alone this indicator. Also, past performance are not guarantee of future results and most importantly, this indicator does not repaint. By using this indicator, you accept that i am not responsible for any losses or gains made by user by trading with help of this bot.
Also, in next update, i will fix some bug, add some SS and also add alerts. Alerts are not being added currently because of high volatile nature of the bot signals which if tried on automation can give varied results. Once everything is set, i shall add alerts.
for any other queries, feel free to get back here on chat or DM.
RSI + MFI - Crypto Bull and Bear market A fancy styled version of the RSI (Relative Stochastic Index) + MFI (Money Flow Index) oscillators in order to emphasize buy and sell opportunities.
The 80 and 20 Bands are meant to be used in Bull or Bear markets. Better performing in D timeframes.
The circles represent the cross between RSI and MFI .
Designed for Crypto Markets
Thanks @micheleprandina
Credits:

BITMEX TOOL - open/close positions in BITMEX - JSBOTBitmex tool with risk management
- Open positions in Bitmex from tradingview by alerts
- Set order quantity(bitmex account’s percentage), entry P rice, stoploss, takeprofit, trade direction and type order
- The entry price and the stoploss are in the same alert, if you want only open a position without a stoploss you should set it in zero (0)
- Take profit is optional so is in other alert
- If you chose Limit, when the alert is triggered an order will placed at $5 below the entry price in longs positions or $5 above the entry price in short positions (the same with the take profit)
- This indicator works with JSBOT (jsbot.online)
If you need more flexibility use the JSBOTs commands to set any indicator as you want
KINSKI RSI Short/LongExtends the display of the Relative Strength Index (RSI) by shorts and longs from Bitmex and shows them as a diagram.
How to interpret the display?
- blue line is the default Relative Strength Index
- red line means "oversold
- green line "overbought"
- grey dotted line up/down indicates the optimal range for up and down movements 30 to 70
- in general, the reaching or crossing of the thresholds in the direction of the mid-range is seen as a possible buy or sell signal
- RSI values (blue line) of over 70 percent are considered "overbought", values below 30 percent "oversold
Which settings can be made?
- Selection for the "Currency". Default value is "BTCUSD". Currently only the following currencies are supported "BTCUSD", "ETHUSD", "ETCUSD", "OMGUSD", "XLMUSD", "XTZUSD".
- Selection for calculation formula ("Calculation"). The default value is "hlc3".
- Field for the moving average value ("RSI Length"). The default value is 14, but values of 7, 9 or 25 are also common. The shorter the period under consideration, the more volatile the indicator is, but with longer periods, fewer signals are triggered.
- furthermore you can make layout adjustments via the "Style" menu

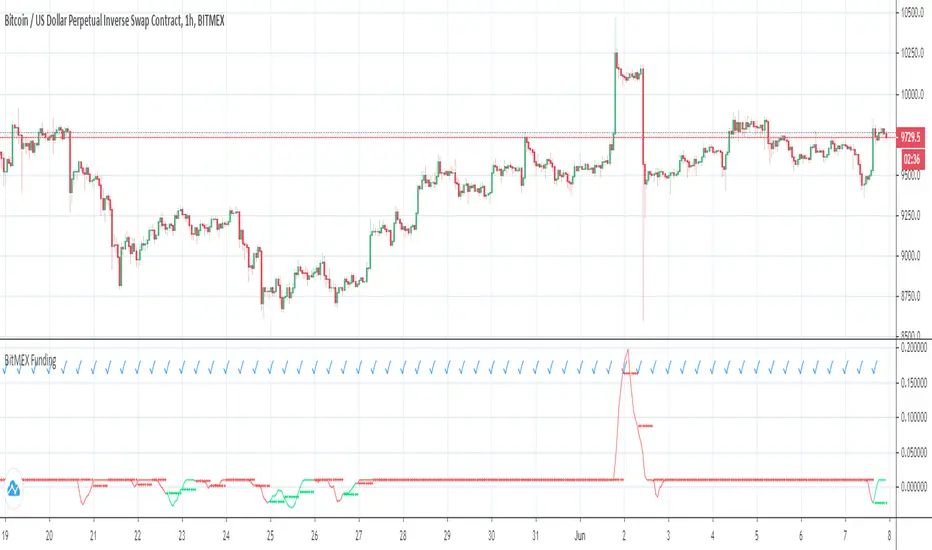
BitMEX Funding Rate CalculationThis script implements the full funding rate formulas found on the BitMEX site for XBTUSD, ETHUSD, and XRPUSD. It uses the 1-min premium and interest tickers found here on TradingView to calculate an 8-hour TWAP, then uses base initial and maintenance margins to apply caps on absolute rate and delta from prior value. Caps are applicable only to position sizes below 200 XBT. When chart history exceeds the available history of 1min date on TradingView, the indicator switches to 1hr data to provide estimates.
Outputs:
Either a check (using 1min data) or a question mark (using 1hr data) upon each new funding period.
Current funding rate, every 8 hours.
Current funding prediction for the next funding period.
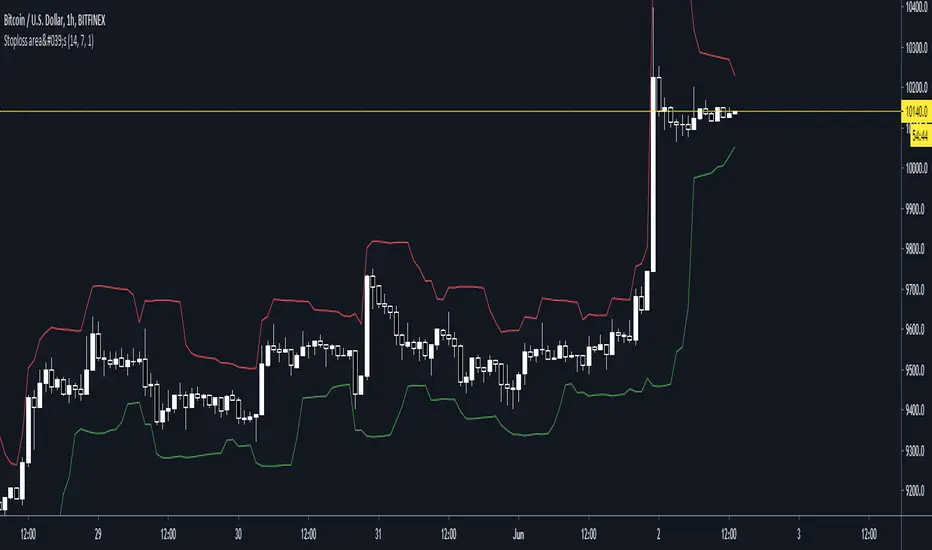
Stoploss indicatorGood for setting trailing stops and stoplosses when your taking a scalp etc, most recommended for manual trailing stops
Simple EMA trend indicatorSimple EMA trend indicator , pretty straightforward green equates to bullish and usually a retest/wick is often seen , same for the flipside viceversa

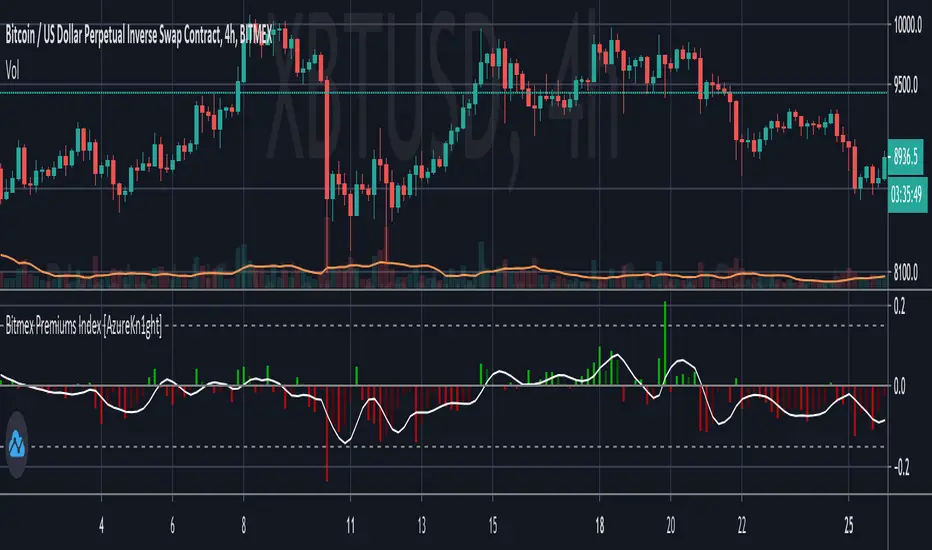
Bitmex Premiums Index Histogram [AzureKn1ght]This my version of the Bitmex Premiums Index indicator.
It is based on the actual index, so it is a bit more accurate than the other scripts out there.
Comes with customizable alerts for Overbought and Oversold zones.
Enjoy. :)
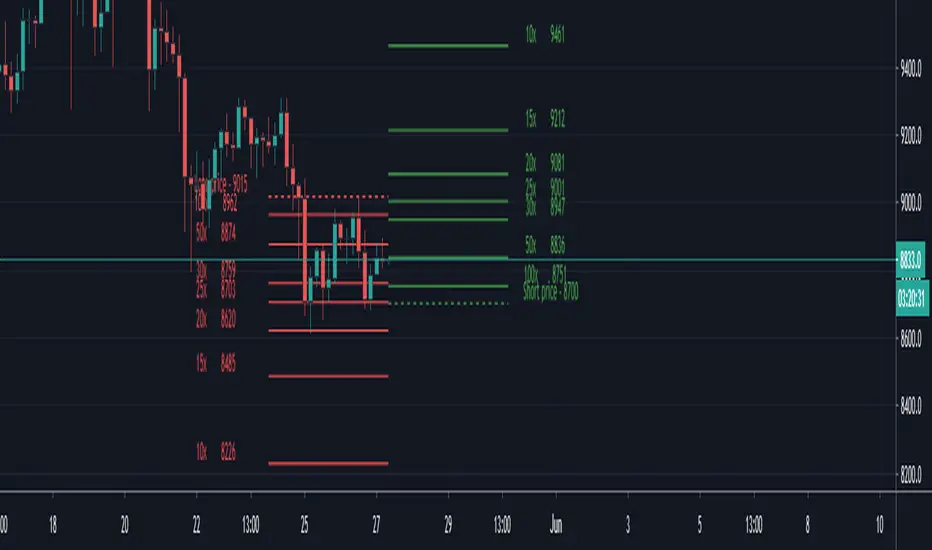
BITMEX LIQUIDATION LEVELSThis is a BITMEX exchange liquidation levels with different leverages.
Calculations are made by Bitmex calculator.
Included leverage levels 1, 2, 3, 5, 10, 15, 20, 25, 30, 50 and 100x
By default indicator calculates levels from current price.
To input your own price unchek "Auto or manual" checkbox and input your price data.
----------------------------------------------------------------------------------------------------------------
Данный индикатор считает уровни ликвидации на бирже BITMEX с разными плечами.
Вычисления сделаны по калькулятору биржи BITMEX.
Внесенные уровни по плечам: 1, 2, 3, 5, 10, 15, 20, 25, 30, 50 и 100х
По умолчанию индикатор считает уровни от текущей цены.
Для ручного расчета снимите галочку с "Auto or manual" и внесите свои данные.
Bitmex Premiums RSIPlot the BITMEX:XBT - COINBASE:BTCUSD premiums spread as a RSI.
Can be used to see if futures are skewed towards backwardation/contango extremes.

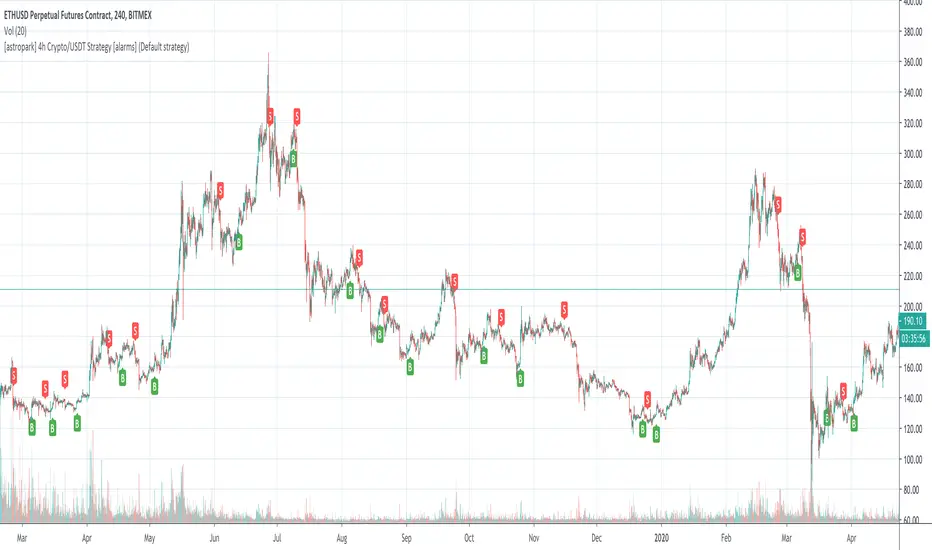
[astropark] 4h Crypto/USDT Strategy [alarms]Dear Followers,
today a new Swing and Scalper Tool , which works great for Cryptocurrencies on the USDT market on 4h timeframe .
This tool has some cool features:
it works on many timeframes, but best one is 4H timeframe : so you can enjoy both manual and bot trading by using a 24/7 running bot;
it comes in three working mode : default, alternative and high frequency ;
auto-stoploss: you can enable an stoploss in trade, bot will follow
It's always suggested to use a proper money and risk management in trades. This is not the "Holy Grail", it does not exist.
Strategy results are calculated from the beginning of 2018 till now, so more than 2 years, using 10000$ as initial capital and working at 1x leverage (no leverage at all!) and 0.1% trading fee already applied.
You can always DM me if you need any help to configure it on your preferred chart or if you want a customization of this bot for a specific pair.
This script will let you set all notification alerts you may need in order to be alerted on each triggered signals.
The one for backtesting purpose can be found by searching for the astropark's "4h Crypto/USDT Strategy" and then choosing the indicator with "strategy" suffix in the name, or you can find here below
This is a premium indicator , so send me a private message in order to get access to this script.