BTC Cycle Halving Thirds NicoThe bold black vertical lines are the INDEX:BTCUSD halvings.
The background speak for itself.
Time to be bearish?
Bitcoinlong

Quantoshi Global Liquidity StrategyThis strategy leverages global liquidity data alongside technical indicators like the Rate of Change (ROC) and Double Exponential Moving Average (DEMA) to identify optimal long-entry points during major market trends. The script is designed to capture long-term, sustained momentum and includes built-in risk management by filtering out rapid price spikes. It is best suited for swing trading or long-term trend trading.
Key Features:
Global Liquidity Data:
The strategy incorporates data from major global central banks and M2 money supply to calculate a comprehensive liquidity index, which is a critical component for long-term trend detection.
ROC-DEMA Crossover:
It combines the Rate of Change (ROC) and a 100-period Double Exponential Moving Average (DEMA) to identify momentum shifts. Long entries are triggered when these indicators confirm an upward trend.
Price Thresholds:
The strategy compares the current price to the price from several candles ago to ensure positions are not entered during unsustainable price surges.
Custom Alerts:
Automated alerts for long entries and exits allow users to automate their trades or receive timely notifications when market conditions are met.
How It Works:
The strategy enters long positions when ROC and DEMA signals confirm a positive trend, and the price conditions suggest a sustainable upward momentum. Long exits occur when the momentum reverses, with a clear crossover signal of ROC below DEMA. Custom alert messages make it ideal for automated trading setups.
Why It's Unique:
This strategy combines liquidity data with technical indicators to filter noise and focus on significant market shifts. It allows traders to capture major trend reversals without needing to actively monitor the charts, making it useful for those focused on swing or long-term trading.
Backtesting & Risk Management:
Given its long-term focus, this strategy generates only a few signals per decade when used on a weekly timescale. As a result, traditional backtesting show few trades, but historical analysis reveals its effectiveness in capturing major market movements.
Account Size:
The backtest is based on a $1,000 account size to represent a realistic trading scenario.
Commissions & Tick size: Commission fees of 0.1% and a tick size of 100 are applied to reflect real-world trading conditions.
Trade Size:
Risk per trade is limited to 5% of the account balance to align with sound risk management practices.

Bullish Divergence Short-term Long Trade FinderThis script is a Bullish divergence trade finder built to find small periods where Bitcoin will likely rise from. It looks for bullish divergence followed by a higher low as long as the hour RSI value is below the 40 mark, if then it will enter an long. It marks out Buy signals on the RSI if the value dips below 'RSI Bull Condition Minimum' (Default 40) on the current time frame in view. It also marks out Sell signals found when the RSI is above the 'RSI Bearish Condition Minimum' (Default 50). The sell signals are bearish divergence that has occurred recently on the RSI. When a long is in play it will sell if it finds bearish divergence or the time frame in view reaches RSI value higher than the 'RSI Sell Value'(Default 75). You can set your stop loss value with the 'Stop loss Percentage' (default 5).
Available inputs:
RSI Period: relative strength measurement length(Typically 14)
RSI Oversold Level: the bottom bar of the RSI (Typically 30)
RSI Overbought Level: the top bar of the RSI (Typically 70)
RSI Bearish Condition Minimum: The minimum value the script will use to look for a pivot high that starts the Bearish condition to Sell (Default 50)
RSI Bearish Condition Sell Min: the minimum value the script will accept a bearish condition (Default 60)
RSI Bull Condition Minimum: the minimum value it will consider a pivot low value in the RSI to find a divergence buy (Default 40)
Look Back this many candles: the amount of candles thee script will look back to find a low value in the RSI (Default 25)
RSI Sell Value: The RSI value of the exit condition for a long when value is reached (Default 75)
Stop loss Percentage: Percentage value for amount to lose (Default 5)
The formula to enter a long is stated below:
If price finds a lower low and there is a higher low found following a lower low and price has just made another dip and price closes lower than the last divergence and Relative strength index hour value is less than 40 enter a long.
The formula to exit a long is stated below:
If the value drops below the stop loss percentage OR (the RSI value is greater than the value of the parameter 'RSI Sell Value' or bearish divergence is found greater than the parameter 'RSI Bearish Condition Minimum' )
This script was built from much strategy testing on BTC but works with alts (occasionally) also. It is most successful to my knowledge using the 15 min and 7 min time frames with default values. Hope it helps! Follow for further possible updates to this script or other entry or exit strategies.
snapshot:
I only have a Pro trading view account so I cannot share a larger data set about this script because the buy signals happen pretty rarely. The most amount that I could find within a view for me was 40 trades within a viewable time. The suggested/default parameters that I have do not occur very often so it limits the data set. Adjustments can be made to the parameters so that trades can be entered more often. The scripts success is dependent on the values of the parameters set by the user. This script was written to be used for BTC/USD or BTC/USDT trading. I am unable to share a larger dataset without putting out results that are intended to fail or having a premium account so reaching the 100 trade minimum is not possible with my account.

Quantitative Trend Strategy- Uptrend longTrend Strategy #1
Indicators:
1. SMA
2. Pivot high/low functions derived from SMA
3. Step lines to plot support and resistance based on the pivot points
4. If the close is over the resistance line, green arrows plot above, and vice versa for red arrows below support.
Strategy:
1. Long Only
2. Mutable 2% TP/1.5% SL
3. 0.01% commission
4. When the close is greater than the pivot point of the sma pivot high, and the close is greater than the resistance step line, a long position is opened.
*At times, the 2% take profit may not trigger IF; the conditions for reentry are met at the time of candle closure + no exit conditions have been triggered.
5. If the position is in the green and the support step line crosses over the resistance step line, positions are exited.
How to use it and what makes it unique:
Use this strategy to trade an up-trending market using a simple moving average to determine the trend. This strategy is meant to capture a good risk/reward in a bullish market while staying active in an appropriate fashion. This strategy is unique due to it's inclusion of the step line function with statistics derived from myself.
This description tells the indicators combined to create a new strategy, with commissions and take profit/stop loss conditions included, and the process of strategy execution with a description on how to use it. If you have any questions feel free to PM me and boost if you enjoyed it. Thank you, pineUSERS!

twisted SMA strategy [4h] Hello
I would like to introduce a very simple strategy that uses a combination of 3 simple moving averages ( SMA 4 , SMA 9 , SMA 18 )
this is a classic combination showing the most probable trend directions
Crosses were marked on the basis of the color of the candles (bulish cross - blue / bearish cross - maroon)
ma 100 was used to determine the main trend, which is one of the most popular 4-hour candles
We define main trend while price crosses SMA100 ( for bullish trend I use green candle color )
The long position strategy was created in combination of 3 moving averages with Kaufman's adaptive moving average by alexgrover
The strategy is very accurate and is easy to use indicators
the strategy uses only Buy (Long) signals in a combination of crossovers of the SMA 4, SMA 9, SMA 18 and the Kaufman Adaptive Moving Average.
As a signal to close a long position, only the opposite signal of the intersection of 3 different moving averages is used
the current strategy is recommended for higher time zones (4h +) due to the strength of the closing candles, which translates into signal strength
works fascinatingly well for long-term bullish market assets (for example 4h Apple, Tesla charts)
Enjoy and trade safe ;)

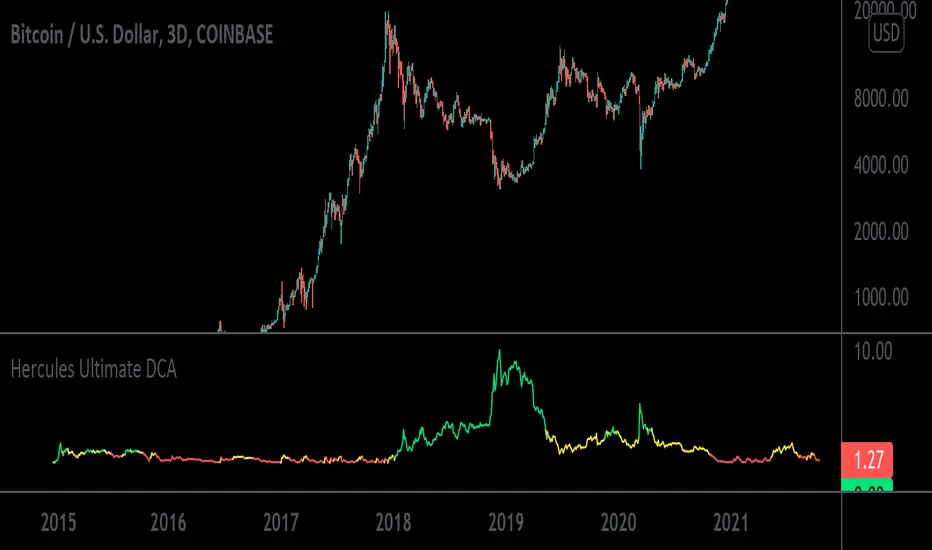
Hercules Ultimate DCA™The Problem Most People Face When Trading & Investing:
If anyone tells you they know where the market is going, they’re either lying or they’re time travelers.
The truth is NOBODY knows whether the markets will move up or down tomorrow, next week, next year, or over any period of time.
If we all knew, we’d all be rich. What would suit most Investors is to Invest consistently over long periods of time into sound financial products.
When Creating This Investing Tool We Had 5 Requirements in Mind:
1. To create a tool that ANYONE with little to no experience could use to outperform 95% of traders and speculators.
2. To ignore the Charts, Candlesticks, Indicators, and Volatility in any market so you can rest easy at night, never having to look at the price of your asset and still remain profitable.
3. To create a tool that tells you exactly HOW MUCH to invest every day or week which takes the stress away in guessing which direction the market will go.
3. To minimize your risk and and exposure to downside even if you started buying a crypto at or near the top of a market.
4. To buy a crypto at or near the bottom of every single major swing or trend.
5. To make Investing Easy, Simple, and Fun for the average joe.
We achieved that goal with the Hercules Ultimate DCA™ Tool!
WHO Created it & HOW was it Created?
This tool uses complex math and an algorithm designed by a Quantitative Military Mathematician (who wishes to remain anonymous, so we’ll call him Satoshi) over a period of 5 and a half months.
To start, we wanted to keep things simple, and extensively researched 6 of the top investing strategies of all time:
1. Buy and Hold
2. Active Investing
3. Dollar Cost Averaging
4. Index Investing
5. Growth Investing
6. Value Investing
Most of the strategies above work well depending on your goals or how risk adverse you are, however most DO NOT check off all of the requirements we mentioned above. Comprehensive home-work and price-action history in Cryptocurrency Markets led us to the Dollar Cost Averaging (DCA) Strategy.
According to Fidelity,
“Dollar Cost Averaging is a strategy where you invest your money in equal portions, at regular intervals, regardless of which direction the market or a particular investment is going. In other words, your purchases occur regardless of the changes in price for the stock or other investment, potentially helping reduce the impact of volatility on the overall purchase.”
With this in mind our High IQ math friend got to work and formulated over 17 Different Variable Algorithms on the DCA Strategy before arriving to the one we named Hercules Ultimate DCA™.
WHY the Hercules Ultimate DCA™ Works BETTER Than Anything Else.
Rigorous backtesting & forward-testing led us to create what we believe is the most effective and efficient strategy to extract the most money from the markets while at the same time minimizing nearly all the risk when investing your hard earned money in small increments in a truly effortless way.
The Hercules Ultimate DCA™ is essentially a DCA strategy put on steroids because no two investments are alike.
As we mentioned above, a traditional DCA approach assumes you purchase the same dollar amount of any asset at scheduled times, no matter where the price of your purchased asset is.
Example: If you have $1,000 dollars and decided to invest 50 dollars per week into Bitcoin, you would invest over a period of 20 weeks before you run out of money. Now, let’s assume the price of bitcoin is 50k during your first week, you would invest $50 dollars. Then next week the price rises to 60k, you would still invest $50 Dollars. The third week, if the Price of BTC rose to 70k, you would invest $50 dollars, so on and so forth. This approach is flawed because although you would still do better than many speculators and traders over a long period of time, it essentially leaves you penniless at the end of twenty weeks with no gunpowder left to buy BTC if it drops to all-time lows.
The Hercules Ultimate DCA™ works so well because it tells you to invest less as the price goes up and far more if the prices drops. What feels counterintuitive to most investors is typically what provides the most returns. Take the example above. If you have $1,000 dollars to invest weekly and Bitcoin currently sits at 50k, you would start by investing $50 dollars. Then next week, let’s say BTC rises to 60k, you would now invest $30 dollars. And your third week, BTC reaches 70k, you would now invest $10 dollars. Not only does strategy preserve your capital but it tells you to invest less into an asset at all time highs and far more into an asset at lows.
Now obviously the math in this tool is more complex, but it’s also more cost effective. At the time of writing this, the current Crypto Market has tanked from all-time-highs. Bitcoin currently sits at a price of $32,000 and is 51% down from its high of $64,900 dollars.
Just using this tool over the last 6 years, you would have invested a total of $5758.71 dollars and accumulated 4.328 Bitcoins for an average purchase of $1330.34 dollars. Your current Portfolio value would be $138,519.77 for a whopping percentage gain total of 2305%.
In other words, even with this massive crypto dump, you’d be rolling handsomely in your profits and you’d feel pretty smart too.
What’s more unique is that the Hercules Ultimate DCA™ will ALWAYS tell you to Invest More Dollars at the Literal Bottom of ANY market.
Dips in a market you believe in are far more exciting and will provide far more returns. The only way this tool fails is if the user (you) choose a market that goes to zero or is a rugpull.
How Do You Use the The Hercules Ultimate DCA™?
Step 1: Scroll to your “Invite-Only Scripts” in your indicators tab on Tradingview, then click on the indicator titled, “Hercules Ultimate DCA.”
Step 2: You should see the Indicator Populate at the Bottom of your chart with two lines, the Green line indicating how much you should buy that day, and the Blue line indicating how much of the asset you’ve purchased.
Step 3: (If you haven’t already) Make sure you turn on the Indicator Label. Navigate to the top right of the Crypto Product you would like to purchase and you will see a small settings gear. Once open, navigate on the left-hand side to the “Scales” tab and find the “Indicator Last Value Label.” Make sure it’s turned on and you will see the direct price.
Step 4: The amount you invest will now populate on the right hand side of the indicator with a number. That’s the exact dollar amount you invest in a disciplined manner no matter how large or small the number may seem.
Step 5: Get familiar with the indicator by opening the settings on the indicator itself. You will notice on the first tab it has a multiplier. If you increase it to 2, then the indicator will tell you to invest double the amount. If you input 10, then it will tell you to invest 10x the amount.
Step 6: Choose a Chart Timeframe and time of day to invest. If you choose to go with a once weekly investment then we recommend you increase your multiplier. If you choose a daily investment (and lack the necessary capital to invest large amounts daily) then we recommend keeping your multiplier down to lower numbers incase we see a lot of volatility. For most folks, once weekly on a 10x multiplier is most convenient. Set your chart to a weekly time-frame and increase your multiplier to 10. Then each week around the same time, you must invest.
Step 7: STAY DISCIPLINED. This method and tool only works if you invest the exact amount it tells you to invest over sustained periods of time.
Step 8: Enjoy Investing Made Easy 🙂
Bitcoin Leveraged Movement, 3 different short/long views3 different views for bitcoin short/longs. the main view allows you to see changes from one bar to the next.
