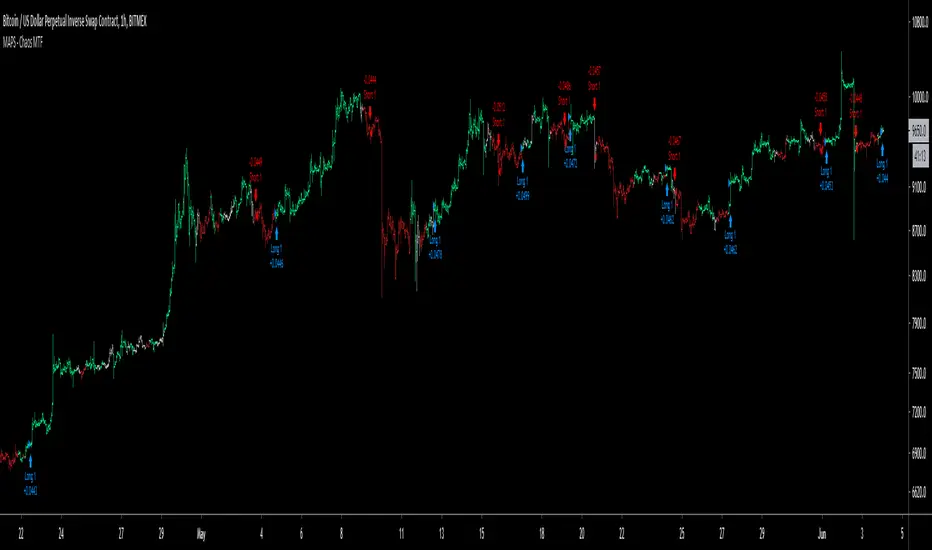
MAPS - Chaos MTFSearches for a probable trend and sets a position. Ideally, we'd set a stop loss at an opposite fractal two positions away from the entry.
Use the link below to obtain access to this indicator
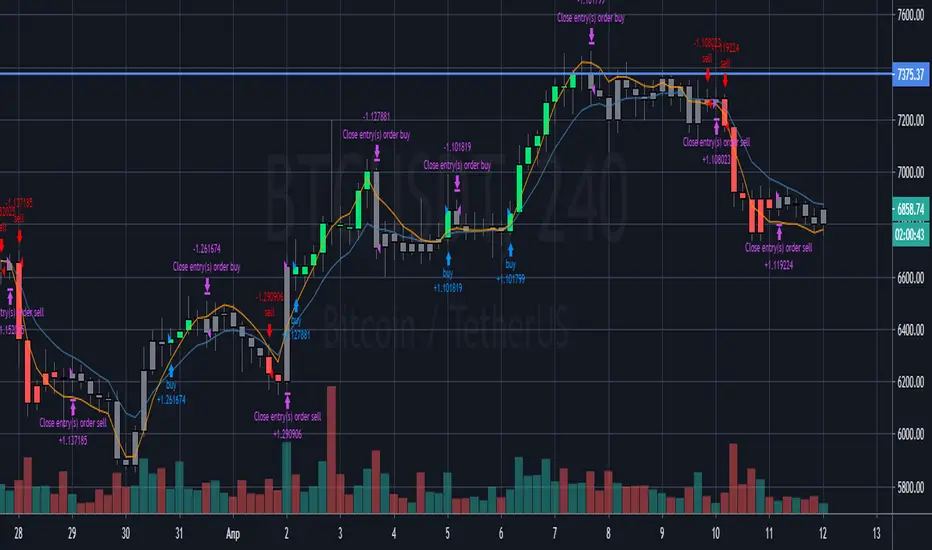
Bitcoin (Kriptopara)
EMA Slope Trend Follower StrategyThis strategy is based on the slope of the EMA130.
Over that slope, the script calculates two EMAs (9,21) which are used to generate the main entry and exit signal.
In particular, the strategy enters a LONG position when EMA9 > EMA21. On the contrary, it closes the LONG and opens a SHORT when EMA9 < EMA21.
When the slope of the EMA130 is rising, it means that the price is accelerating upwards, fueling an uptrend. Conversely, when the slope is falling, it means that the price is slowing down, falling into a possible downtrend.
Calculating and analyzing two EMAs (fast and slow) over the slope of a medium length EMA instead of the price anticipates a lot the signal. In this way, the strategy never miss a trend.
In order to minimize false positives (entering useless positions), I included two filters, which can be optionally turned on:
- Trend Filter: When the price is above EMA200, the strategy opens ONLY LONG positions. If price < EMA200, only shorts allowed. If the slope gives a long signal and price is below EMA200, for example, the eventual SHORT position is closed, but the LONG entry is postponed to the moment when both conditions (slope uptrending and price > ema200) are met.
I recommend always turning on this filter, as it dramatically decreases drawdown.
- Volatility Filter: When the standard deviation of the last 20 candles is below its 50 samples moving average, no positions are opened, as market is going sideways. The purpose of this filter is to prevent false positives (positions which open and close in a matter of candles due to false signals in sideways market).
I recommend turning on this filter only on low time frames.
This strategy works great on medium time frames (like 4h, 6h, daily), since it spends way less in fees, opening less positions.
It works good on low TFs too (up to 1h, didn't test lower ones), provided Volatility filter is turned on and parameters are set according to the asset.
Commission included in calculations: 0.06% (it's the taker commission on BitMEX with the 10% discount obtainable with any referral link)
Slippage included in calculations: 2 ticks (BitMEX has very liquid order books, and slippage doesn't happen very often unless a huge position size is used).

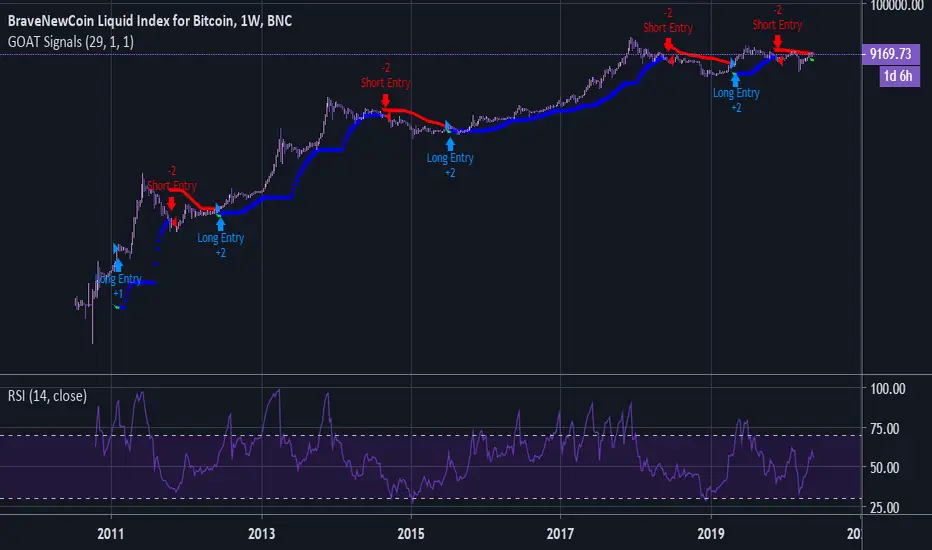
GOAT Signals Custom No Repaint Buy Sell Arrow Strategy Tester
WELCOME to GOAT Signals Custom No Repaint Buy Sell Moving Average (MA) Strategy Tester!
This indicator can quickly and easily identify the past trading success of signals based on moving averages.
What is a Moving Average?
According to investopedia.com a moving average (MA) is a widely used indicator in technical analysis that helps smooth out price action by filtering out the “noise” from random short-term price fluctuations.
Keeping this in mind let me give an example how this indicator could be useful in identifying trends.
Many Bitcoin traders use the 21 moving average on the weekly chart to make trading decisions.
Some of this has to do with 21 being a Fibonacci sequence number, and also because of how Bitcoin price action has reacted to it's trend line in the past.
When applying this script to the Bitcoin(BLX) weekly chart with a 21 moving average the strategy tester gives us 33.33 % Percent Profitable results with 6.31 % Net Profit.
If we test another moving average, let's try 29, and change our step input to 1, we get 85.71 % Percent Profitable with 9.22 % Net Profit.
With a bit of tweaking we may be able to find charts and settings with even better performance.
Keep in mind the strategy tester does not calculate trading fees, therefore in most cases will work better on longer time frames.
The Step input gives price action some breathing space if desired. Steps can be added or subtracted.
Personally, I use the Daily and Weekly charts except during high volatility, and use a one or two bar trail depending on price action.
Past performance does NOT guarantee future gains but keep in mind Bitcoin, Litecoin and a few others are on deflationary cycles.
For full invite only access please contact DogeyBlaze.
Alert Script And Limited Time Free Trial Available.
Not Certified Financial Advice.
BTC and ETH Long strategy - version 1I will start with a small introduction about myself. I'm now trading cryto currencies manually for almost 2 years. I decided to start after watching a documentary on the TV showing people who made big money during the Bitcoin pump which happened at the end of 2017.
The next day, I asked myself "Why should I not give it a try and learn how to trade".
This was in February 2018 and the price of Bitcoin was around 11500USD.
I didn't know how to trade. In fact, I didn't know the trading industry at all.
So, my first step into trading was to open an account with a broken. Then I directly bought 200$ worst of BTC . At that time, I saw the graph and thought "This can only go back in the upward direction!" :)
I didn't know anything about Stop loss, Take profit and Risk management.
Today, almost 2 years after, I think that I know how to trade and can also confirm that I still hold this bag of 200$ of bitcoin from 2018 :)
I did spend the 2 last years to learn technical analysis , risk management and leverage trading.
Today (14/05/2020), I know what I'm doing and I'm happy to see that the 2 last years have been positive in terms of gains. Of course, I did not make crazy money with my saving but at least I made more than if I would have kept it in my bank account.
Even if I like trading, I have a full time job which requires my full energy and lots of focus, so, the biggest problem I had is that I didn't have enough time to look at the charts.
Also, I realized that sometimes, neither technical analysis , nor fundamentals worked with crypto currency (at least for short time trading). So, as I have a developer background I decided to try to have a look at algo trading.
The goal for me was neither to make complex algos nor to beat the market but just to automate my trading with simple bot catching the big waves.
I then started to take a look at TV pine script and played with it.
I did my first LONG script in February 2020 to Long the BTC Market. It has some limitations but works well enough for me for the time being. Even if the real trades will bring me half of what the back testing shows, this will still be a lot more than what I was used to win during the last 2 years with my manual trading.
So, here we are! Below you will find some details about my first LONG script. I'm happy to share it with you.
Feel free to play with it, give your comments and bring improvements to it.
But please note that it only works fine with the candle size and crypto pair that I have mentioned below. If you use other settings this algo might loose money!
- Crypto pairs : XBTUSD and ETHXBT
- Candle size: 2 Hours
- Indicator used: Volatility , MACD (12, 26, 7), SMA (100), SMA (200), EMA (20)
- Default StopLoss: -1.5%
- Entry in position if: Volatility < 2%
AND MACD moving up
AND AME (20) moving up
AND SMA (100) moving up
AND SMA (200) moving up
AND EMA (20) > SAM (100)
AND SMA (100) > SMA (200)
- Exit the postion if: Stoploss is reached
OR EMA (20) crossUnder SMA (100)
Here is a summary of the results for this script:
XBTUSD : 01/01/2019 --> 14/05/2020 = +107%
ETHXBT : 01/01/2019 --> 14/05/2020 = +39%
ETHUSD : 01/01/2019 --> 14/05/2020 = +112%
It is far away from being perfect. There are still plenty of things which can be done to improve it but I just wanted to share it :) .
Enjoy playing with it....

PRP - Pivot Reversal + PSAR Strategy [QuantNomad]PRP is a combination of Pivot Reversal and PSAR Strategy. With this strategy, I tried to be in a position for big moves in the market.
The strategy uses Pivot Reversal entries with an additional condition that TR of entry bar should be at least X ATRs. This allows to filter out some false signals.
For exits, I recoded the PSAR indicator as trailing stop loss. So I start PSAR Y ATRs below the Pivot level price crossed at entry. After that PSAR behaves as usual.
For stability and easier execution, I check conditions only on the close, no stop/limit orders are used.

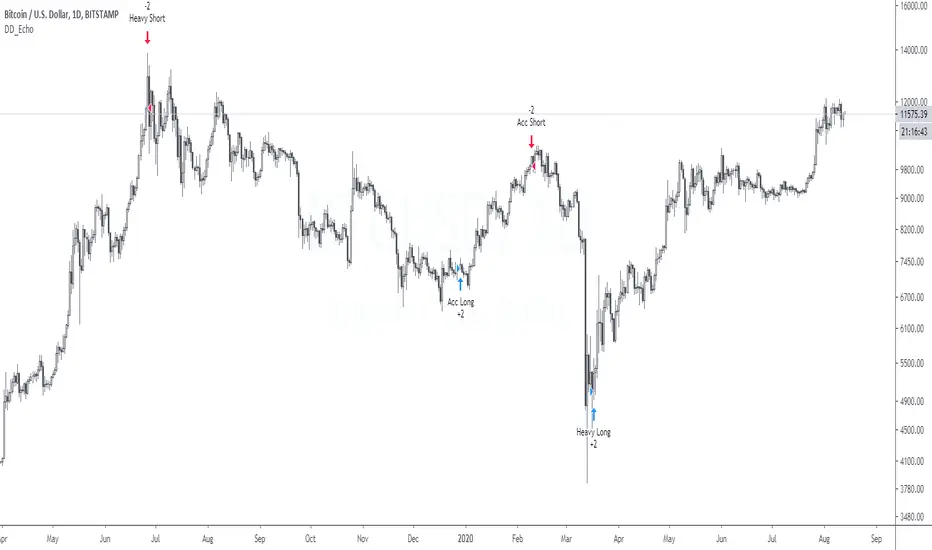
DD_EchoDD_Echo is a buy/sell trading strategy based on sentiment analysis such as fear and greed, Bitmex premium and quantity theory of money.
The performance metrics are as follows:
Net Profit: 412%
Sharpe Ratio: 1.27
Profit Ratio: 2.55
Hit Rate: 100%
If you want to access this, please DM me.
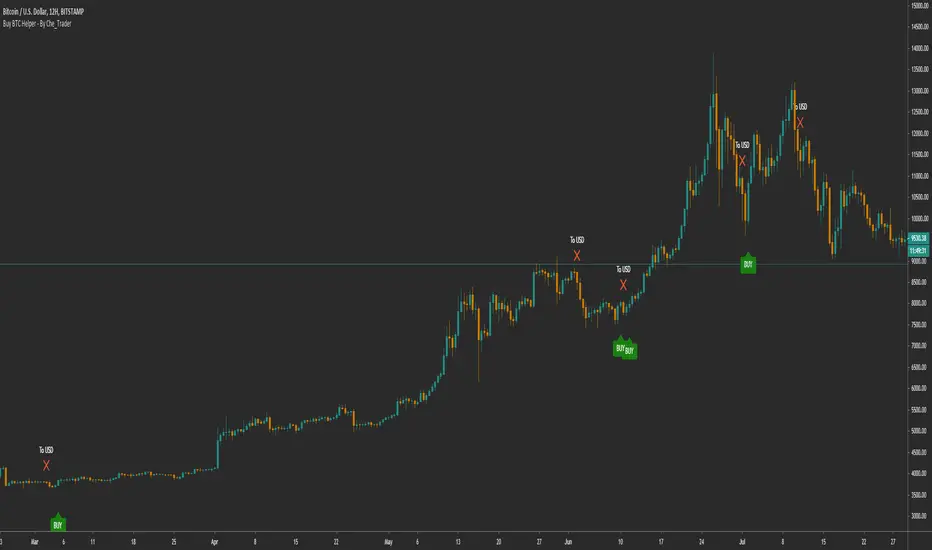
Buy BTC Helper - Buy SPOT, sell to USD (BTC-ETH) - By Che_TraderBuy BTC Helper - Buy SPOT, sell to USD (BTC-ETH) - By Che_Trader
The Buy Helper is specially designed for users who want to invest in BTC in the long term.
Usually you will make about 20-25 trades per year in spot trading.
You do not need a margin account or understand anything about trading.
Just follow the "BUY" and "To usd" signals to make sure you are on trend when BTC goes up but also take profit when BTC starts going down.
This simple tool has beaten the HOLD in all the years tested, also in bull trend or bear trend.
We'll develop this better.
*****************************************************************************************************************************************************************************
General stats from 2017 to 2020 are in the bottom, These are:
(**All data include 0.15% fees+slippage what is more than double the normal fees**)
- 8462% Gains (compound)
- 72 transactions
- 3.238 Profit Factor
- 18.58% Max drawdown
*****************************************************************************************************************************************************************************
The year-by-year analysis is very interesting:
*****************************************************************************************************************************************************************************
2017 HOLD result
+1254%
Buy helper 2017 results:
- +1214.5 % Gains
- 19 transactions
- 11% max drawdown
The 2017 profits are very similar, so you can expect similar win in next bull run.
This is something you'd expect, but it's hard to get in a bot.
*****************************************************************************************************************************************************************************
*****************************************************************************************************************************************************************************
2018 Hold Result
-71%
Buy helper 2018 results:
- +59% Gains
- 21 transactions
- 13.53% max drawdown
These results are particularly impressive. In a year in which BTC declined 72% and with a strategy of only LONG,
that is, without being able to take profit from the crashes,
we were able to finish the year with more than 59% of the money we made on the 2017 bull run.
*****************************************************************************************************************************************************************************
*****************************************************************************************************************************************************************************
2019 Hold Result
+94%
Buy helper 2019 results:
- +202% Gains
- 20 transactions
- 10.4% max drawdown
In 2019 with the buy helper you gained +100% the performance of hold BTC
*****************************************************************************************************************************************************************************
*****************************************************************************************************************************************************************************
2020 Hold Result (up to 04 may 2020)
+24.5%
Buy helper 2020 results:
- +39% Gains
- 11 transactions
- 15.43% max drawdown
In 2020 with the buy helper you gained +50% the performance of hold BTC
*****************************************************************************************************************************************************************************
*****************************************************************************************************************************************************************************
To get access, you can send me a PM here or at a link in the tradingview profile.
*****************************************************************************************************************************************************************************
Strategy BTBTBTBT — strategy for only long positional trading of top cryptocurrencies. BTCUSD and ETHUSD are best suited for this strategy.
The main idea of the strategy is to buy cryptocurrency with a leverage of up to 1: 3 when the market is growing, and get rid of cryptocurrency when the market is not growing or falling.
The strategy is working on a daily timeframe .
To determine the trend, the strategy uses a combination of indicators MA25 and MA99.
To determine overbought (pump) and oversold (dump), the strategy uses the oscillator "SPPO".
The strategy has three trading conditions:
1) SPPO SPPOoverBought - "pump" market. Close all long positions or leave a position with a micro-leverage of 1: 0.1 for a period of 28 days.
3) Closing> MA25 > MA99 - uptrend in the market. We open the "long" position with a leverage of 1: 3.
If market conditions do not meet the above criteria, then the strategy does not have open positions.
Input parameters
Recommended timeframe D1.
FastLength - period for fast MA. Default = 25.
SlowLength - period of slow MA. Default = 99.
SPPOoverSold - trigger for determining the dump in the market. Default = -30.
SPPOoverBought - trigger to determine the pump in the market. Default = 35.
SPPOmaxForLong - the maximum value of SPPO for opening a long position. Default = 10.
LeverageLong - leverage when entering the market with a "long" signal. Default = 3.
LeveragePamp - the amount of leverage when entering the market with a "pump" signal. Default = 0.1.
LeverageDamp - the amount of leverage when entering the market with a "dump" signal. Default = 1.
Log equity chart - If true, use a logarithmic scale for a graph of equity. Default = false.

WinStop Strategy for BItcoinWinStop strategy is a high alpha low volatility trend following strategy based on Validate PSAR trends and RSI and William %R oscillators.
BTC 5 min + ATRThis STUDY is optimized for bitcoin ( BTCPERP on deribit)
It catch fast trades going with the trend, so it should work in trends like in consolidation.
This strategy is based on S/R mixed with parabolic SAR , the point is to catch a movement when it's starting and confirmed.
It's optimized for 5 min timeframe, you might try it on other other tf but change the SL/TP too.
You should used it for few minutes scalp, fast enter and exit, on 5 min TF.
UPDATE ! This time it usenormal candle
The new idea is to filter trades by ATR, and by this way to NOT trade consolidation.
Have fun :)
Rules:
- Use small position, max leverage x5
- Place TP between 70$
- Place SL at 50$
- Entre in position by limit, you get paid for it
Enjoy, test it and make some money :)
No repaint.

Gap Trading Strategy: CME BitcoinI created a strategy which finds gaps on CME Futures market for Bitcoin, BTC1! and opens a long or short position on the crypto exchange depending on what kind of gap was found (up or down) on CME.
Up gap: today open price > previous day high price
Down gap: today open price < previous day low price
Two lines below the main chart show when gaps appear. The green line represents the size of up gaps, when it crosses zero it gives a long signal. The red line - represents the size of down gaps, when it crosses zero - short signal.
Instead of having to look between multiple charts, this simply overlays the past weeks open and close should a gap appear.
Usage:
Strategy flips long / short depending of indicator signals. It could cut the position by stop loss or take profit.
Features:
ability to set stop loss and take profit in %
ability to set delta for gaps (if you want to filter small ones)
ability to choose strategy type. Standart: Long Up/Short Down || Inverse: Short Up/Long Down.
Backtesting:
Backtested on BTCPERP ( FTX ) and XBTUSD (Bitmex).
It shows a low drawdown, a small number of trades and 50% of profit for the 2020.
For example, I set high delta for down gaps to filter small ones
Strategy doesn't repaint.

The MATRIX: Ultimate Crypto Position StrategyHi all,
We are cryptocurrency miners and 'hodlers’ since 2013, with unwavering confidence in the technology behind it. We’d always thought that it would be a life-changing êvent. And we were right. We went from “broke” to making shit loads of money and all the way back to bitter nothing. If you are lucky, you probably haven’t experienced what if feels to be high on cash and then fall very deep low, but let me reassure you, it is a nasty feeling.
Then we wondered, what the hell did we do wrong? Or better say, what didn’t we do right! The answer was dead simple: We had no experience in trading, we were overwhelmed by emotions and we didn't use any trading strategy. Hence, we were doomed to fail from the beginning.
In order to build an all-in-one profitable trading strategy, we had to start from zero. The one thing we learned is that your goal for financial gain cannot be achieved without discipline and consistency. Our prime focus was to absorb as much info as possible regarding trading and coding by doing an extensive self-study, which consequentially took us to the next level.
One of the secrets to being successful from a trading perspective is to have an indefatigable and undying thirst for information and knowledge. As Bruce Lee once said: “Learning is never cumulative; it is a movement of knowing which has no beginning nor end”. So, we adapted what was useful, rejected what was useless, and added our own preferences based on our mindset. We were totally committed to be the best. Our goal was never to lose money again! Of course, this is an illusion, as no single strategy is correct all of the time.
Therefore, the final trading strategy was based on the following key elements:
• The avoidance of risk is more important than absolute profit. Do not anticipate and do not move without market confirmation. Being a little late in your trade is your indication if you are right or wrong.
• Offering simplicity and practicality, for those that do not have the time to trade 24/7.
• Believe in analysis and not in forecasting. Trading is a skill for those who are smart and gambling for those who are not.
In conclusion, we are absolutely thrilled to finally release this trading strategy after one year of extensive back testing and optimization. The script was supposed to be for personal use only, but because Tradingview has helped us a lot in this process, we want to share it with all of you and give something back to this amazing community. If you learned something new today and found value, please give us a like to show your support! We’d really appreciate it.
***The script is invite-only, message us to get script access***
-------------------------------------------------------------------------------------------------
The MATRIX: Ultimate Crypto Position Strategy should be used as follows:
• The trading strategy was designed and optimized for trading cryptocurrencies only ; furthermore it works best on established high market cap cryptocurrencies that have a clear trend such as:
BTCUSD
ETHUSD
LTCUSD
XRMUSD
EOSUSD
ADAUSD
DASHUSD
ETCUSD
• The trading strategy is based on swing/position methodology. The script must therefore be used on daily timeframe candles only (1D) .
• Use USD trading pairs only (e.g. use ETHUSD instead of the ETHBTC) since the individual trend is captured more effectively and therefore gives better results.
-------------------------------------------------------------------------------------------------
The MATRIX:Ultimate Crypto Position Strategy is based on the following indicators:
• Ichimoku Cloud ; acts as the leading indicator.
• Volume ; without strong volume , a market move is not valid.
• MACD and Vortex ; both being used as confirmation indicators.
• Choppiness index ; avoids trading in choppy markets.
• Bullish/ Bearish Regular Divergences in combination with RSI to spot tops and bottoms.
• Simple and Exponential Moving Averages ; prêvents trading against the trend.
The trading strategy is easy to use, trend based and without repainting, meaning once a signal has been made it is permanent and that no future data is used in the decision making. It detects the trend and filters out market noise based on more than 10 technical indicators. ONLY when all indicators align with each other the algorithm prints a BUY or SELL signal. The trading strategy provides high probability trading signals and minimizes risk! This script aims to capture the profit from longer term trending moves and by doing so filters out non-substantial trends and avoids the associated risks with these trades.
-------------------------------------------------------------------------------------------------
The MATRIX: Ultimate Crypto Position Strategy has the following features:
• Automatically generated Buy / Sell alerts in the form of a label.
• NO Repaint once candle is closed.
• SAFEGUARD ; custom built-in security prevẹnts trading when the price is out of equilibrium.
• Customizable Display for the Ichimoku cloud indicator display.
-------------------------------------------------------------------------------------------------
Below are the backtest results. Keep in mind that this strategy is quite conservative resulting in few long positions. These results are therefore no guarantee for the future.
Back test results: (only Long trades, signal to signal, order size: 100% of equity, commision fee 0.1%, period: start of chart)
Exchange-----Asset---------Timeframe---Percent Profitable----Profit Factor-----Total Trades----Max Drawdown---Average bars in trade-----Net Profit
Coinbase-----BTC/USD---------1D----------------100----------------N/A------------------10---------------0.00---------------------54-------------------6183.6
Coinbase-----ETH/USD---------1D----------------100----------------N/A------------------7----------------0.00---------------------46-------------------11673.0
Coinbase-----LTC/USD---------1D-----------------100---------------N/A-------------------7----------------0.00---------------------46------------------4727.0
Bínance------EOS/USD---------1D-----------------100---------------N/A-------------------3----------------0.00---------------------34------------------42.8
Bínance------ADA/USD---------1D-----------------100---------------N/A-------------------2----------------0.00---------------------40------------------118.4
Coinbase-----XTZ/USD---------1D-----------------100---------------N/A-------------------1----------------0.00---------------------36------------------34.4
Bínance------BNB/USD---------1D-----------------66.7--------------10.8-------------------6---------------24.22--------------------38------------------1488.8
Bínance------ETC/USD---------1D-----------------100---------------N/A-------------------2----------------0.00---------------------33------------------94.9
Bínance------XMR/USD---------1D-----------------100---------------N/A-------------------3----------------0.00---------------------43------------------74.2
Bínance------ICX/USD----------1D-----------------100---------------N/A-------------------2----------------0.00---------------------29------------------215.3
-------------------------------------------------------------------------------------------------
Reminder: Use this trading strategy at your own risk and trade responsibly. We are not responsible for any financial loss using this strategy.
***The script is invite-only, message us to get script access***

SMA Cross strategyThis is a simple strategy which is always profitable and trades better than most premium channels and I give it out for free :)
Working very good on ETHUSDT futures on binance :)

Ichimoku Cloud & ADX & MACD with TSL [tg1]Hi There! Used the time at home during the corona to learn Pinescript and work on this strategy. Its finetuned for BTCUSDT on mid-high timeframe, can be used for other TF/markets, but be extra careful).
The strategy is mainly build around Ichimoku Kinko Hyo and its Tenkan and Kijun crosses. It aims to only buy/sell when there is a strong trend in any direction (using MAs, ADX and ATR) and enters a trade based on these conditions:
1) Tenkan > Kijun
2) Close > Kumo
3) MACD > Signal
4) ADX > Custom value
The same applies for shorts, just the other way around.
I added a TSL based on either % or ATR fixed % for improved risk management. Let me know if any questions.

Ichimoku Cloud & ADX & DMI & MACD [tg1]Hi There! Sharing my strategy that is mainly build on Ichimoku Kinko Hyo and its Tenkan and Kijun crosses.
In addition, I added a few other indicators to have less false breakout signals. See more details below:
Long conditions :
1) Tenkan crosses over Kijun
2) Tenkan & Kijun > Kumo
3) Close > Kumo
4) Chikou > Kumo (-n periods)
5) ADX > Custom value
6) DI+ > DI-
7) MACD > Signal
8) SMA > 200
Short conditions are simply the other way around. This indicator has been mainly tested and tuned for BTCUSDT.

Intraday Trend Following Algorithm [Bitduke]Description :
Trend following strategy that constantly adjusts to volatility and avoids of most whipsaws; rapidly moves up or down according to a quickly changing market. Great strategy for high volatile markets, like crypto market.
Based on a couple of special moving averages with integrated smoother which helps to avoid whipsaws.
Backtesting
Backtested on BTCPERP ( FTX ). It shows much better results on 4h timeframe (more than 222% YTD) and relatively low drawdown which allows you to use up to x3 leverage without a fear of huge losses. I.e if we have 5% drawdown for this strategy and using x3 leverage then to be prepared to 15% drawdown maximum in this case.
Initial Capital: $1000
Capital per trade: $1000
Including fee: 0.075% (buy + sell) side, type "taker"
When we get a signal (green/red column on chart) algo opens a trade by the next candle open price.
Others:
Risk management: Stop loss/Take profit in %
Strategy doesn't repaint .
----------
To access: sign up on FTX using ref link from my signature.

Squeeze Momentum Strategy SL TP v2Improved version of my Squeeze Momentum Strategy.
Changes:
Possible to change source: ohlc4, hl2, hlc3, close
Enter your stop loss and take profit in %, NOT ticks
Working and robust even without take profit / stop loss
Yearly drawdown lower than 20%
Backtesting
Backtested on BTCPERP (FTX). It shows much better results on 1h timeframe (about 200% yearly, 55% in 2020) and relatively low drawdown to date.
Initial Capital: $1000
Capital per trade: $1000
Including fee: 0.075% (buy + sell) side, type "taker"
Strategy doesn't repaint.
Shortly about Squeeze Momentum Indicator:
This is a derivative of John Carter's "TTM Squeeze" volatility indicator, as discussed in his book "Mastering the Trade" (chapter 11).
----------
To access : sign up on FTX using ref link from my signature.

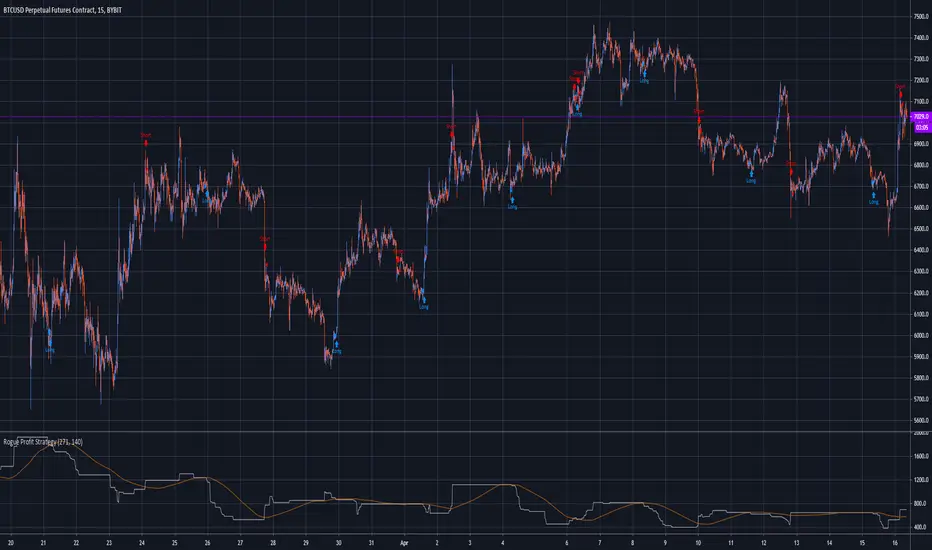
Rogue Profit StrategyThis is a complex script developed to measure specific volatility parameters and enter trades based on predetermined rules which are proprietary and will not be released, so don't ask for specific strategy settings.
The strategy keeps you in the market at all times either long or short. Parameters can be changed to better suit the asset your are trading, time frame and your particular trading style but the overall volatility rules for entering and exiting remain the same. It can be used to trade any asset but be aware the parameters you use for one asset, lets say Bitcoin, will not work with another asset like Forex. If the asset is on TradingView, you can use this indicator to trade it.
It is meant to trade pure price action candlesticks so do not use anything but a typical candlestick chart. You are going to have to put in some work and play around with the input parameters to make this strategy the most profitable for your trading style. Trading is hard but hopefully this strategy will help flatten the learning curve. This strategy is accompanied by an indicator study named "Rogue Profit Alert Indicator" that will work with setting alerts for manual or automated trading.
This strategy does NOT repaint.
This is a very powerful and profitable script that will simplify your trading and has been in development and tested for three years. Message for details on how to obtain access. Please allow up to 24 hours for a response.
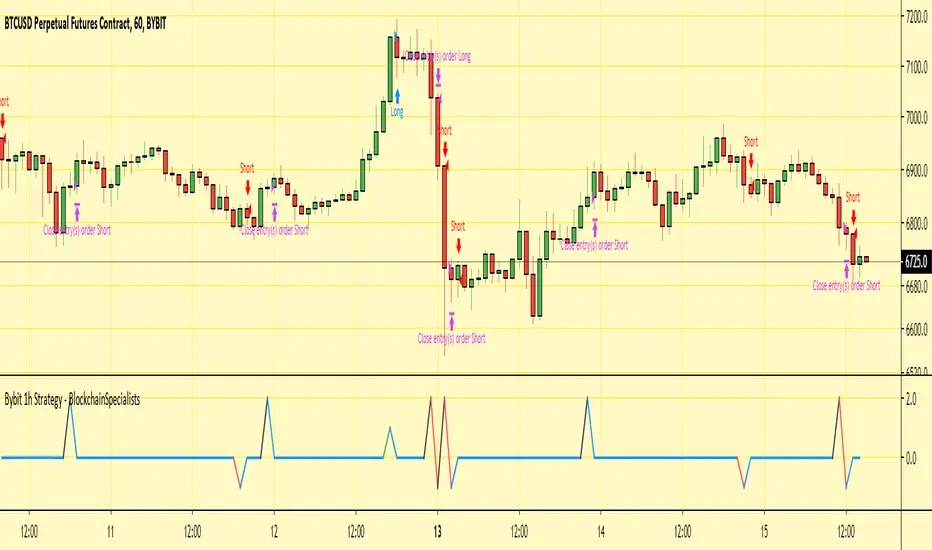
Bybit 1h Strategy - BlockchainSpecialistsHi,
This strategy is a combination of multiple different trend identifying and mean reversion indicators. It aims to work on all Bybit Crypto/USD pairs on the hourly time frame. It works on other time frames but not to the same levels of success. I've tried to keep it as simple as possible by making the indicator flash or alert when a long/short entry has been identified, and also when long/short exit criteria has been met. Make sure to wait until the candle has closed and the indicator has finished forming otherwise you could get jumpy alerts. To clarify this is what you need to look out for:
1 = Long Signal
-1 = Short Signal
2 = Long/Short exit (this will only flash when a position is currently open)
I've also colour coded the signals to make it even simpler and even prettier.
Any questions/issues/suggestions let me know.
Please enjoy!
Gekko DEMA StrategyThis script is based upon the Gekko trading strategy.
This strategy uses Exponential Moving Average crossovers to determine the current trend the market is in. Using this information it will suggest to ride the trend. Note that this is not MACD because it just checks whether the longEMA and shortEMA are % removed from each other.
* short is the short EMA that moves closer to the real market (including noise)
* long is the long EMA that lags behind the market more but is also more resistant to noise.
* the down threshold and the up threshold tell Gekko how big the difference in the lines needs to be for it to be considered a trend. If you set these to 0 each line cross would trigger new advice.
The base strategy has had money management logic added and has been tested for best results. Once you have access, you can modify these settings to find what works best for you.
Access to this strategy is FREE! Message me for more information on how to get access.

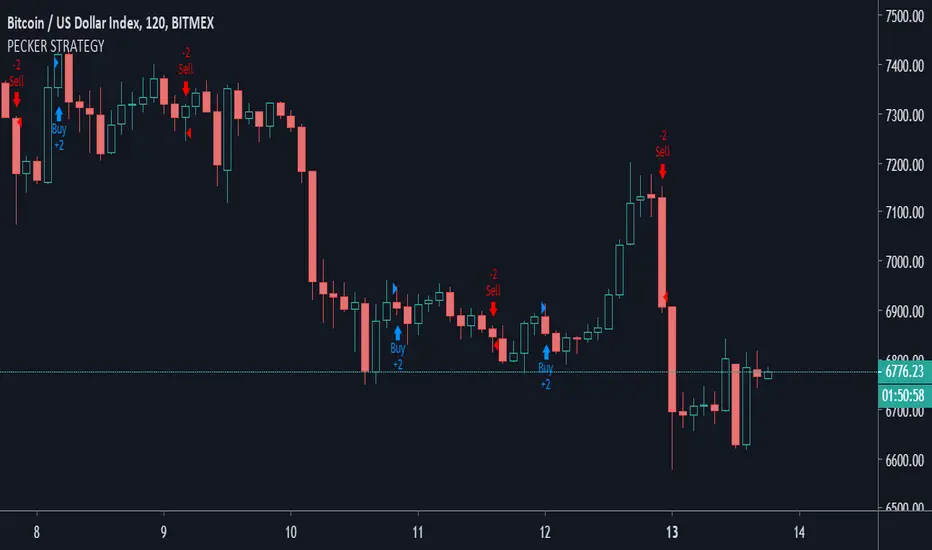
PECKER STRATEGYStrategy works best on higher time frames 1h+ (best performance in bitcoin on 2Hr candles) and in the default settings tested on Bitcoin XBT/USD on Bitmex
It is designed to detect trend changes, reverses in price movements and to always be in position, either long or short.
Strategy has only two types of signals, either long or short to indicate trend switch.
Do not forget to set taker's fee 0.075% on bitmex for example and to account for slippage.
Crypto Tipster Pro+ (Optimized for BTCUSD)===========
Crypto Tipster Pro+ Optimized for BTCUSD
===========
This script is a carbon-copy of our Crypto Tipster Pro Strategy , but also includes our Custom & Fully Optimized Settings for turbo-charging your Bitcoin (BTCUSD) trading over the last 12 months.
-----------
We keep all our Crypto Tipster Pro+ (Optimized) strategies regularly updated and maintained. The purpose of these Add-On's to our Crypto Tipster Pro Strategy is to keep each trading plan relevant, up-to-date and most of all profitable within ever-changing markets.
We will always keep our main Crypto Tipster Strategy active, as the default settings are the best "all-rounder" set-up and work with many crypto pairs over many different time frames. This Set-Up for Bitcoin enables you to hone in on one certain trading pair on the D chart and maximize your overall net profit.
-----------
Visit the link below for Full & Immediate Access!
Good Luck and Happy Trading!

GoldMode On (Triple compromise strategy) TF 60-240BINANCE:BTCUSDT
Greetings.
I am publishing this script in order to get feedback for further work on it.
The script combines a compromise between several classic strategies, and each of them uses modifications of classic indicators on specially selected averaging sliding indicators.
1. The script uses an ATR-based filter (it's off by default, as it's better on BTCUSD , but you can enable it in the settings if you want to use it on EURUSD , for example, or on other symbols).
2. A strategy based on crossing the moving.
3. A strategy based on determining the direction of movement of the modified slow and fast RSI .
4. A strategy based on the modified ADX +DI -DI .
The essence of the strategy in finding a compromise decision on the signals coming from each of these three strategies.
=====
Приветствую.
Данный скрипт публикую с целью получить обратную связь для дальнейшей работы над ним.
Скрипт сочетает в себе компромисс между несколькими классическими стратегиями, причём каждая из них использует модификации классических индикаторов на специальным образом подобранные усредняющие скользящие.
1. В скрипте используется фильтр на основе ATR (по умолчанию выключен, т.к. на BTCUSD так лучше, но можно включить в настройках, если хотите использовать его на EURUSD , например, или на других инструментах).
2. Стратегия основанная на пересечении скользящих.
3. Стратегия основанная на определении направления движения модифицированных медленной и быстрой RSI .
4. Стратегия основанная на модифицированном ADX +DI -DI .
Суть стратегии в поиске компромиссного принятия решения по сигналам поступающим от каждой из этих трёх стратегий.