[Joy] Aladdin Long Trading Strategy 1.0.0 AlphaAladdin's Long trading strategy is to test out Aladdin for long trades only
This strategy is mainly used to test whether Aladdin is suitable for a coin/stocks/futures or for any trading. The profitability, average drawdown, average profits, etc are used by me to decide whether to use it for trading.
What is Aladdin and what does it do?
Using the volume and gradual flow of non-interrupted data (wicks and body of the candles), it tries to detect the macro condition of the market so that one may know in which direction the market is flowing.
* Bearish / Sell sign: On the candle's close, I open a short position
* Bullish sign: On the candle's close, I open a long position
* I take at least 50% profit when the indicator indicates to do so. One can configure that value as desired from the configuration depending on one's risk/money management. I might even convert some portion of the position into stable coins.
FAQ
Q: Does it use some EMA /MA/etc.? Does it use any indicator with tweaked settings?
Answer: No.
Q: What does it mostly depend on?
Answer: Volume and gradual flow of non-interrupted data. The logic depends purely on volume , price bars and the wicks.
Q: Does it work with all coins, stocks, futures, instruments?
Answer: I prefer to use the exchange with the best possible data. Then backtest out to find the best possible timeframe, stop loss and target all derived from this script data.
Q: Can you make it free or make it open source?
Answer: There is no free lunch in this world. I will never reveal or share the source code!
Q: Do you provide ongoing support for the indicator?
Answer: Yes, as long as I can, I will continue updating the indicator
Q: Are the bullish /buy & the bearish/sell markers automatic?
Answer: I have no control over the markers. It is driven purely by logic from the script.
Q: Is this financial advice?
Answer: This is not financial advice. I do not guarantee any profit or loss. I am not responsible for any of your losses or profits. My indicators do not assure profit or loss. It also does not auto-open or auto-close a trade.
Assumptions:
Only long trades are opened and closed. No short trades.
Starting Capital: $20,000
Order Size: 20% of Capital
Data used: Whatever data is available from 2011 till today on Trading view
Findings:
INDEX: BTCUSD 83% profitability using 2day tf
54 closed trades
Profit factor: 16
Sortino Ratio: 5.2
Average Winning Trade: 30%
Average Losing Trade: 9.12%
Largest Winning Trade: 1218%
Largest Losing Trade: 20.25%
Below are the profitability rate for the timeframe and the coins listed as found by running the trading strategy over the following as of today (Aug 1st 2021 12:40 pm Sydney Time).
⚜️ INDEX:BTCUSD 83% using 2day tf
⚜️INDEX:ETHUSD 80% using 1day tf
⚜️FTTUSD 81% using 2day tf
⚜️SRMUSD 71% using 1day tf
⚜️ADAUSDT 81% using 2day tf
⚜️ALGOUSD > 90% using 2day tf
⚜️ALTPERP 81% using 2day tf
⚜️AVAXUSDT 75% using 1day tf
⚜️BANDUSD > 90% using 2day tf
⚜️BCHUSD 82% using 2day tf
⚜️BNBUSD 79% using 1day tf
⚜️BNBUSD 85% using 2day tf
⚜️CHZUSD 71% using 1day tf
⚜️COMPUSD 81% using 1day tf
⚜️DOGEUSD 77% using 1day tf
⚜️EXCHPERP 83% using 1day tf
⚜️FILUSD > 90% using 1day tf
⚜️FTMUSD 70% using 2day tf
⚜️HTUSDT 75% using 2day tf
⚜️KINUSD >90% using 2day tf
⚜️LINKPERP 85% using 2day tf
⚜️LTCUSD 80% using 2day tf
⚜️MATICUSD 77% using 2day tf
⚜️NEOUSD 80% using 1day tf
⚜️NEXOUSD > 90% using 1day tf
⚜️OKBUSD 71% using 1day tf
⚜️OMGUSD 75% using 1day tf
⚜️RSRUSD 87% using 1day tf
⚜️RUNEUSD > 90% using 1day tf
⚜️SHITPERP > 90% using 1day tf
⚜️SOLUSD 84% using 1day tf
⚜️SUSHIUSD 71% using 1day tf
⚜️THETAUSD > 90% using 2day tf
⚜️UNIPERP 83% using 1day tf
⚜️VERTPERP > 90% using 1day tf
⚜️XAUUSD 63% using 2day tf
⚜️XTZUSD 83% using 2day tf
⚜️ZECUSD 72% using 2day tf
Disclaimer:
No one knows what will happen in the future. DYOR and decide on your own conditions. Do realize that neither I nor my indicator can guarantee any profit or loss. And there is no assurance that any trade will ever result in any profit. It is not financial advice.
Bitcoin (Kriptopara)

Multi-X by HamidBoxHello to All, introducing Multi Types Crossover strategy,
simply the best way of trading with Crossover and Crossunder Strategy, How it Works???
I added 5 types of Moving Averages,
1: Simple Moving Average ( SMA )
2: Exponential Moving Average ( EMA )
3: Weighted Moving Average ( WMA )
4: Volume Weighted Moving Average ( VWMA )
5: Relative Moving Average (RMA)
With this indicator, you can do scalping, You can trade not only with similar types of Moving Average indicators but also with different types of Moving Average indicators.
what is mean? like: Normal Condition is:
( Simple Moving Average ) Crossover to ( Simple Moving Average ), SMA x SMA
( Exponential Moving Average ) Crossover to ( Exponential Moving Average ), EMA x EMA
But we can Crossover with:
( Exponential Moving Average ) Crossover to ( Simple Moving Average ), EMA x SMA
( Simple Moving Average ) Crossover to ( Weighted Moving Average ), SMA x WMA
( Weighted Moving Average ) Crossover to ( Weighted Moving Average ), WMA x WMA
( Simple Moving Average ) Crossover to (Relative Moving Average), WMA x RMA
and also I added Moving Average ZONE in this tool, What does it work???
The zone will tell us what type of direction the market has, if the market is above the zone, it's mean we have a Bullish Trend, and if the market is below the zone, it means the market has a Bearish Trend,
so if you want to play on the safe side, never trade when the market is in Bearish Trend, and if you want to play on aggressive mood, you can skip Moving Average Zone section.

[astropark] Rolling VWAP V2 [strategy]Dear Followers,
today I'm glad to present you yet another awesome Analysis Tool and Strategy, that you may like to use in your trading journey: Rolling VWAP V2 !
This is an upgraded version of my "Progressive VWAP" analysis tool (progressive and rolling are synonymous for me), its description describes quite well what a progressive/rolling vwap is and why they are important to watch:
This indicator can print automatically for you many important Rolling VWAPs:
Daily (D)
2 days (2D)
3 days (3D)
4 days (5D)
Weekly (W)
2 weeks (2W)
Monthly (M)
Quarterly (Q)
Yearly (Y)
As an indicator it will let you:
enable/disable each rolling vwap, change its color and line style and thickness
enable/disable labels and/or price on labels, as well as change their size
As a strategy it will let you:
enable/disable buy/sell signals
choose which strategy to use (all based on rolling vwaps of course)
choose a starting date & time from which to start backtesting
enable/disable individually long and short setups in the backtesting
You should choose low timeframe rolling vwap strategy if you are on a low timeframe, while higher timeframe rolling vwaps are good on medium-high timeframes.
For example D-2D-3D rolling vwap strategies are good at 1h or below, the others on higher timeframes. Backtesting results will help you in understanting this point quite easily.
This indicator works on every timeframe, market and pair. By the way it must be said that, as a bot strategy it has been tested and designed mostly for Bitcoin trading and it works best on 1h or above.
As I always say, all tools are great if you use them correctly: this is not the "Holy Grail", so always use proper money and risk management strategies.
This is a premium indicator , so send me a private message in order to get access to this script.

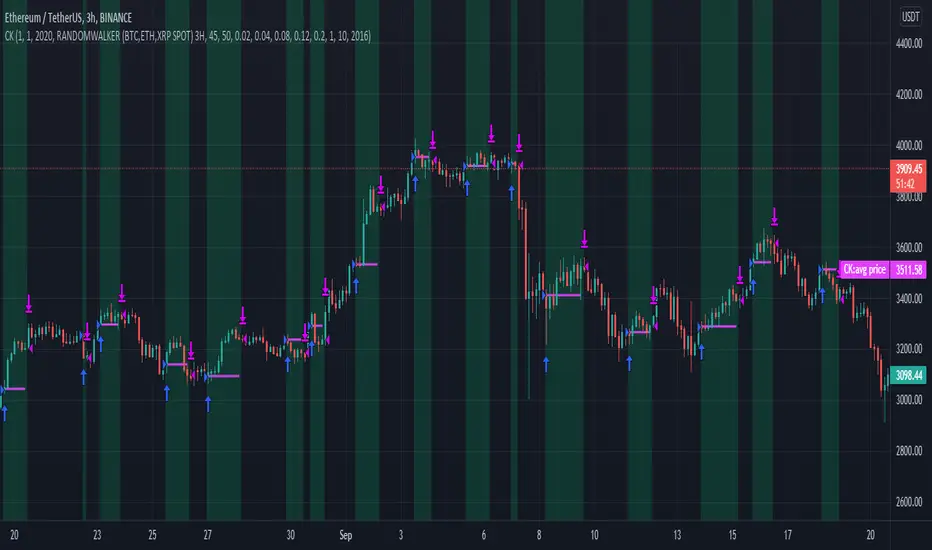
CryptoKillerCryptoKiller is a trend following trading system. It provides entry and exit points, a money management system and a trade management system.
The entry points (fuchsia line) are determined by CryptoKiller Oscillator (see other published script to understand how the oscillator works).
The trade management system provides the exit points in profit and in loss. This script works with multiple take profits (green lines), the initial position is liquidated little by little as the trend reaches the profit targets. Trade management also provides trailing stop exits to save the remaining profits.
Stop loss (red line) take into account the recent past of the chart to be determined, while take profits are fixed and have been calculated based on historical volatility.
The money management system is very simple, it plans to enter a position with a fixed percentage with respect to equity.
CryptoKiller, during an operation, also draws supports and resistances on the chart - determined by the oscillator (orange lines) these supports and resistances are used as a filter to understand where there is the greatest probability of trend development (some entry points provided by the oscillator will therefore not be considered by CryptoKiller as entry points, as in disagreement with the traced supports / resistances).
We know that an error appears in the backtest calculation, where the script is said to suffer from a bias, so the backtest calculation may not be accurate. Actually this happens in high times like H4 or daily, but CryptoKiller is not designed for these timeframes. it is a short-term strategy.
For more information read the author's instructions to contact us, we will send a PDF file with a more complete explanation of the strategy accompanied by screenshots.
Access to this script is granted along with access to CryptoKiller Oscillator.
Ichimoku Cloud Strategy Long Only [Bitduke]Slightly modificated and optimized for Pine Script 4.0, Ichimoku Cloud Strategy which, suddenly, good suitable for the several crypto assets.
Details:
Enter position when conversion line crosses base line up, and close it when the opposite happens.
Additional condition for open / close the trade is lagging span, it should be higher than cloud to open position and below - to close it.
Backtesting:
Backtested on SOLUSDT ( FTX, Binance )
+150% for 2021 year, 8% dd
+191% for all time, 32% dd
Disadvantages:
- Small number of trades
- Need to vary parameters for different coins (not very robust)
Should be tested carefully for other coins / stock market. Different parameters could be needed or even algo modifications.
Strategy doesn't repaint.

mark strategy2 divergence bot v0.5 for xbtusdHi first of all thanks for read this.
This is my second strategy for make trading, I optimized it for xbtusd with 30 min charts.
You can personalize some setting for reach a better result then me, these are the setting:
this script is only for long trade, so bearish divergence don't work
1)ema1
U can change this value for use another ema and use a faster or slower trend
2)ema2
U can change this value for use another ema and use a faster or slower trend
3)pivot right
U can change this value for watch a number of bar on your right
4)pivot left
U can change this value for watch a number of bar on your left
5)high range
U can change this value for watch a max number of bar
6)low range
U can change this value for watch a min number of bar
7)bullish
U can change this value for enable signal with bullish divergence
8)hidden bullish
U can change this value for enable signal with hidden bullish divergence
9)bearish
U can change this value for enable signal with bearish divergence
10)hidden bearish
U can change this value for enable signal with hidden bearish divergence
11)profit 1 %
U can change this value for the first take profit target
12)profit 2 %
U can change this value for the second take profit target
13)qty target 1 %
U can change this value for close a % of your trade at target 1
14)loss %
U can change this value for close the trade at a % of loss
Have nice day and send me a message if u will earn with my strategy.
If u want my code send me a message
for info send me a message

Crypto Strategy for Bearish Markets (Binance, FTX, Futures...)BINANCE:BTCUSDTPERP
Even in months like May '21 you can win by going long on Bitcoin. This strategy proves it and is not overwhelmed by Elon's ...
The backtest was carried out during the month of May of this year and, as you can see, all the long operations opened during the fall were successful.
So if we are going to continue to have a bear market for some time, why not take advantage of it while we remain bulls?
This strategy uses Dollar-Cost-Average (DCA) to average the entry price. Thanks to this, it is able to close profitable trades even in times of great volatility and bearish pressure.
It includes alerts that can be configured that will be sent every time the conditions to operate are met. These alerts can also be linked with 3commas for a fully automatic operation.
For Leverage Futures or Margin traders, all you have to do is divide the initial capital by the leverage used.
Enjoy!

TEMA Cross +HTF BacktestThis is a follow up to a previous script release called " TEMA Cross Backtest ".
This new strategy uses two TEMA crosses, one for trend direction, one for entry and exit. The entry and exit parameters are the same as the previous script. The trend direction is based on a user configurable higher timeframe TEMA cross which determines when to take longs or shorts. When the indicator is purple, it is looking for shorts, and when it is yellow, it is looking for longs. The background of the chart is colored accordingly to see the trend direction at a glance.
The default settings are the ones I have found produce the highest backtest results. The backtest is set by default to use a $500 account, and use $500 for every entry and exit, no matter the direction or overall profit/loss.
Parts of script borrowed from other public scripts.

EMA+RSI Pump & Drop Swing Sniper (SL+TP) - StrategyThis is the strategy version of the 'EMA-RSI-Pump-Drop-Swing-Sniper-With-Alerts':
Some additions with this strategy:
~Added Stop loss & Take profit control. In Settings > Inputs if the Stop Loss is at .051 that means it's 5.1% and the Take Profit at .096 is 9.6%. If you wish to remove the TP and SL just change the value to 1.00 and it would be the same as it being 100% TP and SL which is likely to never be hit.
~Added Backtesting by changing the month/date/year in Settings > Inputs
~Added a 2nd EMA line to assist with the long entry signals. I only use this for long entry & exits, though you could use the long exits as Short entries too. I just personally don't do short trading on Bitcoin.
This is using an EMA and RSI with slightly modified settings to give good entry and exit points while looking at Bitcoin. I use this on a 1-hour and 4-hour chart and with other indicators to find good positions to enter a trade or exit if things are turning red.
It's important to know this strategy was made as a request by another user that was using the indicator version. I don't use this as a trading strategy by itself, I use the visuals it gives as a confirmation with other indicators to find the best possible entry and exit positions.
If you click on the EMA line it will color the bars of the chart based on if they are above or below the EMA - This is just visually helpful for me to see the active trend.
Make sure you hover over or click on the EMA line to see the colors of the candles change - it's not visible by default or without doing this.

High Low Reversal This bot makes use of an algorithm which detects new highs and lows. When doing long trades, the bot will trigger a buy order on a newly made low. When making shorts, the bot will trigger a short trade on new highs.
Currently, the bot is optimized for cryptocurrencies on the M15 time frame. With the right amount of leverage and portfolio optimization this bot can obtain very strong results.
Feel free to optimize it to your own liking on different assets and/or time frames.
This bot performs exceptionally well in trending markets. Currently, it's only making long trades, but you can make it do short trades in the control panel.
The settings of the back test as follows:
starting capital = 100k
leverage = 1
commission = 0.2%
Equity per trade = 50%. Since the bot only makes one trade at a time you can allow it to use a bigger portion of your balance per trade.
I've also made a study-script for easy implementation on the exchange. You get that script once you get access to this bot.

Optimized Keltner Channels Strategy for BTCThis strategy is optimized for Bitcoin with the Keltner Channel Strategy, which is TradingView's built-in strategy. In the original Keltner Channel Strategy, it was difficult to predict the timing of entry because the Buy and Sell signals floated in the middle of the candle in real time. This strategy is convenient because if the bitcoin price hits the top or bottom of the Keltner Channel and closes the closing price, you can enter Buy or Sell at the next candle start price. In addition, this strategy provides a visual plot of the price (bprice, sprice) at which the candle is closed by hitting Keltner Channel.
▶ Usefulness and Originality
- Convenient Buy and Sell entry compared to the original Keltner Channel Strategy
- Optimized for BTCUSD market (maximizing profits)
___________________________________________
이 전략은 TradingView의 Built-in 전략인 Keltner Channel Strategy를 비트코인에 맞게 최적화되었습니다. 기존의 Keltner Channel Strategy는 Buy, Sell 신호가 캔들 중간에 실시간으로 떠서 진입 시점을 예측하기 어려운 불편함이 있었지만 이 전략은 비트코인 가격이 Keltner Channel 상단 혹은 하단을 찍고 종가를 마감하면 그 다음 캔들 시작가에서 Buy 혹은 Sell 진입이 가능하여 편리합니다. 또한, 이 전략은 Keltner Channel을 만나서 캔들을 마감한 가격 (bprice, sprice)을 시각적으로 plot을 제공하여 타점 및 차트를 보기에 편리합니다.

Stochastic TrendDear community,
I've made another simple trading bot for you to use. This bot is based on the Stochastic Oscillator. It only produces long trades currently.
I changed the oscillation period to a much longer one, which in turn creates opportunities to trade long term trends.
The bot goes long when the Entry lines is crossed from below and it will close its long position once the Exit line has been crossed from above.

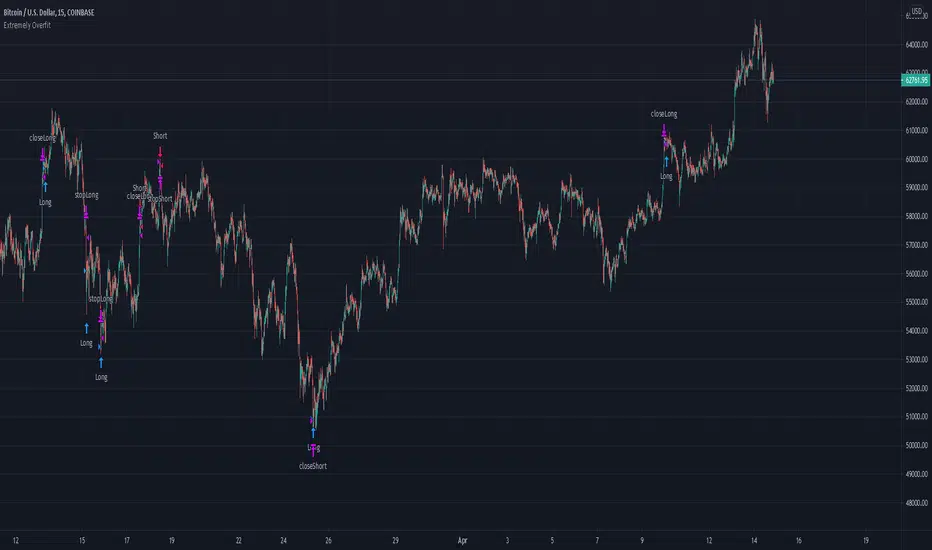
Extremely Overfit Bitcoin Long/ShortThis is a highly overfit (in my opinion) script to long/short BTC on the 15m time frame. May be usable for other cryptocurrencies or timeframes with some parameter adjustments. I backtested it on a few exchanges with ETH.
The simplest way to increase the number of trades is to decrease the "FastChannelLength" parameter or increase the "SlowChannelLength" parameter, or both. Decreasing the margins of the channels also increases the number of trades. In GENERAL, you should expect that adding more trades will hurt profitability, because, as the title says, this script is extraordinarily overfit.
It does include a commission fee from the start, which I find is essential to not providing an overly rosy view of how a strategy would work.
Fibonacci DCA TrendThis bot makes use of an algorithm which detects new heights and places limit orders according to the Fibonacci retracement theory. By placing limit orders under the current price, the bot allows itself to catch smaller and larger dips. This is also known as “Dollar-Cost-Averaging”, DCA in short. This bot is ideal for bull markets, both on crypto and stock indices.
The green lines are the limit orders. As soon as the price touches the limit order, a position is entered.
The settings of the back test as follows:
starting capital = 100k
leverage = 1
commission = 0.2%
Equity per trade = 5%, a realistic investment strategy when trading 2-3 assets with this bot.
It’s advised to trade this bot with futures for potential leverage. On time frames lower than H1 I’d use 2x-3x leverage for better results, especially in trending markets. On larger time frames I wouldn’t use any leverage.
This bot has very strong results on a multitude of assets. The best results are on the M15 time frame.
To give you a few ideas, this bot is tested on the assets below. All the results are very similar. You can contact me for a back-test on a specific asset. You can find the back-test results on my website.
BTC
ETH
SPX500
NAS100
The standard inputs are generally the best all-round inputs. Feel free to change the inputs to your liking.
I've also made a study-script for easy implementation on the exchange. You get that script once you get access to this bot.

RSI Trend CryptoDear community,
Today I want to present you one of my favorite and simple trading bots: The RSI Trend.
This bot is based on the RSI, which normally is used as a trend reversal indicator. However, here it’s used as a trend finding indicator, often with great success. This bot making long-only trades, which is quite successful in bull-markets like the one we’re currently in.
In case you want to use an emergency exit for your trade, toggle the Emergency Exit parameter. During bull-markets it’s better in the long term to keep this option off.
Currently the bot only makes one trade at a time (pyramiding = 1), for higher risk and higher rewards you can increase this parameter. More than 5 is not advised.
I’ve optimized this bot on 15min time frame. It has some decent results for most cryptos on this TF, feel free to test this out.
In case you want to hook this bot up to your exchange, feel free to edit the ALERT messages in the code.
Default Trading Rules:
Long: RSI crosses over 35
Close Long: RSI crosses under 75
Emergency Exit: RSI crosses under 10

ELIA MULTI INDICATORS STRATEGYExperimental multi indicators strategy, to catch right entry and avoid noise.
Each indicator included in the strategy, assume a value based on its status and because is a trend-follow strategy, some indicator value are higher then the other
Backtested on ETHUSDTPERP
BINANCE:ETHUSDTPERP

Scalping Dips On Trend (by Coinrule)Coinrule's Community is an excellent source of inspiration for our trading strategies.
In these months of Bull Market, our traders opted mostly on buy-the-dips strategies, which resulted in great returns recently. But there has been an element that turned out to be the cause for deep division among the Community.
Is it advisable or not to use a stop-loss during a Bull Market?
This strategy comes with a large stop-loss to offer a safer alternative for those that are not used to trade with a downside protection.
Entry
The strategy buys only when the price is above the Moving Average 50 , making it less risky to buy the dip, which is set to 2%.
The preferred time frame is 1-hour.
The stop-loss is set to be quite loose to increase the chances of closing the trade in profit, yet protecting from unexpected larger drawdowns that could undermine the allocation's liquidity.
Exit
Stop loss: 10%
Take Profit: 3%
In times of Bull Market, such a trading system has a very high percentage of trades closed in profit (ranging between 70% to 80%), which makes it still overall profitable to have a stop-loss three times larger than the take profit.
Pro tip: use a larger stop-loss only when you expect to close in profit most of the trades!
The strategy assumes each order to trade 30% of the available capital and opens a trade at a time. A trading fee of 0.1% is taken into account.

Volume RSI Crypto This is a special version RSI, in this case , I am using the volume, which is measuring the speed and change of volume to the price both up and down size.
Volume RSI attempts to gauge price trend changes via changes in bullish and bearish movements.
Its formula is :
VoRSI = 100 - 100 / (1 + VoRS)
where VoRS is Volume Relative Strength over specified period which is calculated as a ratio between averages of Up-Volumes and Down-Volumes:
VoRS = (Average Up-Volume) / (Average Down-Volume)
The logic for this strategy is simple
We entry long when we have a crossover with the Overbought level and we entry short when we have a crossunder with oversold level.
If you have any questions, please let me knw !

Simple BTC scalper 1minThis is a simple but effiecient 1 min scalper for BTC pairs
Its made of EMA 200 and Stochastic RSI.
Rules are simple :
For long we check that close is above the EMA and that stochastic crosses on the 20 level.
For short we check that close is below the EMA and that stochastic crosses above the 80 level.
We exit long when we enter short, and viceversa for short.
If there are any questions, please let me know !

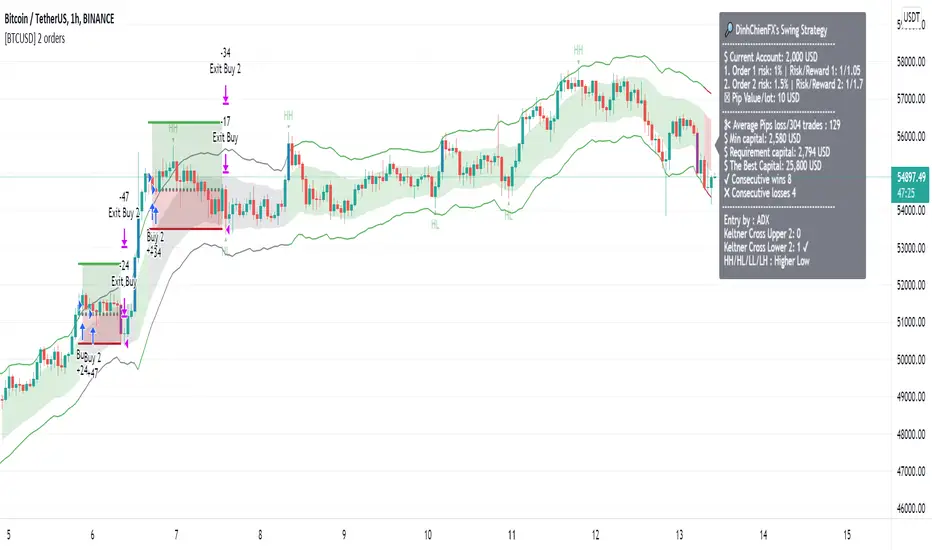
[BTCUSD] DinhChienFX [2 orders]* Historical statistics from 2018:
* Strategy will enter 2 orders, Order 2 will appear only when there is Order 1:
- Percent profitable of 1st order: 64.76%.
- Percent profitable of 2nd order: 49.86%.
- Average percent profitable: 57.31%.
- 14 consecutive wins.
- 4 consecutive losses.
Order 1: risk / reward ratio 1/1 used to determine if this rule is effective or not?
Order 2: Appears when there is order 1, Use take-profit and take-loss level of order 1 at Fibonacci 75%.
. * 1st Order conditions:
- Buy: When the ADX index cuts up to 45, check earlier if the closing price has cut up and is above the Upper 2 line, enter the Buy order.
- Sell: when the ADX indicator cuts up to 45, check before that if the closing price has cut down and is above Lower 2 then enter a Sell order.
* How to enter Order 2: When order 1 appears, there are always Stoploss and Takeprofit levels. Draw Fibonacci from take-profit and take-loss prices, Fibonacci retracement level = 75%
----------------
1. Trend identification:
- Channel Keltner:
... Uptrend: when the closing candlestick cuts up and is above the Keltner channel, the Upper Line 2
... Down trend: when the candle closes and falls above the Keltner Line Lower 2
2. Rules of entry:
- Channel Keltner:
... Buy: Candlestick closing price cuts up and above the Keltner Upper 2.
... Sell: The closing price of the candle cuts down and is lower than the Keltner Below 2.
ADX indicator:
... Buy: The ADX value crossed to 45 and the close of the candle was higher than Keltner Upper 2.
... Sell: ADX value cuts to 45 and the close of the candle is lower than Keltner Below 2.
3. Stoploss and Profit = atr (20) * 2.
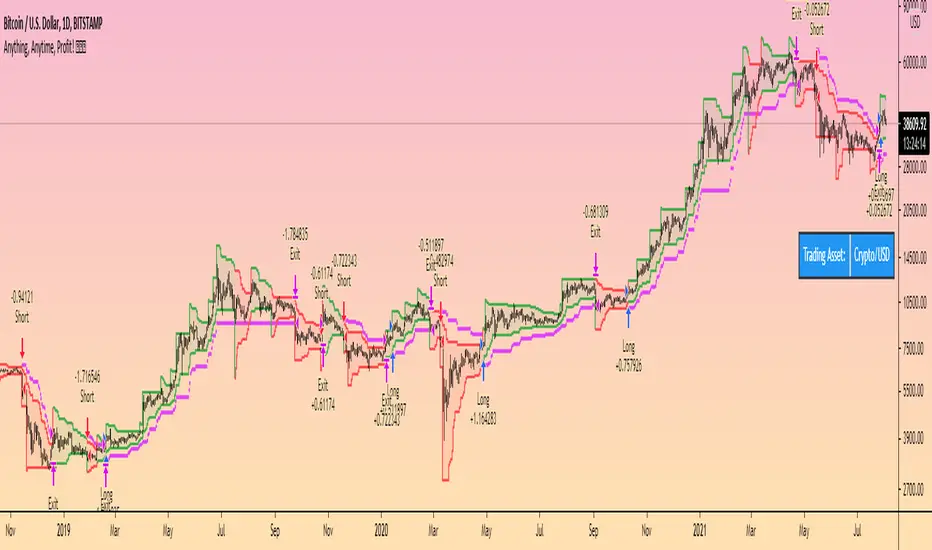
Bull Market Trend Following StrategyThis Bull Market Trend Following Strategy is perfect for long or short term Crypto or traditional market trading and investing.
It is based mainly on the ATR indicator and will therefore adapt to any market conditions and volatility.
It has a number of variable options to try and maximise gains, including stop loss and take profit points, and the ability to wait for pullbacks.
Please let me know if you find any optimal settings, and don't hesitate to ask any questions I'm always happy to help.
Thanks a lot.
Flawless Victory Strategy - 15min BTC Machine Learning StrategyHello everyone, I am a heavy Python programmer bringing machine learning to TradingView. This 15 minute Bitcoin Long strategy was created using a machine learning library and 1 year of historical data in Python. Every parameter is hyper optimized to bring you the most profitable buy and sell signals for Bitcoin on the 15min chart. The historical Bitcoin data was gathered from Binance API, in case you want to know the best exchange to use this long strategy. It is a simple Bollinger Band and RSI strategy with two versions included in the tradingview settings. The first version has a Sharpe Ratio of 7.5 which is amazing, and the second version includes the best stop loss and take profit positions with a Sharpe Ratio of 2.5 . Let me talk a little bit more about how the strategy works. The buy signal is triggered when close price is less than lower Bollinger Band at Std Dev 1, and the RSI is greater than a certain value. The sell signal is triggered when close price is greater than upper Bollinger Band at Std Dev 1, and the RSI is greater than a certain value. What makes this strategy interesting is the parameters the Machine Learning library found when backtesting for the best Sharpe Ratio. I left my computer on for about 28 hours to fully backtest 5000 EPOCHS and get the results. I was able to create a great strategy that might be one of TradingView's best strategies out on the website today. I will continue to apply machine learning to all my strategies from here on forward. Please Let me know if you have any questions or certain strategies you would like me to hyper optimize for you. I'm always willing to create profitable strategies!
P.S. You can always pyramid this strategy for more gains! I just don't add pyramiding when creating my strategies because I want to show you the true win/loss ratio based buying one time and one selling one time. I feel like when creating a strategy that includes pyramiding right off the bat falsifies the win rate. This is my way of being transparent with you all. Have fun trading!

Companion::InsurgentCompanion::Insurgent is a combined indicators strategy. Performances are pretty good on 1D, 4H and 1H timeframes and it can be used on Bitcoin and Altcoin markets.
Mainly, it is a trategy based on Ehlers formulas.
Used indicators:
- Ehlers Instantaneous Trend: trendline analysis;
- Ehlers Super Bandpass Filter: momentum detection;
- EMA: Long/Short time selector.
What the script does:
- determines trendlines combining mulitple indicators;
- automaticlally calculates Take profit and Stop Loss levels;
- permits automation generating Autoview signals (create an alert with {{strategy.order.alert_message}} in message text field to trap Autoview commands;
- supports for margin trading. Spot trading will be added in the future.
BACKTESTING
Backtest is not leveraged. Defaults are set as follow:
Capital: 10000
Percent of equity used for trades: 10%
Commission: 0.18% this is Bitfinex commission on orders
Change them accordingly on how you trade to get a more realistic backtest results.
