ape[x] gooseBangerPowered by apeX trading algorithm
Suitable for all 5m time frame and every market of this world including cryptocurrencies, forex, traditional stocks and options.
Discord for more info : discord.gg/3NXpFYB
Bitcoin (Kriptopara)

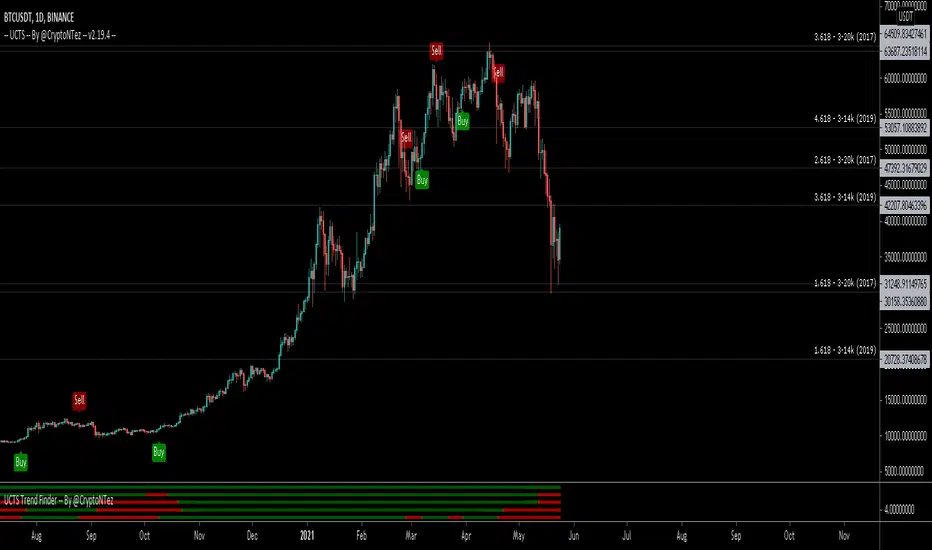
UCTS Trend Finder -- By @CryptoNTezUCTS Trend Finder is an additional feature of the well known UCTS Indicator
Easy and profitable strategy optimized for Crypto.
This script will plot green or red colors based on the UCTS Signals on different timeframes.
The script is optimized to catch trend movements as soon as possible and maximize profitability.
If you want access send me a PM on Tradingview or a DM in twitter @CryptoNTez.
Best regards and happy trading.

Broly Returnsthis is a study created on pine v4, gives u a lot of usefull information about the trend, as u can see we have AVERAGE TRUE RANGE BANDS, also simple moving average, buy when green appears, and sell when the red come over, good trading bye.

Intelligent Exponential Moving Average Private AccessView the full documentation on this indicator here: www.kenzing.com
Note: This indicator is now intended for those who have been granted private access and may be more frequently updated than the previous versions.
Introduction
This indicator uses machine learning (Artificial Intelligence) to solve a real human problem.
The Exponential Moving Average ( EMA ) is one of the most used indicators on the planet, yet no one really knows what pair of exponential moving average lengths works best in combination with each other.
A reason for this is because no two EMA lengths are always going to be the best on every instrument, time-frame, and at any given point in time.
The " Intelligent Exponential Moving Average " solves the moving average problem by adapting the period length to match the most profitable combination of exponential moving averages in real time.
How does the Intelligent Exponential Moving Average work?
The artificial intelligence that operates these moving average lengths was created by an algorithm that tests every single combination across the entire chart history of an instrument for maximum profitability in real-time.
No matter what happens, the combination of these exponential moving averages will be the most profitable.
Can we learn from the Intelligent Moving Average?
There are many lessons to be learned from the Intelligent EMA . Most will come with time as it is still a new concept. Adopting the usefulness of this AI will change how we perceive moving averages to work.
Limitations
Ultimately, there are no limiting factors within the range of combinations that has been programmed. The exponential moving averages will operate normally, but may change lengths in unexpected ways - maybe it knows something we don't?
Thresholds
The range of exponential moving average lengths is between 5 to 40.
Additional coverage resulted in TradingView server errors.
Future Updates!
Soon, I will be publishing tools to test the AI and visualise what moving average combination the AI is currently using.
Follow and like for more content!

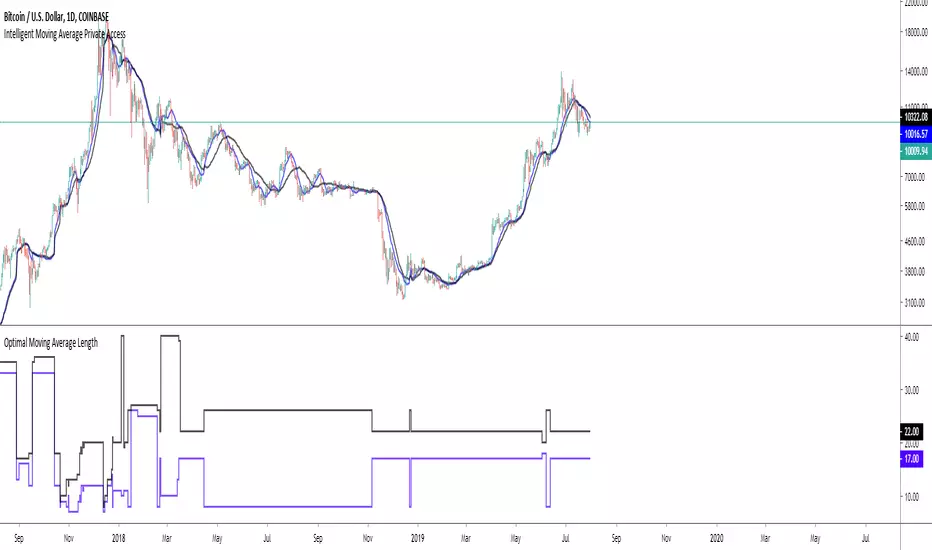
Intelligent Moving Average Private AccessNote: This indicator is intended for those who have been granted private access and may be more frequently updated than the previous versions.
Introduction
This indicator uses machine learning (Artificial Intelligence) to solve a real human problem.
The Moving Average is the most used indicator on the planet, yet no one really knows what pair of moving average lengths works best in combination with each other.
A reason for this is because no two moving averages are always going to be the best on every instrument, time-frame, and at any given point in time.
The " Intelligent Moving Average " solves the moving average problem by adapting the period length to match the most profitable combination of moving averages in real time.
How does the Intelligent Moving Average work?
The artificial intelligence that operates these moving average lengths was created by an algorithm that tests every single combination across the entire chart history of an instrument for maximum profitability in real-time.
No matter what happens, the combination of these moving averages will be the most profitable.
Can we learn from the Intelligent Moving Average?
There are many lessons to be learned from the Intelligent Moving Average. Most will come with time as it is still a new concept.
Adopting the usefulness of this AI will change how we perceive moving averages to work.
Limitations
Ultimately, there are no limiting factors within the range of combinations that has been programmed. The moving averages will operate normally, but may change lengths in unexpected ways - maybe it knows something we don't?
Thresholds
The range of moving average lengths is between 5 to 40.
Additional coverage resulted in TradingView server errors.
Future Updates!
This indicator will be maintained and many updates will come in the near future! Stay tuned.
View the documentation on this indicator here: www.kenzing.com
Tenkan Kijun Cross AlertTenkan Kijun cross alert, best used alongside a Volume indicator to help aid with finding those trend continuation patterns.
I prefer to use the Chaikin Money Flow, when it indicates and holds above the 0 line then you will bias Longs, and when below then you will Bias shorts
If you like this then please donate
BTC: 1LRbUgrkvFLQ5Mt7C62EJRD9aMvhDNT22K
ETH: 0xa509b89bccb788234278eFE63470c10946E26F3c
LTC: LV7MUr6arvCffS5N6pbTWgav5S3Yi1Eejp

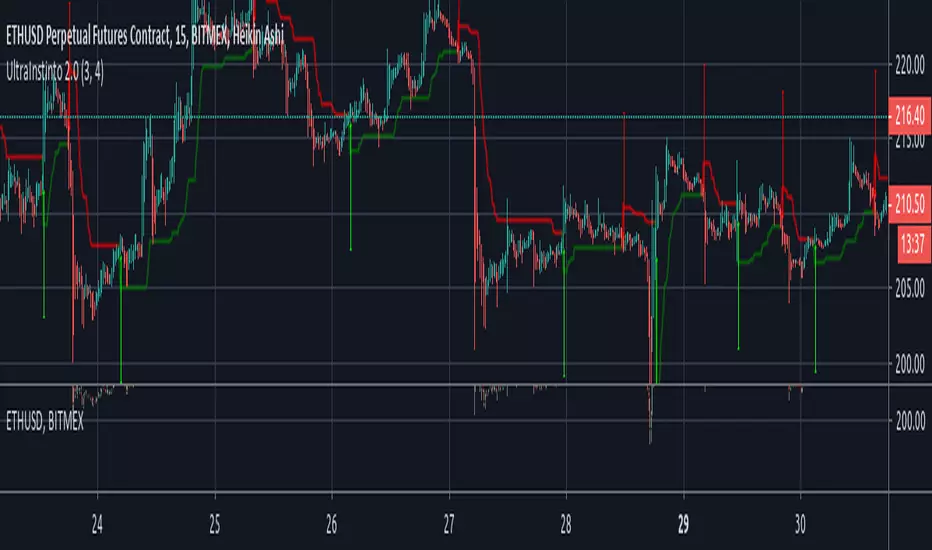
UltraInstinto 2.0BITMEX:ETHUSD
UltraInstinto 2.0 is a trend hunter tool, based on the latest artificial inteligence algorithms it can take decisions on real time, on any frametime, buy when the green arrow appears, and sell when the red arrow appears, easier than play fortnite, and returns you a lot of money
Eunsa Bit_Teaching - pub> 매매 진행중에, 간헐적으로 도움을 받아 볼 수 있는 보조지표입니다
> 절대적인 지표가 아니며, 말 그대로 보조적으로 해당 시장상황에 맞춰 참조, 참고가 가능한 지표입니다
* 매수Position은 총 2차 분할매수로 이루어집니다
> Long (-) : 매수 Signal (1차 분할 매수진입) > Long(-) 1차 분할매수 진입이후, 재차 뜬다면 재진입이 가능하다는 Signal
> Long (+) : 매수 Signal (2차 분할 매수진입) > Long(+) 2차 분할매수 진입 영역입니다
> 따라서, Long(-) 2 ~ 3번 뜬다고, 2 ~ 3번 계속 누적진입 하는 것이 아니라, Long(-) 에 1번 진입입니다, 진입했는데 또 뜬다면 재진입이 가능하다고 인식하시면 됩니다
* 매도Position은 총 2차 분할매도로 이루어집니다
> Short (-) : 매도 Signal (1차 분할 매도진입) > Short(-) 1차 분할매도 진입이후, 재차 뜬다면 재진입이 가능하다는 Signal
> SHort (+) : 매도 Signal (2차 분할 매도진입) > Short(+) 2차 분할매도 진입 영역입니다
> 따라서, Short(-) 2 ~ 3번 뜬다고, 2 ~ 3번 계속 누적진입 하는 것이 아니라, Short(-) 에 1번 진입입니다, 진입했는데 또 뜬다면 재진입이 가능하다고 인식하시면 됩니다
> Long Danger : 급격한 매도세 감지
> Short Danger : 급격한 매수세 감지
(* Long Danger 가 뜬경우, 과매도권이라 보통의 경우 해당 시점부터 반등이 진행되는 경우가 많으며, Bear Trap일 경우가 많습니다. 그러나, 저같은 경우 안전하게 Long Danger시 Long Position에 대한 손절을 진행하며, 손절Sign 으로 인식합니다)
(* Short Danger 가 뜬경우, 과매수권이라 보통의 경우 해당 시점부터 조정이 진행되는 경우가 많으며, Bull Trap일 경우가 많습니다. 그러나, 저같은 경우 안전하게 Short Danger시 Short Position에 대한 손절을 진행하며, 손절Sign으로 인식합니다)
> Long 진입자를 위해, Long TP가 제공되오나 익절은 자유에 맡기고 있습니다
> Short 진입자를 위해, Short TP가 제공되오나 익절은 자유에 맡기고 있습니다
> TP에 꼭 익절하신다는 느낌보다 보조적으로 보시는게 좋습니다
* 가장 중요 *
> Long Term (장기추세) : Long Trend or Short Trend 표기
> Short Term (단기추세) : Long Trend or Short Trend 표기
> 장기추세와 단기추세가, 실시간으로 즉각 차트에 표기가 되어집니다
> 해당 경우를 응용하여 사용하는 경우에 대해서 예시를 보겠습니다
예시1)
- Long Term : Long / Short Term : Long => 장기추세와 단기추세가 모두 Long일 경우, 장기/단기추세가 상승추세를 의미합니다
- 예시1의 상황이 발생할 경우, 추세트레이딩을 하신다면 Short Signal이 나와도 Short 진입에 대해서 고려하지 않습니다
- 예시1의 상황이 발생할 경우, 추세트레이딩으로써 Long 진입에 대해서만 집중합니다
- 예시1의 상황이 발생할 경우, 역추세트레이딩을 하신다면 Short Signal이 나올 시, 진입하여 짧게 먹고 나옵니다
- 역추세트레이딩은 길게 가져 가는것이 결코 아닙니다
예시2)
- Long Term : Short / Short Term : Short => 장기추세와 단기추세가 모두 Short일 경우, 장기/단기추세가 하락추세를 의미합니다
- 예시2의 상황이 발생할 경우, 추세트레이딩을 하신다면 Long Signal이 나와도 Long 진입에 대해서 고려하지 않습니다
- 예시2의 상황이 발생할 경우, 추세트레이딩으로써 Short 진입에 대해서만 집중합니다
- 예시2의 상황이 발생할 경우, 역추세트레이딩을 하신다면 Long Signal이 나올 시, 진입하여 짧게 먹고 나옵니다
- 역추세트레이딩은 길게 가져 가는것이 결코 아닙니다
예시3)
- Long Term : Long / Short Term : Short
=> 장기추세와 단기추세가, 엇갈린 순간
=> 시장의 굉장한 급격한 변동과 추세돌파 및 이탈시점을 의미하며, 이경우 장기추세와 단기추세가 서로 엇갈림을 의미함
=> 해당 경우가 발생할 경우, '추세의 모호함'이라 칭하며, 장세의 방향이 어느곳으로 튈 지 추세가 정확히 잡히지 않은 상황을 의미함
=> 보수적, 안정적으로 트레이딩을 하신다면, '추세의 모호함'이 발생할 경우 매매진입은 고려하지않으며, 관망합니다
예시4)
- Long Term : Short / Short Term : Long
=> 예시3) 과 같습니다
*** 가장 중요 한 것 ***
> 해당 지표는, 말 그대로 보조지표 입니다
> 수익에 대해서 보장 하지 않으며, 손실이 날 수 있습니다
> 오히려, '손절' 에 대한 'Danger' 경고 표시를 함으로써, 해당 지표를 참조, 참고 함으로써 '수익극대화'보다는 '손실최소화'에 중점을 맞추고 있습니다
> 진입에 대한 Risk/Reward (손익비)가 최소 1:1 ~ 1:2 비율로 잡혀지게끔, 알고리즘이 짜여있습니다
> '손절'에 대한 경고를 표시함으로써, 승률 100%를 목표로 하는게 아니며, 승률 51~55% 정도를 겨냥하여 최대한 안정적 보수적인 '손실최소화' 중점의 지표입니다

Dollar Cost Average (Data Window Edition)Hi everyone
Hope you had a nice weekend and you're all excited for the week to come. At least I am (thanks to a few coffee but that still counts !!!)
This indicator is inspired from Dollar-Cost-Average-Cost-Basis
EDUCATIONAL POST
The educational post is coming a bit later this afternoon explaining how to use the indicator so I would advise to follow me so that you'll get updated in real-time :) (shameless self-advertising)
1 - What is Dollar-Cost Averaging (DCA)?
Dollar-Cost Averaging is a strategy that allows an investor to buy the same dollar amount of an investment on regular intervals. The purchases occur regardless of the asset's price.
I hope you're hungry because that one is a biggie and gave me a few headaches. Happy that it's getting out of my way finally and I can offer it
This indicator will analyse for the defined date range, how a dollar cost average (DCA) method would have performed vs investing all the hard earnt money at the beginning
2- What's on the menu today ?
Please check this screenshot to understand what you're supposed to see : CLICK ME I'M A SCREENSHOT (I'll repeat this URL one more time below as I noticed some don't read the information on my description and then will come pinging me saying "sir me no understand your indicator, itz buggy sir"
(yes I finally thought about a way to share screenshots on TradingView, took me 4 weeks, I'm slow to understand things apparently)
My indicator works with all asset classes and with the daily/weekly/monthly timeframes
As always, let's review quickly the different fields so that you'll understand how to use it (and I won't get spammed with questions in DM ^^)
- Use current resolution : if checked will use the resolution of the chart
- Timeframe used for DCA : different timeframe to be used if Use current resolution is unchecked
- Amount invested in your local currency : The amount in Fiat money that will be invested at each period selected above
- Starting Date
- Ending Date
- Select a candle level for the desired timeframe : If you want to use the open or close of the selected period above. Might make a diffence when the timeframe is weekly or monthly
3 - Specifications used
I got the idea from this website dcabtc.com and the result shown by this website and my indicator are very interesting in general and for your own trading
The formula used for the DCA calculation is that one : Investopedia Dollar Cost Average
4 - How to interpret the results
"But sir which results ??"...... those ones : CLICK ME I'M A SCREENSHOT :) (strike #2 with the screenshot)
It will draw all the plots and will give you some nice data to analyze in the Data Window section of TradingView
I'm not completely satisfied with the tool yet but the results are very closed to the dcabtc website mentioned above
If you're trading a very bullish asset class (who said crypto ?), it's very interesting to see what a DCA strategy could bring in term of performance. But DCA is not magic, there is a time component which is the day/week/month you'll start to invest (those who invested in crypto beginning of 2018 in altcoins know what I'm talking about and ..............will hate me for this joke)
5 - What's next ?
As said, the educational post is coming next but not only.
Will probably post a strategy tomorrow using this indicator so that you can compare what's performing best between your trading and a dollar cost average method
I'll publish as a protected source this time a more advanced version of that one including DCA forecasts
6 - Suggested alternative (but I'll you doing it)
If you don't want to have this panel in the bottom with the plots and analyze the results in the data window, you can always create an infopanel like shown here Risk-Reward-InfoPanel/ and display all the data there
Hope you'll like it, like me, love it, love me, tip me :)
____________________________________________________________
Feel free to hit the thumbs up as it shows me that I'm not doing this for nothing and will motivate to deliver more quality content in the future. (Meaning... a few likes only = no indicators = Dave enjoying the beach)
- I'm an offically approved PineEditor/LUA/MT4 approved mentor on codementor. You can request a coaching with me if you want and I'll teach you how to build kick-ass indicators and strategies
Jump on a 1 to 1 coaching with me
- You can also hire for a custom dev of your indicator/strategy/bot/chrome extension/python

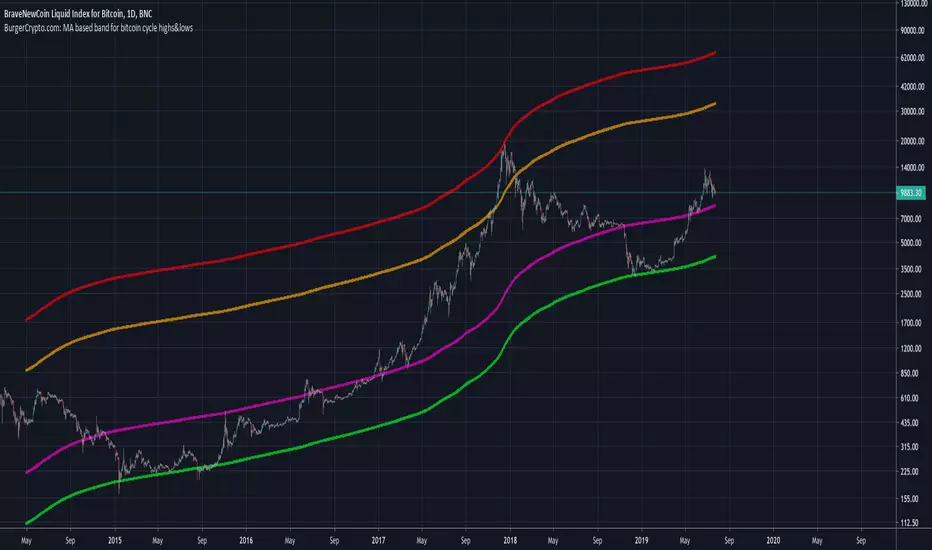
BurgerCrypto.com: MA based band for bitcoin cycle highs&lowsWarning: This script works only on a daily chart and only works for bitcoin charts with a long history. Best to be used on the BLX chart as it goes back to July 2010.
This script shows you the Moving Average with the length of a full bitcoin cycle, in which a cycle is defined as a period between two reward halvings; i.e. 210.000 blocks.
After data analysis in Python, I found that the average inter arrival time is a bit lower than the often communicated 10minutes; it's 9.46minutes, which makes the 210.000 block interval equal to 1379days.
The 1379d Moving Average seems to serve well as a support for the price of bitcoin over time and it's 4th 2^n multiple did a good job in catching the cycle tops.
If you like this indicator, please leave some claps for the Medium article in which I introduced this indicator:
medium.com
BitMEX Funding Visual by Mcrypt28This is a modified script originating from user m59 that better visually represents the BitMEX funding trend over time. Green indicates the funding is positive (longs pay shorts every 8 hours to maintain their position) and red indicates the funding is negative (shorts pay longs). The darker the color means the higher the rate. The unproven theory is that the funding helps to identify what retail investors are doing at a given time. Thus, in downtrends as the negative funding is drying up, a low may be near. In uptrends, as the funding remains negative, retail is generally bearish and continues to sell as institutional investors likely are absorbing. Vice versa for when the funding is positive. In any market in general, money flows from the many to the few. That means whatever retail is doing is generally the opposite of what will be the actual outcome. One more modifier to the m59 script is that volume is factored into the calculation which will impact which threshold (opacity on the chart) it falls within.
If you'd like to chart the BitMEX funding yourself, I'd recommend checking out the source from m59's indicator as that is more likely to stay up to date if BitMEX makes any changes to the way funding is calculated. The source if this is protected for that reason.

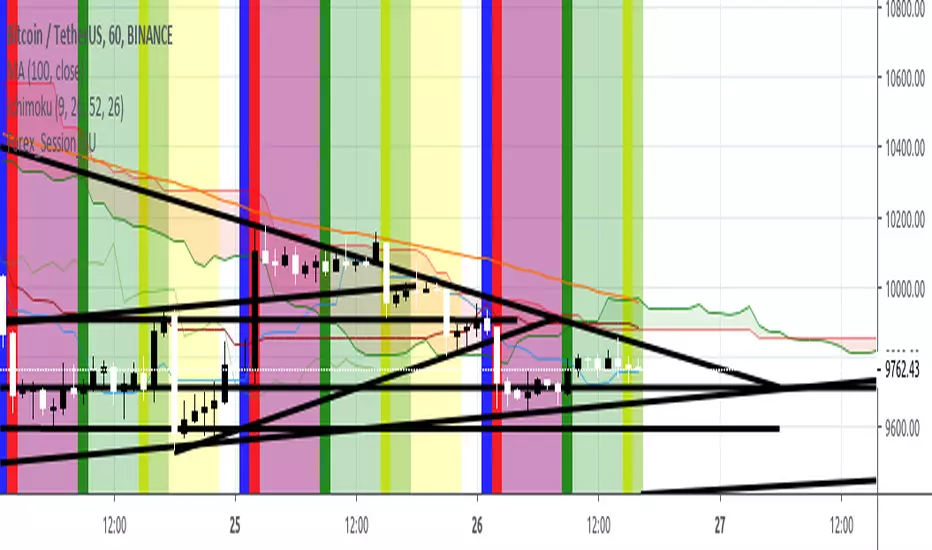
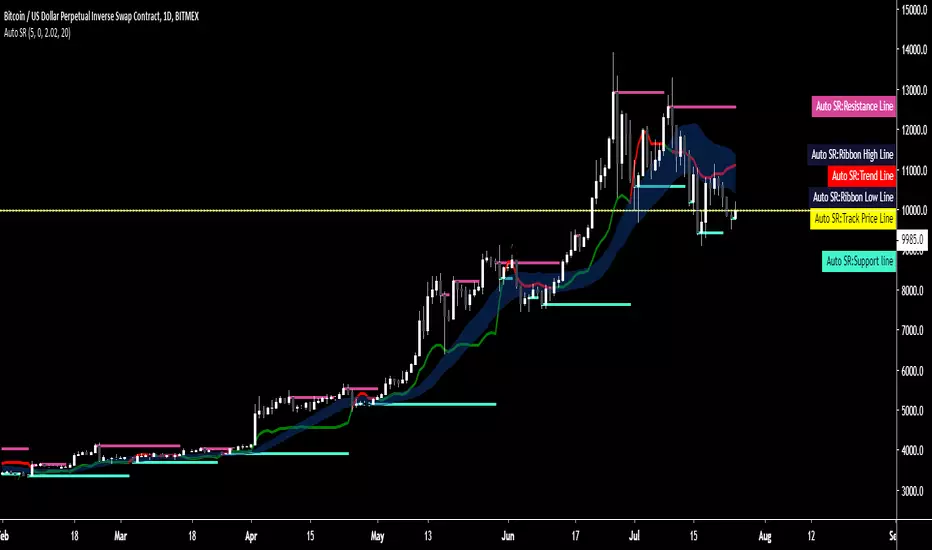
Auto SR - Automatic Support & ResistanceAuto SR is an indicator for TradingView™ which automatically searches and prints key support and resistance levels.
Its strength lies within its ability to provide visualization in real-time to aid in your trading.
It's a versatile indicator suitable for both short or long time frames and has a precision of 8 decimal points, therefore making it suitable for any market type.
A trend line shows a shift in major trends while a ribbon shows you shifts in smaller trends and indications are given for break and re-entry of both support and resistance levels.
All conditions are coupled with their own alerts, giving you the option to integrate it into your trading system or receive alerts on-the-fly.
Tried, true and tested for over one year, Auto SR has already become a trusted staple of those who've experienced it.
As a standalone system or an addition to your existing strategy, Auto SR has what it takes to elevate your trading to the next level.
Key Features:
- Automatic charting of support and resistance lines charted in real-time, no repainting.
- Major and minor trend detection
- Full alerts for support and resistance forming, price exiting or re-entering lines, trend shifts and more.
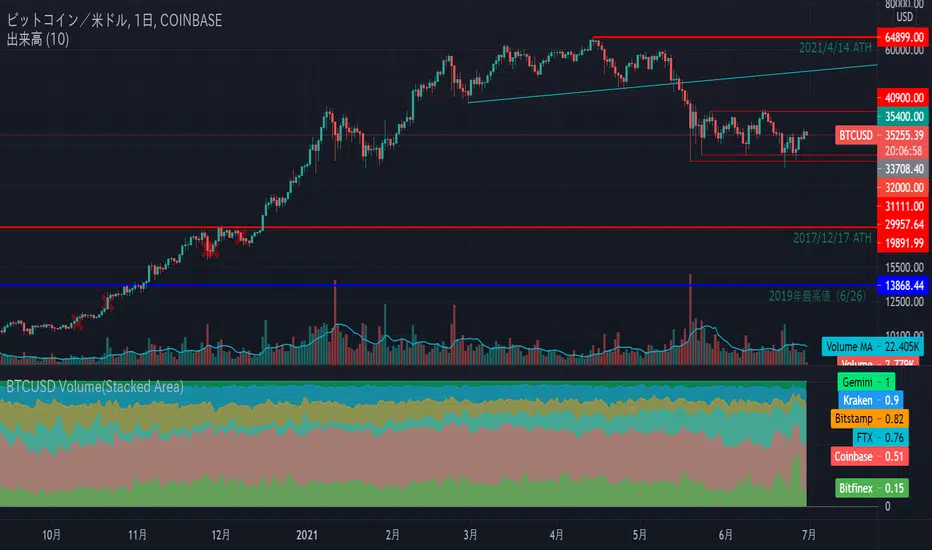
BTCUSD Volume(100 Percent Stacked Area Chart)
Display the volume of 4 exchanges with BTC / USD pair in 100% stacked area chart.
The target exchanges are 3 companies that BitMEX refers to indexes (Coinbase, Bitstamp, Kraken).
And I'm adding Bitfinex, which I think has a strong impact on the market.
If you uncheck the "100 Percent Stacked Area Chart", the volumes of each exchange will be displayed in piles.
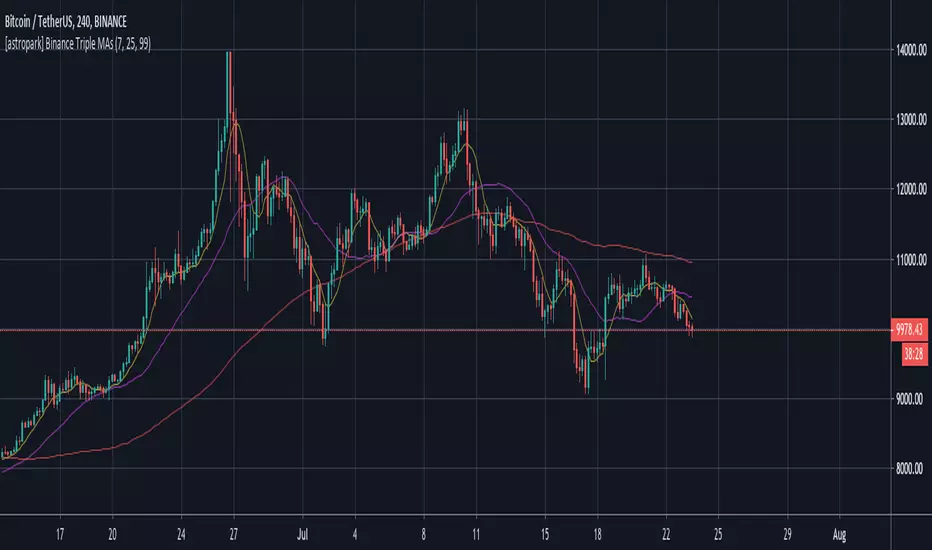
[astropark] Binance Triple MAsDo you miss Binance basic MAs series on your trading view chart?
Enjoy!
Oversold/Overbought RSI backgroundOften a background color is way better of an indicator.
Now you can directly see in your chart when price is in Oversold (red) or in Overbought (green), based on RSI analysis.
Enjoy!

[astropark] 21 days EMAAre you tired to edit you EMA indicator to fit the 21-day settings for your timeframe?
Now you have it for free!
Enjoy!

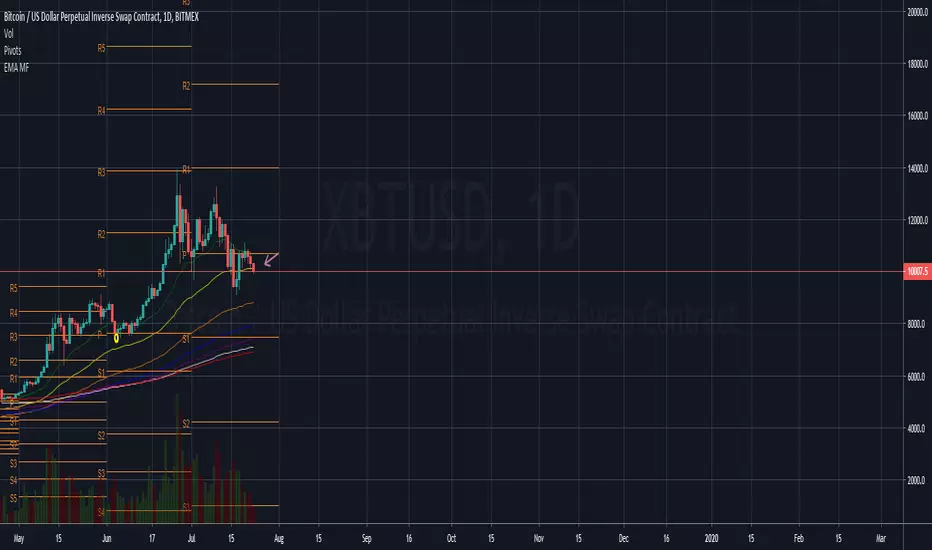
EMA MF - EMA (21,50,100,200,250,300)Hey guys
a simple script for some EMA's at one indicator
For signals news TA and more join BitcoinMF
Links are at the TV profile
--
This is not financial advice
DYOR
Trade Safe and Good Luck
DBT MoMo v.4DBT MOMO
Introduction: The MoMo is a TradingView indicator designed to evaluate momentum and give the user signals according to momentum shifts, strength, extensions, traps, and divergence. It’s an all in one oscillator that will make reading price action near term and long term much easier.
Part One: Strength
The MoMo consist of two major parts. A 3-candle back formula and a 24-candle back formula. The 3-candle back is called the Price Line (the histogram on the MoMo). The 24-candle back is called the Trend Line (the line on the MoMo). Both lines are placed into a range from 20 to -20. It can go higher than 20 or lower than -20, but this is extremely rare and short lived.
A positive number indicates a bullish bias, a negative number indicates a bearish bias. When the Price or Trend line are ascending while below 0 this indicates that the bearish momentum is weakening. When the Price or Trend line are descending while above 0 this indicates that the bullish momentum is weakening.
In a strong trend the Trend Line will likely flatten out around 15 or -15. While the Trend Line is flat the Price Line will likely shift rapidly, this can lead to bull and bear traps, we will discuss this in the Trap section.
A rare, but powerful signal from the MoMo is when the Price and Trend Lines “pinch” and begin to move in the same direction. If this is happening the trader should be looking to follow the direction of these lines.
Part Two: Extensions
When both Price and Trend Lines are above 10 or below -10 this will begin to signal an extension.
Purple: Indicates the bears are extended to the downside and a pullback or trend reversal upward is likely.
Gold: Indicates the bulls are extended to the upside and a pullback or trend reversal downward is likely.
When only the Trend Line is above 10 the MoMo will shade the upper range red. This indicates the Trend is becoming bullish or entering an extension. If the Trend Line cannot maintain above 10 for long and breaks below 10 this indicates it’s an extension and trend will most likely continue downward.
When only the Trend Line is below -10 the MoMo will shade the upper range green. This indicates the Trend is becoming bearish or entering an extension. If the Trend Line cannot maintain below -10 for long and breaks above -10 this indicates it’s an extension and trend will most likely continue upward.
When the green or purple shading have turned off take the lowest point, this is considered a support level or a local bottom.
When the red or gold shading have turned off take the highest point, this is considered a resistance level or a local top.
The trader can preemptively trade the purple or gold warnings but be warned these warnings can go on for a long time if the trend is very strong. It is the same mentality of an overbought or oversold RSI, except the MoMo extensions have a much higher strike rate.
To avoid preemptively trading these extensions the trader should wait for confirmation on the Price Line and on price action. The Price Line (histogram) should be moving upward during a purple extension to begin showing a bottom. The Price Line (histogram) should be moving downward during the gold extension to begin showing a top.
Part Three: Traps
The relation between the Price Line and Trend Line can create trading signals for bull and bear traps. When the Trend Line is flattened out around 15 or -15, indicating a strong trend is in place, and the Price Line is rapidly moving towards the midline this may indicate a trap is forming.
When the Trend Line is flat around 15 and the Price Line begins moving towards 0, if the Price Line reaches 0 or close to 0 and the Trend Line is still flat, a trap has begone. Once the Price Line shifts from decreasing (red) to increasing (green) the trap is playing out. Therefore, the trader should look to exit short positions or enter long positions.
When the Trend Line is flat around -15 and the Price Line begins moving towards 0, if the Price Line reaches 0 or close to 0 and the Trend Line is still flat, a trap has begone. Once the Price Line shifts from increasing (green) to decreasing (red) the trap is playing out. Therefore, the trader should look to exit long positions or enter short positions.
Part Four: Divergences
The MoMo is exceptional at finding divergences with the Price Line and occasionally the Trend Line.
To find a divergence with the MoMo the trader must look for when the histogram is not following price action completely.
Bullish Divergence: Price makes a lower low, MoMo makes a higher low.
Bearish Divergence: Price makes a higher high, MoMo makes a lower high.
Hidden Bull Divergence: Price makes a higher low, MoMo makes a lower low.
Hidden Bear Divergence: Price makes a lower high, MoMo makes a higher high.
For Access or Questions: Private message us. Thank you.

Oasis Trading SuiteOasis Trading Suite
Introduction: The Oasis Trading Suite is a TradingView indicator designed to make following trend and finding key pivot points very easy. It provides the trader with advanced trend coloring for candles, pivot points both high and low, and a trail that will follow price and give signals when a “buy the dip” or “sell the rally” opportunity is presented.
Part One: Candle Coloring
The Oasis Trading Suite colors candles based on a trending bullish or bearish bias; this will override the default red/green coloring of candles which is based on closes.
Bullish Candles will be denoted with a green color by default.
Bearish Candles will be denoted with a red color by default.
Neutral Candles will be denoted with a gray candle by default. These are candles that do not have a trending bias.
Part Two: Pivots
In addition to the normal red/green/gray candles there are also blue and orange candles. These candles are pivot bars.
Blue bars denote Bottom Pivots
Orange bars denote Top Pivots
These pivots are not exactly support and resistance, but more of a zone of influence. They can act as support and resistance, swing zones, and breakout points. These are not standard pivots, they do not repaint, they form live and once closed will not move candles.
Part Three: Trail
Finally, the Oasis Trading Suite gives the trader a trailing line that will turn green or red depending on trend. If price falls to the trail and the low (for green trail) is the only thing below the trail it will give a “buy the dip” signal. If the high (for red trail) is the only thing above the trail it will give a “sell the rally” signal. This trail is slightly lagging, so when trend is shifting there will sometimes be false signals at the final shifting point. I am experimenting with removing as many as possible using the “Strict Mode” found in the input settings for the Oasis Trading Suite.
Buy the Dip will be denoted by a Blue Arrow
Sell the Rally will be denoted by an Orange Arrow
For Access or Questions: Private message us. Thank you.

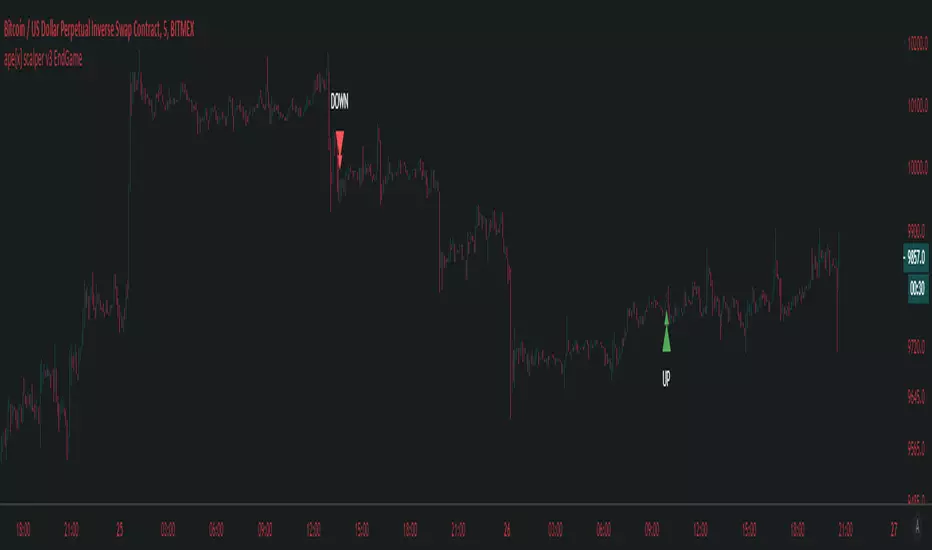
ape[x] 5m scalperSmaller time frame trades and if ape confirms the move feather on the hat 🎩.
Also Helps to take profit/stop in ape swing trades.
Note this is a scalper and works only on 5min timeframe unlike ape (15min).
You can find ape 15m swing trader here :
PA Trend BUYSELLThis is PA Trend BUYSELL Indicator
Ability to Turn on/off Labels
Ability to Change Color
