Rogue Profit Alert IndicatorThis is a complex script developed to measure specific volatility parameters and enter trades based on predetermined rules which are proprietary and will not be released, so don't ask for specific indicator settings.
This indicator accompanies the "Rogue Profit Strategy" and can be used for creating alerts based on the strategy's performance. Please read the more in depth description on the "Rogue Profit Strategy" page. Make sure the input parameters are the same for both the Strategy and Indicator to insure accurate signals.
This is a very powerful and profitable script that will simplify your trading and has been in development and tested for three years. Message for details on how to obtain access. Please allow up to 24 hours for a response.
Bitcoin (Kriptopara)

BTC circulating supply [peregringlk]Just as simple as it sounds. The BTC circulating supply, deduced by using BTC_capitalization / BTCUSD.

Theft Indicator - 5Min Scalping SystemWhat is our indicator?
Theft Indicator - Buy & Sell Alert System is our first published script that shows price action on a certain period of time (We Use ATR indicator). We take pride in enabling trading to become easier for the experienced and the non-experienced traders around the globe. Buy & Sell alerts will be fired once a condition in our algo is met.
Does it Repaint?
Our indicator does NOT re-paint. Although while setting an alert it may pop up the repaint alert, please take into consideration that once a signal is fired on a "CLOSED BAR", our signal will never disappear, they do not repaint.
What Markets is it usable with?
You can use it in any market, Forex, Stocks, Crypto, Indices. All time frames are profitable, not all trades. But the Majority is profitable if you use a stop loss and target price.
How to use:
Simple plug and play it to your chart, in addition to a few other indicators we will recommend to you (we still have not published them yet), and this will confirm your trades. You can also connect TV alerts with a bot and let it run. Please be aware that SLIPPAGE time is important, If you run a bot on this indicator you HAVE to know that the buy/sell price will be on the bar AFTER the Candle close (For example: the BUY/SELL alert is on a candle, the buy/sell your bot or you will execute WILL be in the following candle depending on your trading system. We advise you to not leave the bot to trade on its own, you have to monitor and have a specific syntax that we will help you with creating according to your trading style.
How are the Buy/Sell Alerts fired?
We use the simple ATR (Average True Range) indicator. However we have modified the indicator to serve our trading system. Check below for a definition of what ATR is:
What is Average True Range - ATR?
The average true range (ATR) is a technical analysis indicator that measures market volatility by decomposing the entire range of an asset price for that period. Specifically, ATR is a measure of volatility introduced by market technician J. Welles Wilder Jr. The true range indicator is taken as the greatest of the following: current high less the current low; the absolute value of the current high less the previous close; and the absolute value of the current low less the previous close. The average true range is then a moving average, generally using 14 days, of the true ranges.
Why is our indicator special and different from the normal ATR indicators?
We have modified the mathematical equation and changed it slightly to give more accurate signals, we do not promise all trades are profitable, the use of this indicator is up to your own judgement and liability. We believe that we have an indicator like no other ATR.
P.S: This is not financial advice, we are just sharing our indicator that we know has good results, and it will take time for people in -ve profiles to recover losses and for the profiting to be more profitable. We use a specific trading method that only works with it
You can contact me for more information about the indicator, Goodluck :)

Theft Indicator - BUY/SELL AlertsWhat is our indicator?
Theft Indicator - Buy & Sell Alert System is our first published script that shows price action on a certain period of time (We Use ATR indicator). We take pride in enabling trading to become easier for the experienced and the non-experienced traders around the globe. Buy & Sell alerts will be fired once a conditions in our algo is met.
Does it Repaint?
Our indicator does NOT re-paint. Although while setting an alert it may pop up the repaint alert, please take into consideration that once a signal is fired on a "CLOSED BAR", our signal will never disappear, they do not repaint.
What Markets is it usable with?
You can use it in any market, Forex, Stocks, Crypto, Indices. We recommend high time frames but you can also use it on the 1 minute chart if you are a scalper and a risk taker. All time frames are profitable, not all trades. But the Majority is profitable. We will soon add a backtest strategy for it, there is no ETA on it tho.
How to use:
Simple plug and play it to your chart, in addition to a few other indicators we will recommend to you (we still have not published them yet), and this will confirm your trades. You can also connect TV alerts with a bot and let it run. Please be aware that SLIPPAGE time is important, If you run a bot on this indicator you HAVE to know that the buy/sell price will be on the bar AFTER the Candle close (For example: the BUY/SELL alert is on a candle, the buy/sell your bot or you will execute WILL be in the following candle depending on your trading system. Theft Indicator - Buy/Sell Alerts work best with higher time frames, however it works on smaller time frames, we recommend 15 mins, 30 mins, 1hr, 4hr. It just depends on your trading style. Please contact us if you do not understand how to use it.
How are the Buy/Sell Alerts fired?
We use the simple ATR (Average True Range) indicator. However we have modified the indicator to fit our trading system. Check below for a definition of what ATR is:
What is Average True Range - ATR?
The average true range (ATR) is a technical analysis indicator that measures market volatility by decomposing the entire range of an asset price for that period. Specifically, ATR is a measure of volatility introduced by market technician J. Welles Wilder Jr. The true range indicator is taken as the greatest of the following: current high less the current low; the absolute value of the current high less the previous close; and the absolute value of the current low less the previous close. The average true range is then a moving average, generally using 14 days, of the true ranges.
Why is our indicator special and different from the normal ATR indicators?
We have modified the mathematical equation and changed it slightly to give more accurate signals, we do not promise all trades are profitable, the use of this indicator is up to your own judgement and liability. We believe that we have an indicator like no other ATR because of our algo that is different from the normal ATR calculation.
P.S: This is not financial advice, we are just sharing our indicator that we know has good results, and it will take time for people in -ve profiles to recover losses and for the profiting to be more profitable.
You can contact me for more information about the indicator, Goodluck :)

MAPS - Trend OverlayThis Trend Overlay helps identify areas where there's a strong bullish or bearish trend taking place. Use this overlay to help filter out moments to trade and moments to sit idle.
Green Background - Bullish Trend
Red Background - Bearish Trend
No Background - No Trend
Bars are also coloured Red or Green when it detects strong momentum on top of the normal trend.
Use the link below to obtain access to this indicator

Price CorrelationsThis indicator shows price correlations of your current chart to various well-known indices.
Values above 0 mean a positive correlation, below 0 a negative correlation (not correlated).
It works well with daily candle charts and above, but you may also try it on 1h candles.
The default indices:
- Gold
- S&p 500
- Mini Dow Jones
- Dow Jones
- Russel 2000
- Nasdaq 100
- Crude Oil
- Nikkei 225 (Japan)
- FTSE 100 (UK)
- Silver
- DAX Futures (DE)
You can change the defaults to compare prices with other indices or stocks.

Level KingShows key historical support & resistance (S/R) levels on multiple timeframes
Shows two nearest levels below and above current close price on 2 selected time frames
Option to select timeframes (daily, weekly, monthly, current)
Option to display moving average S/R levels as well (daily and weekly)
Option to display levels for current bar only, or to show all historic S/R levels as they occurred
Strategies include:
Enter or add to long positions on "support" (when price touches a green/blue line)
Enter or add to short positions on "resistance" (when price touches a red/purple line)
Take profit from a long position when a "resistance" level is touched for the first time
Take profit from a short position when a "support" level is touched for the first time

QUICK BITCOIN VALUATION ~ FILBFILBThis indicator uses On chain Transactions and Total Bitcoins to arrive at an under/over valuation.
>1 Overvalued
<1 Undervalued
>2 - Severe Overvaluation
<0.5 Severe Undervaluation
You need to change the scale to Log, i couldn't work out how to do it, if you can tell me i will update the script.
** Review previous day's candles to avoid transactional lag. **

MAPS - VolumeProvides some context to volume:
Green Bars = High Buying Pressure
Red Bars = High Selling Pressure
Yellow Bars = Low Volume
Purple Bars = Exhaustion
Colours at the top represent the current volume trend

Blockchain Data ~ FILBFILBOne Indicator with Blockchain info.
Total Circulating BTC
Number Of Transactions
Miners Revenue
Estimated Transaction Volume USD
Estimated Transaction Volume BTC
Bitcoin Market Cap
Difficulty

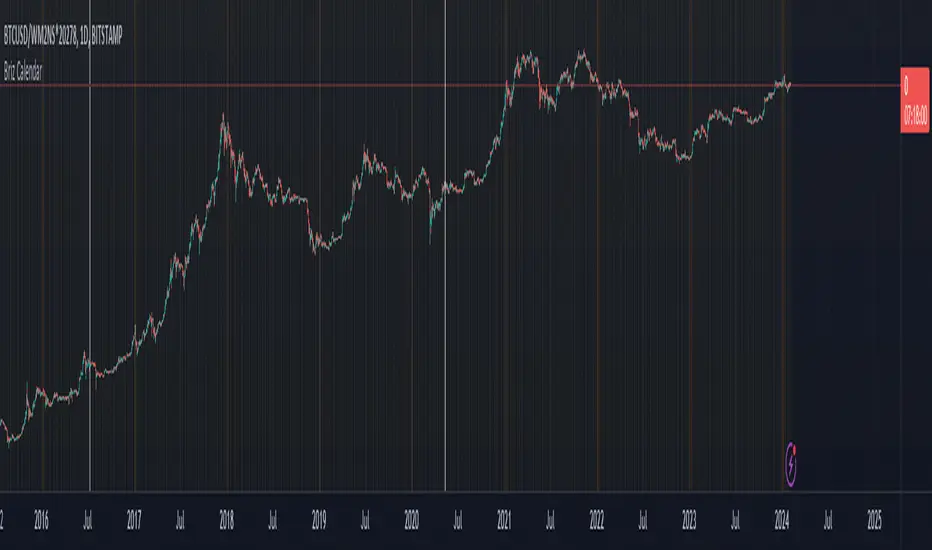
Bitcoin: Price Action Integral BandsThis indicator tries to display absolute tops and bottoms for Bitcoin. The price action gets integrated with two custom functions resulting in the blue top and red bottom price action integrals. From those integral values we allow 5% deviation in up and down direction, leading to price action integral bands of some non-zero width.
Even in the current liquidity crisis with abnormal price movements, Bitcoin had no weekly candle close below the support band. One thing to note is that in the here presented model, up until now only one single weekly candle touches the blue band in each of Bitcoin's cycles. For longer-term trades it might be a good idea to buy BTC when price is around the red band, and sell/go short when BTC is around the blue band, although this is no financial advice and one should always cross-check with other indicators/informations.
There's the option to plot or hide the bands individually.
The integral bands are specifically designed for the Bitcoin BLX (BraveNewCoin Liquid Index) ticker on weekly timeframe. For other assets, tickers and timeframes the functionality of this indicator cannot be guaranteed and will most probably not deliver meaningful results.

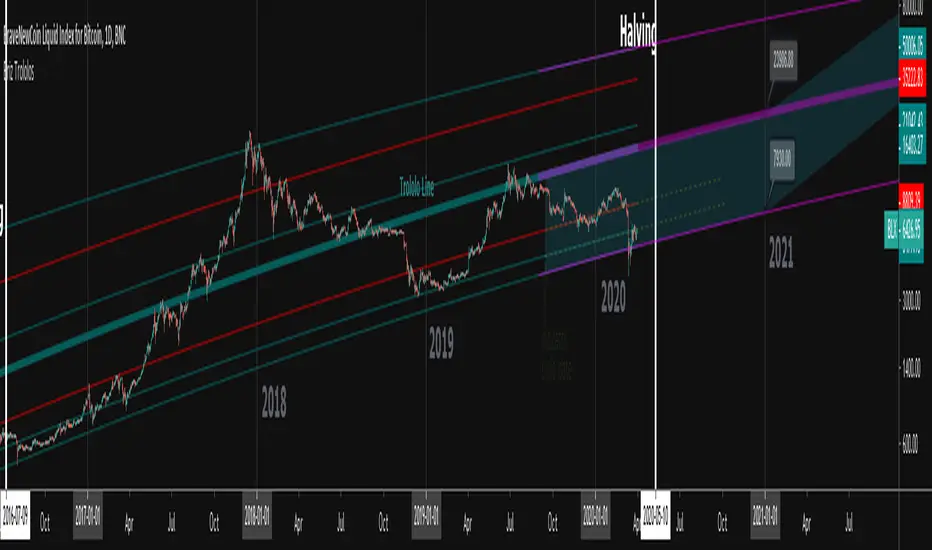
Bitcoin Trololo Lines - Logarithmic Regression for 1D BLXTrololo Lines - Logarithmic Regression lines for Bitcoin with top and bottom ranges. Works only on BLX (BNC) 1 day time frame. Red lines indicate bottom buy range and top sell range. Thickest middle line is the origional "Trololo" or logarithmic regression line.
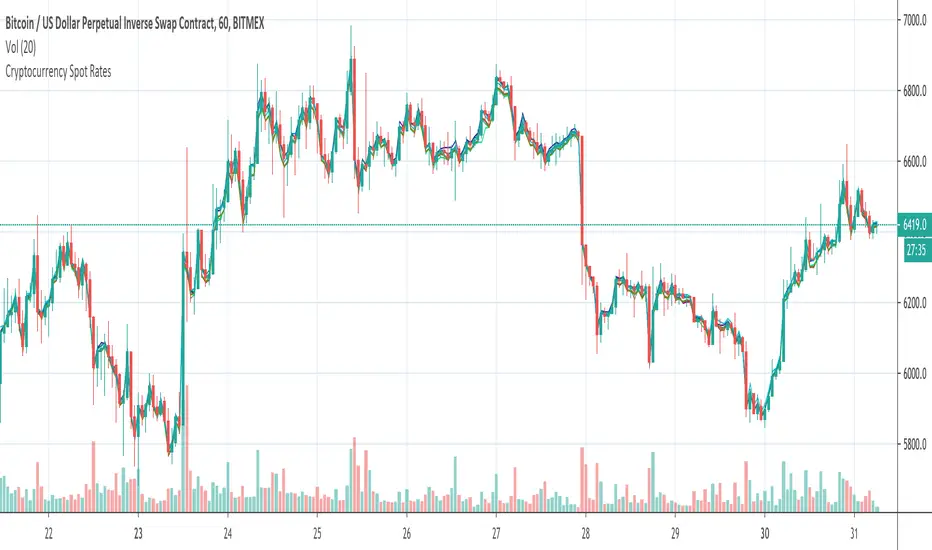
Cryptocurrency Spot RatesThis is an overlay indicator on the chart that will plot cryptocurrency spot prices of the following exchanges:
- Coinbase
- Poloniex
- OKCOIN
- Binance
- Huobi
- Bittrex
- HitBTC
- Kraken
- Bitfinex
Additionally it plots the price average of all those exchanges.
This overlay is intended to be used on charts with derivatives/futures such as BitMEX/Deribit/...
It works with all USD and Tether pairs on the main chart (for example BTCUSD, ETHUSD, BCHUSD,...)
MarketGod VisualsHere are the visuals we had included with previous versions of MG (and since removed)
Price-Tracking Fibs - S/R
Price-Tracking Pivots - S/R
Bollinger Bands
Keltner Channels
Hi-Lo
Parabolic SAR
This is a free add-on for users and non-users to use. Enjoy!

USDT SupplyThis script shows the USDT (Tether) supply, total USDT market capitalization and USDT supply on various Cryptocurrency exchanges.
It is based on this script:
Changes:
- added HiTBTC and Huobi exchange
- updated to Pine Script v4
- improved default style and line width to highlight global USDT plots against exchange-specific plot lines

XBT % ContangoSimilar to my other indicators, but measures XBTUSD Contango in terms of percent.
Also, built it so you could change the values that give the red and green signals. Default values are 0% or less (backwardation) indicates green. However, i found that a 0.5% setting worked will finding local bottoms for current contract of XBTH20 (March 2020). The upper value default is at 5%, and signals red when the next contract reaches over 5%.
My assumption is as BTC increases in value over time, measuring contango in terms of percent will be a better measure of the XBT futures curve.

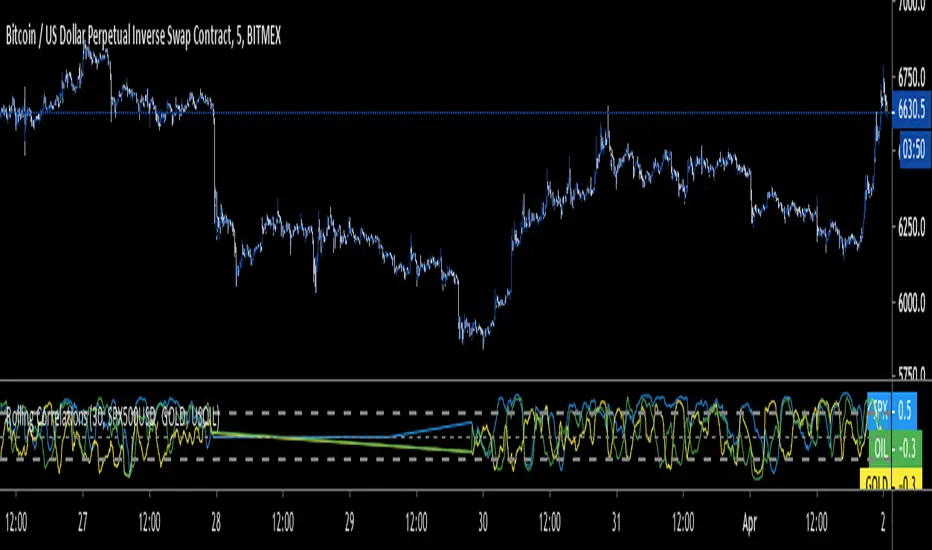
Rolling CorrelationsThis script calculates rolling correlations for up to 3 different assets at a time, compared to the main asset that is on the screen. Right now, it's best set up to use with Bitcoin and traditional assets. Created due to the recent high correlations.
Correlation Coefficient {Cybernetwork}Correlation Coefficient (CC): with CC momentum and acceleration oscillators, and momentum-divergence indicator.

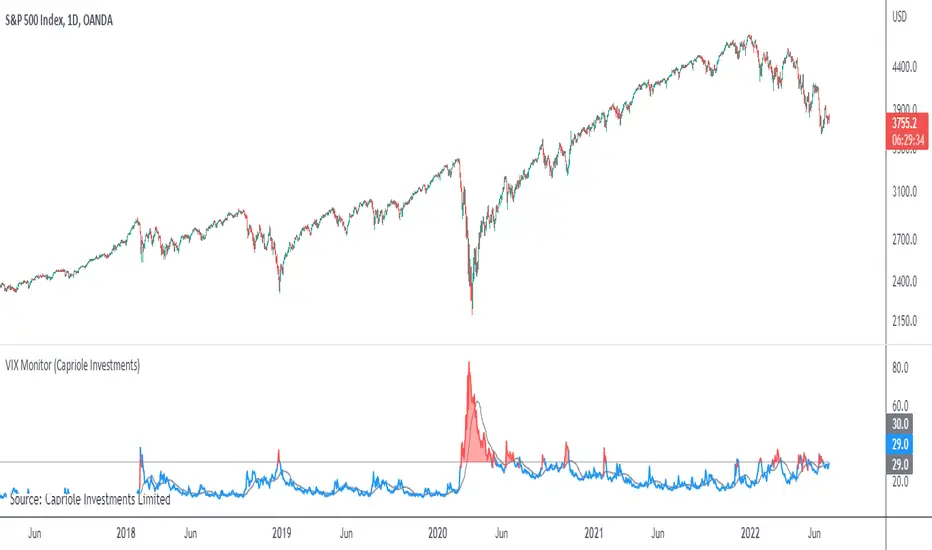
VIX MonitorSimple VIX Monitor to track spikes.
Spikes in VIX are often followed by big moves up in stocks.
Useful when paired with "Correlation & Beta" Indicator.
For Bitcoin Traders: when Bitcoin is highly correlated to Stocks (such as now) it could be a good opportunity for a short-term long trade.
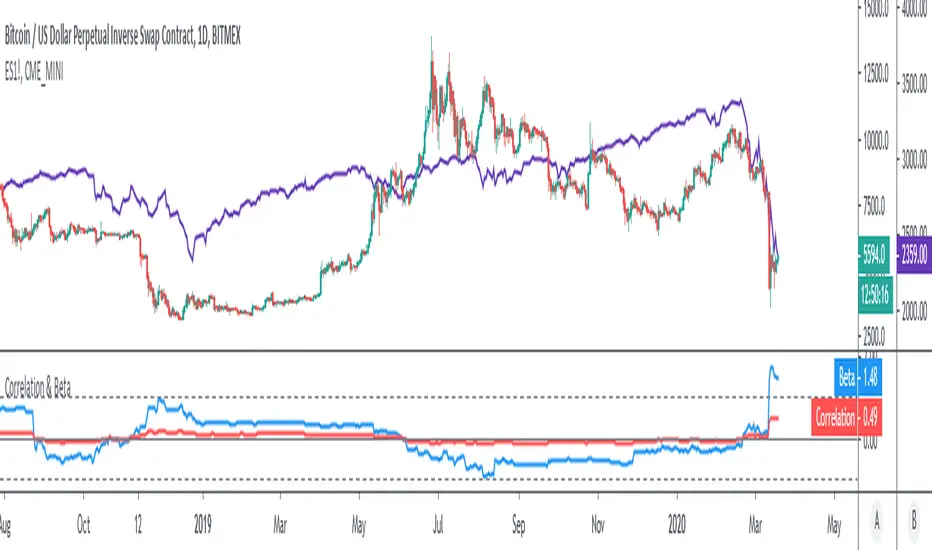
Correlation & BetaDisplay the correlation coefficient and/or Beta of an asset to a specified market.
Options to:
- Specify market (S&P500 futures by default)
- Display one or other metrics
- Modify assessment period (200 bars by default)
- Calculate on price, returns or log-returns
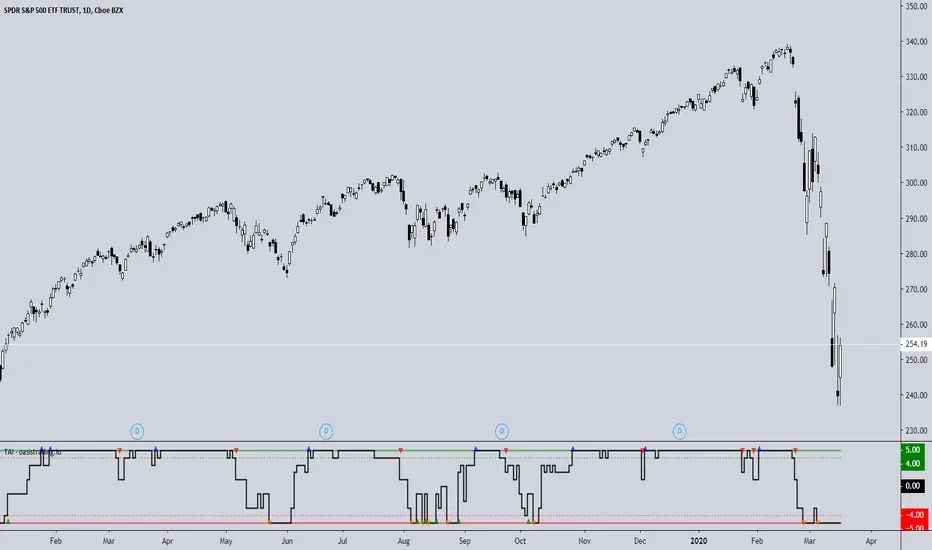
TAI - Trend Agreement IndexThe TAI is an experimental indicator we created to begin working on a automated trading algorithm. It takes five signals from our indicators and gives a +1 or -1 for each signal depending on if the signal is bullish or bearish.
This indicator should not be used for direct signals, but for confluence in trend. Long periods of flatness at 5 or -5 will indicate a very strong trend in that direction.
The TAI gives 4 different arrows depending on what the trend is doing.
Blue = Uptrend
Red = Uptrend Lost
Orange = Downtrend
Green = Downtrend Lost
This is a free add-on indicator for traders with access to the DBT MoMo and the Oasis Trading Suite and Bundle Package.
For Access or Questions: Private message us. Thank you.
Yield Curve Inversion MonitorIdentifies when the US Treasury Yield Curve inverts (2 and 10 year bond rates).
When they ‘invert’ long-term bonds have a lower interest rate than short-term bonds. In other words, the bond market is pricing in a significant drop in future interest rates (which might be caused by the US Fed fighting off a recession in the future).
In the last 50 years, every time the US treasury yield curve inverted a recession followed within 3 years. On average the S&P500 gained 19.1% following the inversion and peaked 13 months later. In other words, as far as investors are concerned, the recession began roughly one year later.
However, once the market peaks, it then drops 37.6% on average, wiping out all those gains and more.
...Looks like 2020 is shaping up to be another prime example.
