Bitcoin DAA OscillatorAn oscillator of Bitcoin's Daily Active Addresses (DAA) and fundamental metric of the utilization of the Bitcoin network.
Helps to identify:
Potential buy zones (green) - when the network utilization is low & increasing
Potential sell zones (red) - when the network utilization is high & decreasing
Bitcoin (Kriptopara)

ELLIPSE: Bidirectional Swing Trading Strategy (Alert Version)This is the alert version of our original script ELLIPSE: Ultimate Bidirectional Swing Trading Strategy.
This release has the same internal algorithm as the ELLIPSE Strategy script. But instead of showing back test results, this script provides the functionality to add alerts that can notify the user via email / pop-up / sms / app once a signal is given! You must manually add these alerts via TradingView. If you need help setting up these alerts, feel free to ask in the comment box or send us a dm.
***The script is invite-only, message us to get script access***
-------------------------------------------------------------------------------------------------
User Guidelines:
The trading strategy was designed and optimized for trading cryptocurrencies only ; furthermore it works best on established cryptocurrencies that have a clear historical trend such as:
BTCUSD
ETHUSD
LTCUSD
XRPUSD
ADAUSD
The trading strategy is based on swing trading methodology. The script must therefore be used on 4h candles only .
Use USD trading pairs only (e.g. use ETHUSD instead of the ETHBTC) since the individual trend is captured more effectively and therefore gives better results.
The trading strategy is bidirectional , both long and short entries are generated.
-------------------------------------------------------------------------------------------------
Indicators used in this strategy:
Ichimoku Cloud ; acts as the leading indicator.
Volume ; without strong volume , a market move is not valid.
MACD and Vortex ; both being used as confirmation indicators.
Choppiness index ; avoids trading in choppy markets.
Simple and Exponential Moving Averages ; prevents trading against the trend.
The trading strategy is easy to use, bidirectional, trend based and without repainting, meaning once a signal has been made it is permanent and that no future data is used in the decision making. It detects the trend and filters out market noise based on more than 10 technical indicators. ONLY when all indicators align with each other the algorithm prints a LONG or SHORT signal. The trading strategy provides high probability trading signals and minimizes risk! This script aims to capture the profit from short to medium trending moves and by doing so filters out non-substantial trends and avoids the associated risks with these trades.
-------------------------------------------------------------------------------------------------
Features:
NO Repaint once candle is closed.
Stop loss feature ; set your own stop loss to manage your risks.
Customizable Display for the Ichimoku cloud indicator display.
Bidirectional ; both long and short trading positions can be enabled.
Full backtest feature ; Easily generate your own backtest results for each asset (Strategy Version Script).
Alerts ; Get notified via email / pop-up / sms / app once a signal is given! (Alert Version Script).
-------------------------------------------------------------------------------------------------
Backtest results
Below are the back test results. Only well established cryptocurrencies are displayed with a clear historical trend.
Back test results: (long and short trades, signal to signal, order size: 100% of equity, commision fee 0.1%, period: start of chart)
Exchange-----Asset---------Timeframe---Percent Profitable----Profit Factor-----Total Trades----Max Drawdown---Average bars in trade-----Net Profit
Bínance------BTCUSDT---------4H-----------------54.4---------------3.37-------------------57----------------14.9---------------------38------------------1978
Bínance------ETHUSD----------4H-----------------50.9---------------3.48------------------- 57---------------26.8----------------------37------------------3953
Bínance------LTCUSD-----------4H-----------------61.0---------------3.15-------------------59----------------20.9---------------------33------------------3098
Bínance------XRPUSD----------4H-----------------43.1---------------2.44--------------------51---------------22.4----------------------26------------------1226
Bínance------ADAUSD----------4H-----------------57.5---------------3.47--------------------47---------------34.7----------------------35------------------1233
-------------------------------------------------------------------------------------------------
Reminder: Use this trading strategy at your own risk and trade responsibly. We are not responsible for any financial loss using this strategy.
***The script is invite-only, message us to get script access***

The MATRIX: Ultimate Crypto Position Strategy (Alert Version)Welcome back everyone,
It's been a while since our last post. In recent months we have worked on all kinds of projects, but more on that later. In the meantime, we also received a lot of positive feedback about our original 'The MATRIX: Ultimate Crypto Position Strategy' script.
One of the many requests was whether we could release an alert version.
However, since Pinescript does not provide the alert functionality in a strategy type script, it had to be converted to a study type script. Besides that, we have also added a stop-loss functionality. This release has the same internal algorithm as the original 'The MATRIX: Ultimate Crypto Position Strategy' script. But instead of showing back test results, this script provides the functionality to add alerts that can notify the user via email / pop-up / sms / app once a signal is given! You must manually add these alerts via TradingView. If you need help setting up these alerts, feel free to ask in the comment box or send us a dm.
***The script is invite-only, message us to get script access***
-------------------------------------------------------------------------------------------------
The MATRIX: Ultimate Crypto Position Strategy should be used as follows:
• The trading strategy was designed and optimized for trading cryptocurrencies only ; furthermore it works best on established high market cap cryptocurrencies that have a clear trend such as:
BTCUSD
ETHUSD
LTCUSD
XRMUSD
EOSUSD
ADAUSD
DASHUSD
ETCUSD
• The trading strategy is based on swing/position methodology. The script must therefore be used on daily timeframe candles only (1D).
• Use USD trading pairs only (e.g. use ETHUSD instead of the ETHBTC) since the individual trend is captured more effectively and therefore gives better results.
-------------------------------------------------------------------------------------------------
The MATRIX:Ultimate Crypto Position Strategy is based on the following indicators:
• Ichimoku Cloud ; acts as the leading indicator.
• Volume ; without strong volume , a market move is not valid.
• MACD and Vortex ; both being used as confirmation indicators.
• Choppiness index ; avoids trading in choppy markets.
• Bullish/ Bearish Regular Divergences in combination with RSI to spot tops and bottoms.
• Simple and Exponential Moving Averages ; prêvents trading against the trend.
The trading strategy is easy to use, trend based and without repainting, meaning once a signal has been made it is permanent and that no future data is used in the decision making. It detects the trend and filters out market noise based on more than 10 technical indicators. ONLY when all indicators align with each other the algorithm prints a BUY or SELL signal. The trading strategy provides high probability trading signals and minimizes risk! This script aims to capture the profit from longer term trending moves and by doing so filters out non-substantial trends and avoids the associated risks with these trades.
-------------------------------------------------------------------------------------------------
The MATRIX: Ultimate Crypto Position Strategy has the following features:
• ALERTS can be enabled which can notify the user through email/popup/app once a signal is given.
• Automatically generated Buy / Sell alerts in the form of a label.
• NO Repaint once candle is closed.
• SAFEGUARD ; custom built-in security prevẹnts trading when the price is out of equilibrium.
• Customizable Display for the Ichimoku cloud indicator display.
-------------------------------------------------------------------------------------------------
Reminder: Use this trading strategy at your own risk and trade responsibly. We are not responsible for any financial loss using this strategy.
***The script is invite-only, message us to get script access***

Truenomic's Universal BTC and ETH VolumeA simple indicator to display the total volume of BTC or ETH from different exchanges. The difference between this indicator and others is the ability to see the total volume in BTC or ETH (not USD) from all exchanges simultaneously, including derivative ones.
Spot Exchanges:
Binance;
Coinbase;
Kraken;
Gemini;
Bitfinex;
Bitstamp;
Derivatives Exchanges:
Bitmex;
Okex;
Deribit;
FTX;
Binance;
This list is relevant only at the time of publication, stay tuned for further indicator updates!

Bitcoin Future Market Sentiment[Benson]Use this sentiment indicator to buy dip and sell high.
The red area shows where the market sentiment is optimistic and might be temporarily a top to sell.
The green area shows where the market sentiment is pessimistic and might be temporarily a dip to buy.
This indicator sums up the majorBTC future market's funding rate 4 bars back. You can tweak the bars back in the input.

My BTC log curveLogarithmic regression of the USD price of Bitcoin , calculated according to the equation:
y=A*exp(beta*x^lambda + c) + m*x + b
where x is the number of days since the genesis block. All parameters are editable in the script options.

Underdog Trading Signal SystemBased on & modified from popular ATR strategies, This is our very own buy and sell signals system. it should work on any pair, with standard settings, from btcusd , to us30.
It does work on most time frames, but with standard settings, i find the best results come from 15m time frames and 4h, along side general charting knowledge, this is a very powerful tool.
The printed line on the chart is a DMA (displaced Moving Average) which can be used for finding the trend direction, so if the price is above the DMA, only take the long positions, and if below, only take shorts.
The entries are designed to show you the direct buy and sells (as i said above), but also, will show you potential reversals, if the price is on the wrong side of the DMA.
As usual, if you have any further questions on how this system works, or if you wish to get access to this system, please DM on TradingView or follow the links below to find out more.
Look forward to hearing from you
TradingSargentAlpha @ UnderdogTrading

cosmic scalperCosmic Scalper is an intuitive & exotic trading engine, designed to Identify Trend, visually highlight our “Zone of Interest” & plot entry lines at its base, like a barcode, providing critical information to the trader’s mind in a clean, elegant way without cluttering the chart.
Components Of Script :
1. Trend Support Cloud : Based on Fibonacci ratio, the cloud has 3 layers or bands.
2. Entry Engine : The last band of the cloud gets highlighted when we enter “Zone of Interest” & vertical lines appear indicating possible entry points. Together this forms a trend fingerprint.
Mechanism Of Action :
1. Identify trend : The script observers multiple parameters on higher timeframes to identify trend & plots the fibonacci based 3 layer trend support cloud. The script will indicate a change of trend when the last band is breached & sustained.
2. Zone Of Interest : Once a trend is identified, we are looking for entries. But we wait for the other side to get exhausted first. When exhaustion is identified, the last band of the cloud gets highlighted. This “exhaustion” is measured using bespoke datasets created within the protocol. Conventional datasets like RSI, VWAP, MACD etc are only used as secondary or tertiary layer of information.
3. Entries : Once we have entered the highlighted ‘Zone of Interest’ the script will offer entry points represented by vertical lines in the last band, this Highlight + Vertical Lines together forms the trend fingerprint, giving traders crucial visual information to make informed decisions.
How to use :
1. Make a Higher Timeframe Analysis, 4hr, 6hr or Daily timeframe. Use TA or Bollinger Bands.
2. Once you have an informed bias, switch to the Cosmic Scalper on 1min timeframe to take position.
3. Target, Stop, Leverage : at user discretion
Have Questions? Feel free to PM me on TradingView

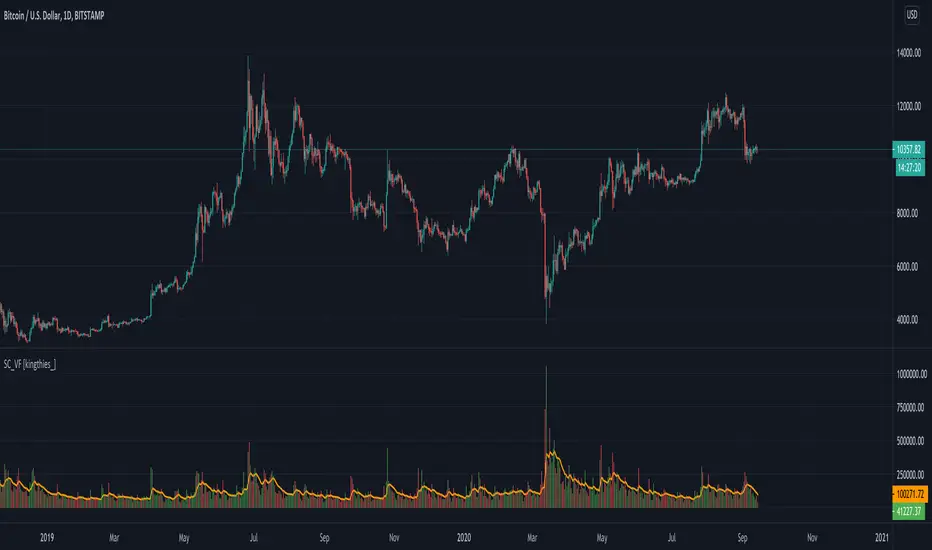
Stablecoin Volume Flow [kingthies_]Stablecoin Volume Flow into BTCUSD/BTC-Stablecoin pairings
Exchanges Used
Coinbase
Kraken
Bittrex
Binance
Huobi
Bitstamp
Gemini
Bitfinex
Our aim here is simple...to combine the overall volume flow from Fiat or stable currencies into the crypto-markets.
This is the first portion of a series I plan to share involving a holistic approach to understanding the overall crypto-ecosystem. I've included several of the highest ranking by volume exchanges and their accompanying older/well known stablecoins.
Also, the historic data for the newer stable coins made the study invalid due to limited sample size. That included coins like USDC, DAI, GUSD, BUSD and more. For this reason, the 10 sources of data here adequately provide the data needed to see a full view of the market volume going in and out of bitcoin at any given moment
PT Buy Sell IndicatorVersion 1.0 of our Buy & Sell indicator helps determine when a time-frame is ready for a possible reversal. The indicator is primarily based on the movement & behavior of the RSI. We recommend using the indicator on Binance exchange (USDT) with H1, H2, H3 & H4 time frames. We have put together a video with a strategy on how to take the signals best. Please watch the video to understand how to use it. You can also ask us questions in our discord to better understand the indicator.
There are currently two different settings that come with the indicator. Our aggressive & standard toggle each offer various set of signals.
- Aggressive toggle: more signals throughout multiple time-frames. Recommended for the more advanced traders that can combine technical analysis with their setups. Best time-frame H3, H4 & H12. (Use Reduce Signal Threshold input #7+)
- Standard toggle: fewer signals with a bit less risk. Recommended for traders that are just starting. Best time-frame 15m, 30m, H1, H2, 3D & 5D (Use Reduce Signal Threshold input #4)
The buys & sells are not in-sync with each other. They tend to fire independently when the specified time-frame is ready for a possible reversal.
The most successful method we structured for the buy/sell indicator is combining the PT STx & the PT Top/Bottom Bands (both included in our library). The PT Top/Bottom Bands helps you gauge the closest trouble area. When signals fire, we look at our top/bottom band indicator to find an entry as close to support/resistance as possible. The bands are isolated & color-coordinated.
Red Band - Overbought zone
Gray Bands - Within the range
Orange Band - Our EQ (middle of the range)
Green Band - Oversold zone
This eliminates the guessing game that invalidates your trade setup. The best risk to reward is taking sell signals (shorts) as close to the red band while targeting the orange band (eq) & taking buy signals as close to the green band while targeting the orange band (eq).
There are four different inputs that you can tweak to cater to your trading style. Each input is customizable based on the time frame. We get into detail about this in our video. Watch the video & do not take signals blind!
The secret sauce to having the highest success rate is to take the signals only when the PT STx (included in our library) has fired its algorithm.
This is an invite-only script. Please message us for access to our whole library.
As we keep making progress with our indicators, you will be granted access to each of them as long as you are a Pattern Trader member!
There will be limited access to our library until version 2.0 is released.

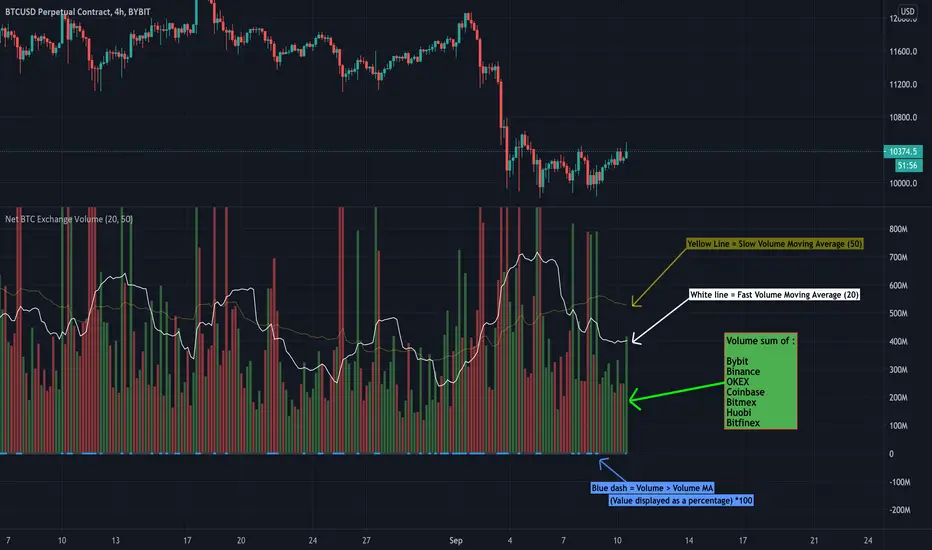
Net BTC Exchange VolumeBTC Net exchange volume of top BTC exchanges with moving averages
- Jake Scanlan
RSI + MFI - Crypto Bull and Bear market A fancy styled version of the RSI (Relative Stochastic Index) + MFI (Money Flow Index) oscillators in order to emphasize buy and sell opportunities.
The 80 and 20 Bands are meant to be used in Bull or Bear markets. Better performing in D timeframes.
The circles represent the cross between RSI and MFI .
Designed for Crypto Markets
Thanks @micheleprandina
Credits:

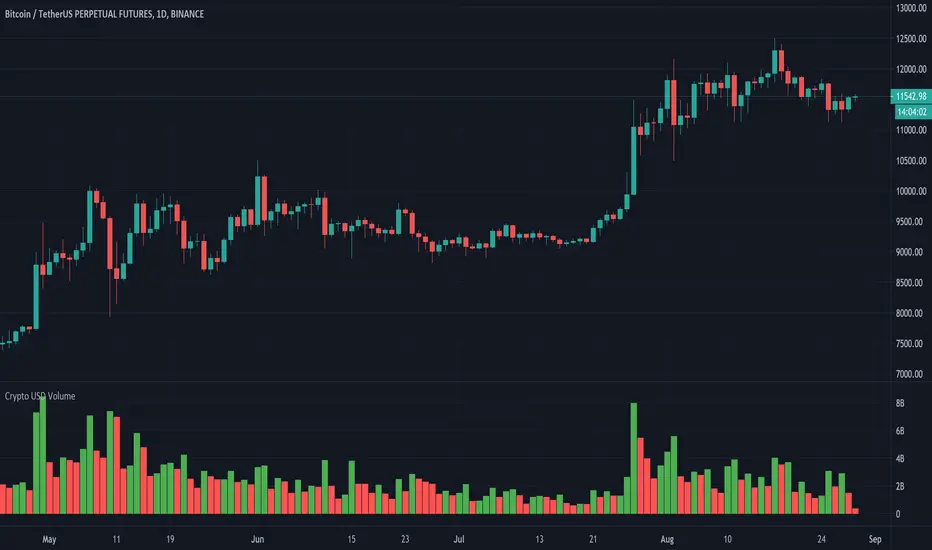
Crypto USD VolumeOften times I need to check the volume in cryptocurrency exchanges and I find myself checking which type of volume I am looking at, I need to manually make sense what the data is and converting it into USD volume which I end up going to CoinMarketCap website to verify whether my calculation is right.
Today I thought it was about time I created an automatic way to find the volume in USD Dollars. This is what this script does.
1 - It removes the base currency from the symbol (e.g., "BTCUSD", it would remove "BTC", leaving us with the "USD" part.). This is important because it helps us identify the currency the pair uses.
2 - It has different pair's variables, each is given a specific currency that the final volume is calculated from. (BTC, ETH, BNB and USD are the default currencies, for other ones, it must be added manually).
This works with all crypto symbols that include BTC, ETH, BNB and USD as currencies. If you modify it, please make sure to compare data with the exchange's one.
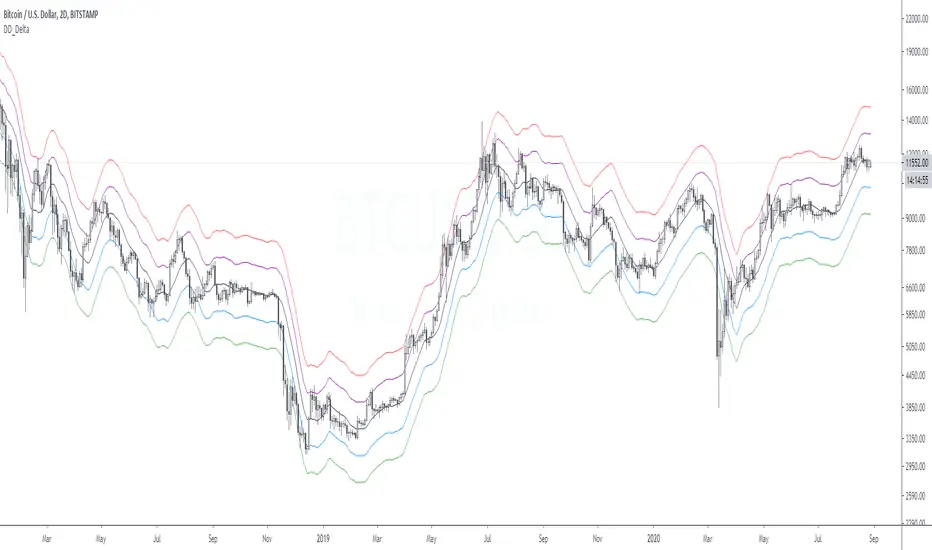
DD_DeltaDescription:
The DD_Delta Indicator is a mean reversion indicator based on the concept of moving average and fibonacci level multiples. The middle blue line corresponds to the 13 MA with the orange and red lines lines being a factor and inverse of 1.414 and 1.272 of the blue line respectively. Price usually retraces from the purple and red (green and blue) lines towards the back line. Also, the direction of the ribbon indicates the nature of the market - upwards: bull, downwards, bear.
Best TF to use this on: 2D.
For access, DM me.
Golden Ratio MultiplierThe moving averages 350 and 111 by themselves do a great job of identifying market tops/bottoms. The fraction 350/111 is very close to Pi as well (3.15) so that's is suspicious in its own right.
Nonetheless, fibonacci retracements/multiplies of the 350 SMA does a remarkable job of finding reversal points. I commented out a couple of multiplies for simplicity's sake (the lines became rather crowded). However, the script is open source so you all can copy it into Pine Editor and delete the "//" and add it back to the script.
Cheers.

Real Relative Volume - Bar Indicator - Time Adjusted - DE & ENEnglish version below
Die richtige Aktie zu finden, ist nich immer einfach. Eine wichtige Variable bei der Aktienauswahl stellt das relative Volumen dar, welches von vielen erfolgreichen Tradern und Trading Firmen benutzt wird. Stell es Dir so vor: Statt sich das absolute Volumen anzuschauen, schauen wir uns die tatsächliche Stärke an. Wie viel Volumen wird also heute im Vergleich zu einem regulären Tag gehandelt. Dies gibt Aufschluss darüber, ob die Aktie "In-Play" ist.
Merke: Ist das RVOL (Relative Volumen) erhöht, sind mehr Marktteilnehmer an dieser Aktie interessiert als üblich. Dies ist besonders dann wichtig, wenn die Marktrichtung und die Richtung der Aktie nicht übereinstimmen.
Wenn der Markt steigt, steigen auch die meisten Aktien. Dies kann folglich auch ohne erhöhtes RVOL passieren. Was ist aber, wenn der Markt gegen uns geht? Dann werden wir schnell bei RVOL-schwachen Aktien ausgeschüttelt. Daher wollen wir unseren Fokus immer auf Aktien setzen, die ein erhöhtes relatives Volumen haben! Dies sind die Aktien, die gerade wirklich stark gehandelt werden und wahrscheinlich einen Katalysten dafür haben.
Der Real Relative Volume - Bar Indicator zeigt Dir das aktuelle relative Volumen an. Unser Algo benutzt dabei das tatsächliche kumulative Volumen des aktuellen Tages zum jeweiligen (aktuellen) Zeitpunkt und vergleicht dieses mit dem historischen Durchschnittsvolumen zum gleichen Zeitpunkt. Damit bekommen wir ein korrektes Abbild der aktuellen Stärke. Mit Hilfe des Indikators können wir durch die farbliche Veränderung der Volumenbalken ebenfalls sehen, ob diese Stärke zunimmt, gleich bleibt, oder gegebenenfalls schnell and Power verliert. Im Gegensatz zu anderen Skripten nutzen wir eine fortschrittliche Methode, die aktuelle Position am Tag erkennt und damit nicht die Session in gleiche Teile teilt. Vorteil: Der Indikator funktioniert auch in Krypto, Forex, DE-Aktien, Indizes etc.
Funktionen:
Bitte ohne verlängerte Handelszeiten nutzen!
Sessions Back: Verändert die Baseline, die Du mit dem heutigen Volumen vergleichst. Beispiel: 10 - Zur aktuellen Uhrzeit siehst Du das reale relative Volumen von heute in Relation zu den letzten 10 Sessions (zur gleichen Zeit). (*max 5000 Kerzen)
RVOL Threshold: Wert für die RVOL Alarme sowie zur Färbung bei Nutzung des Modus Threshold.
Plot styles: Du hast die Möglichkeit aus 4 verschiedenen Styles zu wählen.
Heatmap (greift auf die Werte und Farben von HM1-HM5 zurück)
Traffic (greift auf die Werte und Farben von T1-T4 zurück) -
Threshold (greift auf den Werte RVOL Threshold zurück)
Kurs (zeigt die normalen Volumenbalken)
HM1-5: Stelle unterschiedliche RVOL Werte für den Plot Style Heatmap ein.
T1-4: Stelle unterschiedliche RVOL Werte für den Plot Style Traffic ein.
Dieser Indikator wird häufig mit unserer zweiten Version Real Relative Volume - Line Indicator - Time Adjusted - DE & EN verwendet. Stelle sicher, dass Du in beiden Indikatoren die gleichen RVOL Werte nutzt!
-------------
English version
Finding the right stock to trade is not always easy. An important variable in stock selection is the relative volume, which is used by many successful traders and trading firms. Think of it like this: Instead of looking at absolute volume, we look at actual strength. So how much volume is traded today compared to a regular day? This gives an indication of whether the stock is "in play".
Note: If the RVOL (relative volume) is increased, more market participants are interested in this share than usual. This is especially important if the market direction and the direction of the stock do not match.
If the market rises, most shares will also rise. This can, therefore, happen without an increased RVOL. But what happens if the market goes against us? Then we are quickly shaken out of RVOL-weak stocks. Therefore, we always want to focus on stocks that have an increased relative volume! These are the stocks that are trading really strongly right now and probably have a catalyst for that.
The Real Relative Volume - Bar Indicator shows you the current relative volume. Our Algo uses the actual cumulative volume of the current day at the respective (current) time and compares it with the historical average volume at the same time. This gives us a correct picture of the current strength. With the help of the indicator, we can also see by the color change of the volume bars whether this strength increases, remains the same, or loses power quickly. Unlike other scripts, we use an advanced method that recognizes the current position on the day and does not split the session into equal parts. Advantage: The indicator also works in crypto, forex, foreign stock markets, indices, etc.
Features:
Please use without extended trading hours!
Sessions Back: Changes the baseline that you compare to today's volume. Example: 10 - At the current time you see the real relative volume of today in relation to the last 10 sessions (at the same time). (*max 5000 candles)
RVOL Threshold: Value for the RVOL alarms as well as for coloring when using the Threshold mode.
Plot styles: You have the possibility to choose from 4 different styles.
Heatmap (uses the values and colors of HM1-HM5)
Traffic (uses the values and colors of T1-T4) -
Threshold (accesses the values RVOL Threshold)
Price (shows the normal volume bars)
HM1-5: Set different RVOL values for the Plot Style Heatmap
T1-4: Set different RVOL values for the Plot Style Traffic.
This indicator is often used with our second version Real Relative Volume - Line Indicator - Time Adjusted - DE & EN. Make sure that you use the same RVOL values in both indicators!

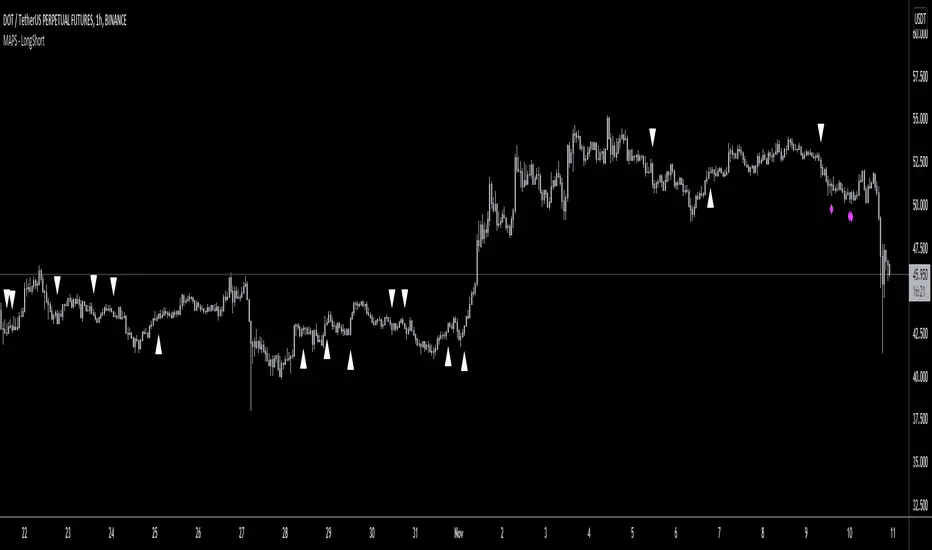
MAPS - LongShortThis script analyzes volume and momentum for different timeframes to spot opportunities for Longs or Shorts.
Please see below for access to indicators.
BITCOIN Miners Revenue VS Price Correlation OscillatorUse 3D(3-day candle) as timeframe for best reading.
------
original template for Correlation indicator was created by obaranova. credit goes to her.

Alpha Trader v3.0Alpha Trader is a trend following strategy which identifies good time to take profit and allow trader to ride the trend with multiple re-entry points.
Features
Entry and Exit signals
Multiple Re-Entry points
Built in Risk Management
Position sizing for every entry
Alerts with Stop Loss and Position size
Strategy has built-in risk management with dynamic trailing Stop Loss and Position sizing. You just need to specify what percentage of your capital you are willing to risk on new position and re-entries.
Strategy will evaluate the maximum position you should take for specific signal.
Position and stop Loss levels are visible on alerts and when you hover over the markers on your chart.
You can set alerts for below scenarios. Alerts contain stop loss and Max position advised on a specific trade entry.
1.New Long Entry
2.New Short Entry
3.Long Re-Entry
4.Short Re-Entry
5.Long Take Profit
6.Short Take Profit
Usage
You can enter into a new position with New Long Entry/New Short Entry. Position size and Stop loss are visible on alert and signal marker on the chart. Please set your alerts on bar close.
You can take profit on Long take profit/ Short take profit signal.You can chose to close any % of your position.
You can re-enter into a position and increase your existing position on Long Re-Entry/Short Re-Entry signal. Position size and New stop loss levels are indicated on alerts or when you hover over the signal marker.
Position size can be greater than 100% with leverage. For e.g. if strategy suggest 200% as position size, you can take this position with 5x leverage and 40% of your capital. But, downside risk for every entry would be limited to your preferences.
This strategy works best on 4 hour and Daily time frames.
For Access : Contact me on TradingView.

UTG - VolumeOur in-house developed Volume indicator.
- Gives you a bit more information than the standard volume indicator
- Allows you to choose High Point Method
- This takes into account the Historical High, or the last high in a predetermined length (of your choosing)
- Can determine the Vertical space used on the chart
- Can identify the Historical High for you
- Customisable in regard to colours & MA
If you'd like to know more about this, or gain access, details for access to this can be found in our Signature!
Happy Trading!

DD_GolfDescription: The DD_Golf indicator attempts to obtain the fair value of BTCUSD in terms of mining costs. It is very helpful in finding absolute bottom support and possible S/R levels. The blue line shows the approximate cost of mining a bitcoin. In other words that is the fair value. Usually if price breaks below it, then it goes much lower and tests the red line which happens to be the absolute bottom at half the cost of mining.
If you'd like access to this script, please send me a direct message.

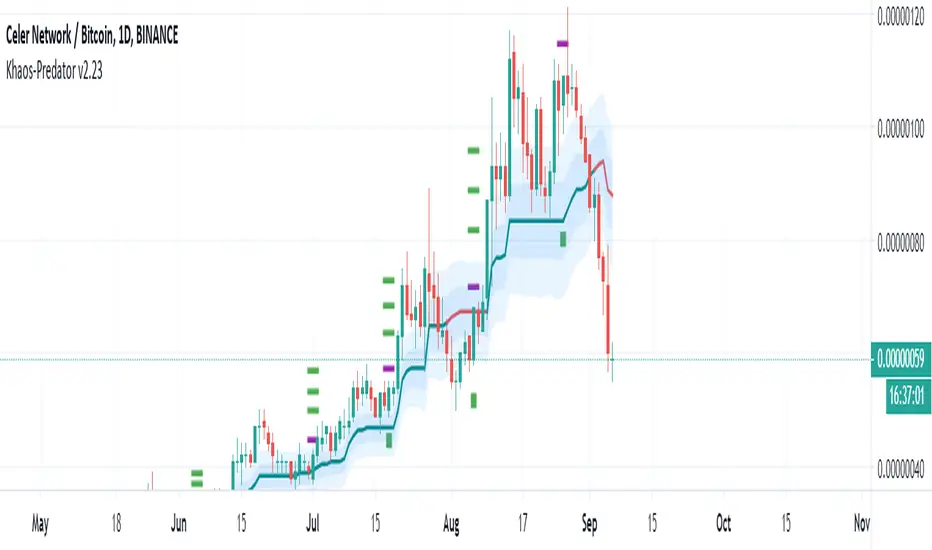
Khaos-PredatorThis Indicator is a full trading system that offers setups with Entries and Targets and Trade Management. This indicator is very accurate because it uses advanced setup detection and filtering logic.
There are 2 conditions that must occur for you to take a trade:
1) Price must move beyond the purple dot
2) The baseline must be green for long trades, or red for short trades.
The setup is triggered if the price passes the purple dot. Do not enter the trade unless price passes the purple dot. (You may wait for pullback to enter if you wish – but only after price traded beyond the purple dot firstly.) Remember, the trade is NOT active unless price moves beyond the purple dot.)
Each setup has 3 possible targets, which are dots colored green for longs and red for shorts.
You can use the baseline (which is a trend-line that is either green for bullish or red for bearish) to filter trades. You should only enter long trades if the baseline is green and only enter short trades if the baseline is red. One strategy would be if you enter a trade long, and reach the first target, you can take some profits, but still let the some of the position run and use the baseline to manage the trade.
Also, you can use the baseline for trailing stops.
To summarize:
• Purple Dot = Entry Trigger
• Green Dots = Long Targets (3 of them, for different price targets: target 1, 2 and 3)
• Green Square = Long Stop
• Red Dots = Short Targets (3 of them, for different price targets: target 1, 2 and 3)
• Red Square = Short Stop
The great thing about this indicator is that its universal, there are no settings necessary -- just put it on the chart and it finds high probability setups and paints it on the chart as they occur. There is NO Repainting with this indicator.
Of course, you can add other indicators if you wish, and even add this indicator to your existing trading system.
Again, this indicator does NOT repaint.
Once a setup is found, the indicator draws the entry trigger price and the targets at the setup bar close.
Setup Alerts are fully supported, via email, sms, and desktop notification.
*If you wish to license this indicator, please contact me via private message for details regarding access. Thank you.
LEGAL STUFF:
Risk Disclosure
Futures , forex, stock, crypto and derivative trading contains substantial risk and is not for every investor. An investor could potentially lose all or more than the initial investment. Risk capital is money that can be lost without jeopardizing ones’ financial security or life style. Only risk capital should be used for trading and only those with sufficient risk capital should consider trading. Past performance is not necessarily indicative of future results
Hypothetical Performance Disclosure
Hypothetical performance results have many inherent limitations, some of which are described below. no representation is being made that any account will or is likely to achieve profits or losses similar to those shown; in fact, there are frequently sharp differences between hypothetical performance results and the actual results subsequently achieved by any particular trading program. One of the limitations of hypothetical performance results is that they are generally prepared with the benefit of hindsight. In addition, hypothetical trading does not involve financial risk, and no hypothetical trading record can completely account for the impact of financial risk of actual trading. for example, the ability to withstand losses or to adhere to a particular trading program in spite of trading losses are material points which can also adversely affect actual trading results. There are numerous other factors related to the markets in general or to the implementation of any specific trading program which cannot be fully accounted for in the preparation of hypothetical performance results and all which can adversely affect trading results
Bitcoin Correlated Market DirectionIdentifies which major market is "controlling" Bitcoin and what direction that market is moving in.
Helps to identify confluence of trend or potential turning points for Bitcoin.
Blue = stocks in control and bullish
Purple = stocks in control and bearish
Orange = gold in control and bullish
Red = gold in control and bearish
