Ark Crypto HeatlineThis is the 'on chart' indicator. See also "Ark Crypto Heatband" indicator for a side-by-side BTC view, without a re-scaled line.
The crypto landscape is largely dominated by BTC and characterised by cyclical stages with varying degrees of mean reversion.
To understand what stage of the cycle we are currently experiencing, it is useful to examine to what degree the current price has extended beyond the long term average that BTC has established. This is true even when analysing other crypto assets as BTC is the dominant force in the crypto asset class.
This indicator uses the 1400 period daily SMA , which is broadly the 200 period weekly SMA. This can be configured, but historically has represented a baseline to which BTC commonly returns.
The graph plots current price in terms of multiples of this long term average. Traditionally, at multiples beyond 10, BTC is considered overextended with a higher likelihood of trending towards the mean thereafter. Colors indicate the extent of price extension.
Where the indicator is applied to non BTCUSD pairs, a smoothed conversion is applied, seeking to superimpose the BTC long period SMA onto the current chart.
The indicator specifically references BTC by default on all charts, as it is designed to use BTC as general purpose indication of where crypto as a whole currently sits. Accordingly the indicator is only to be used on crypto charts.
For best results on BTC, using BNC:BLX will give the longest historical view.
Bitcoin (Kriptopara)

Ark Crypto HeatbandThe crypto landscape is largely dominated by BTC and characterised by cyclical stages with varying degrees of mean reversion.
To understand what stage of the cycle we are currently experiencing, it is useful to examine to what degree the current BTC price has extended beyond a long term average. This is true even when analysing other crypto assets and helpful to view side by side.
This indicator uses the 1400 period daily SMA, which is broadly the 200 period weekly SMA. This can be configured, but historically has represented a baseline to which BTC commonly returns.
The graph plots current price in terms of multiples of this long term average. Traditionally, at multiples beyond 10, BTC is considered overextended with a higher likelihood of trending towards the mean thereafter. Colors indicate the extend of price extension.
The indicator specifically references BTC by default on all charts as it is designed to use BTC as general purpose indication of where crypto as a whole currently sits. Accordingly the indicator is only to be used on crypto charts.

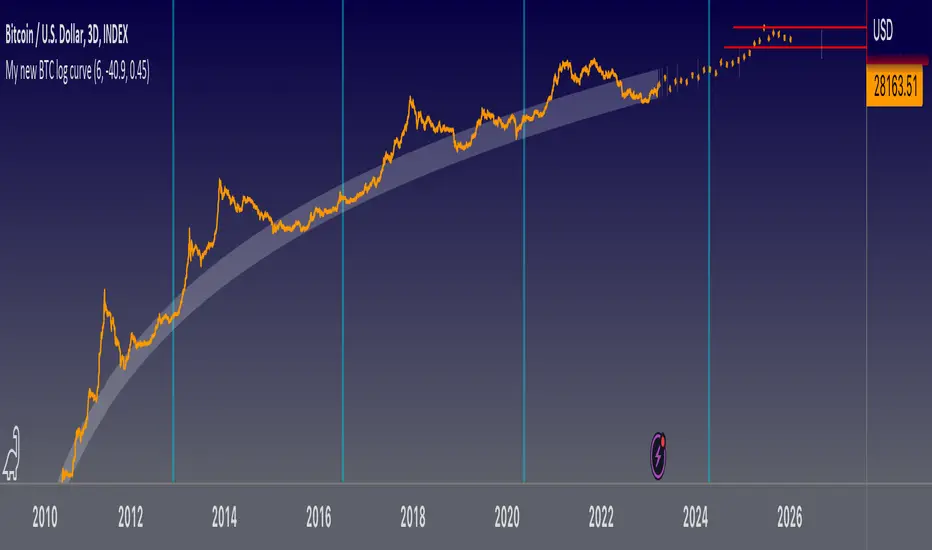
My new BTC log curveThis is my new logarithmic regression curve to the USD/BTC price chart. It is based on a new, very simple equation: y = (e^b)*(x^a), where x is number of days since the Genesis block, a and b are parameters set by the user. Also included is an upper regression curve that is fit to the peaks of each Bitcoin cycle; no fundamental analysis went into making these lines, they are merely fits to the data, so it should not be expected that they can be used to predict tops and bottoms. The upper regression curve is the product of the support curve (lower curve) and two other factors: a constant, and an exponential decay. The constant and the decay factors are parameters that can be set by the user.
Total Volume BTC - Dollar [Sobhm]
Do you want an indicator that shows the total volume in Bitcoin vs Dollar?!
The BTCUSD - BTCUSDT - BTCUSDC total volume is covered by the "Total Volume BTC - Dollar " indicator.
You can see the differences between simple volume and the collected volume using "Total Volume BTC - Dollar ".
The volume of the following pairs are collected:
'BITMEX:XBTUSD'
'BINANCE:BTCUSDT'
'BINANCE:BTCUSDTPERP'
'BITSTAMP:BTCUSD'
'COINBASE:BTCUSD'
'BITFINEX:BTCUSD'
'BYBIT:BTCUSD'
'GEMINI:BTCUSD'
'OANDA:BTCUSD'
'FTX:BTCUSD'
'FX:BTCUSD'
'HUOBI:BTCUSDT'
'BYBIT:BTCUSDT'
'COINBASE:BTCUSDC'
'BITSTAMP:BTCUSDC'
'POLONIEX:BTCUSDC'
'KUCOIN:BTCUSDC'
'HITBTC:BTCUSDC'
The timeframe is adjustable based on minutes.

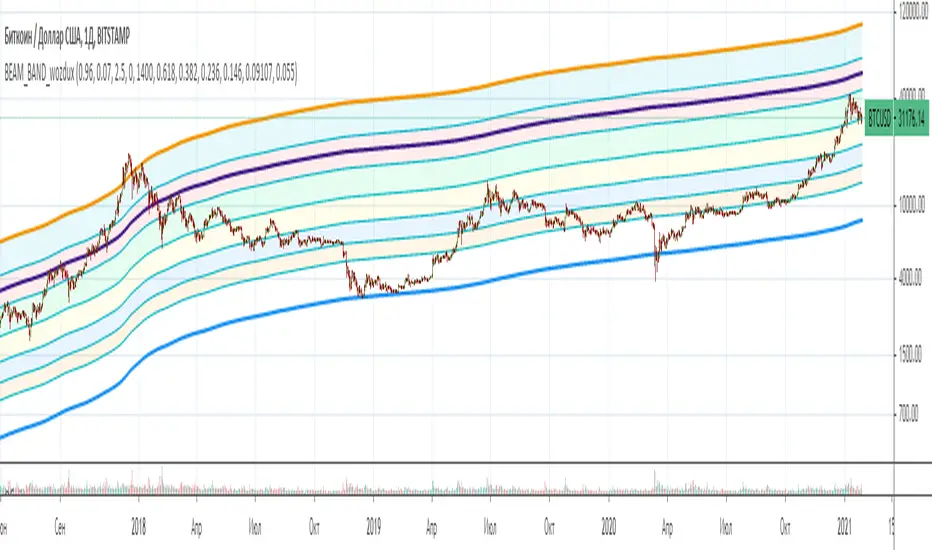
BEAM_BAND_wozdux.2021_1[wozdux]The indicator, which tracks the cycles of Bitcoin.
The corridor between the upper and lower levels is marked by the fibonacci levels. Additional fibonacci levels become support or resistance levels as the price moves.
Top level-determines the width of the channel.
Bottom level-defines the main bottom line.
The number of bars is the value of the bitcoin cycle. This is an empirical selected value. for other amount of cryptocoins, it is necessary to pick apart.
The formula for calculating this indicator is taken from the article THE BEAM INDICATOR. In addition, I extended this indicator with fibonacci levels in order to segment the price movement between the levels of the BAEM channel.
///////////////////////////////////////////
Индикатор, отслеживающий циклы Биткоина. Коридор между верхним и нижним уровнем размечен уровнями фибоначчи.
Дополнительные уровни фибоначчи становятся уровнями поддержки или сопротивления в процессе движения цены.
Уровень верха - определяет ширину канала.
Уровень низа - определяет основную нижнюю линию.
Цикл количество баров - это величина цикла биткоина. Это эмпирическая подобранная величина, для других криптомонет её нужно подбирать отдельно.
Формула для вычисления данного индикатора взята из статьи THE BEAM INDICATOR. Кроме того, я расширила этот индикатор уровнями фибоначчи для того, чтобы сегменты движения цены между уровнями канала BAEM.
trendOne [Alerts]BITSTAMP:BTCUSD
trendOne
(alerts)
This script combines all our previous trend-based scripts (Bows, Autopilot, Trend Indicator, Price Deviation, etc) in only one script .
To calculate the trend we use:
Volume Weight
Average True Range
Bows calculations
Trends smoothed with alma() function.
For more accuracy on the signals and to filter unwanted signals we layered slower time-frames in the background and added breaking support & resistance rules.
Inputs
Sensitivity
Integer input. Sets the sensitivity for signals generated up and down. Higher values will generate less signals on chart, and vice-versa.
Enjoy!
To get access to this and other scripts check links below.

Bullmarket Support BandThis Indicator displays a Bull Market Support Band for Bitcoin and Ethereum . If the bands cross and the price falls below them it usually means (at least by historical data) that the Bull Market ist coming to an end.
Use in weekly timeframe!

PROFIT MAKER |Crypto|ETH|BTC|YFI - SignalThis is the version with alerts of this strategy:
Description:
This is a trend-following strategy that works very well for many Crypto assets in the usd or usdt pair
It can be used for both futures and spot!
Some of the assets in which this strategy is proven are
Asset Exchange TF
BINANCE:ADAUSDT Binance 45m
BINANCE:BTCUSDT Binance 1h
BINANCE:YFIUSDT Binance 30m
BINANCE:DOTUSDT Binance 45m
BINANCE:ETHUSDT Binance 30m
BINANCE:LINKUSDT Binance 45m
BINANCE:DOGEUSDT Binance 1h
And many others..
What is this strategy based on?
It is a combination of various parameters, including
-RSI: The relative strength index ( RSI ) is a momentum indicator used in technical analysis that measures
the magnitude of recent price changes to evaluate overbought or oversold conditions in the price of a stock or other asset.
-MACD: Moving average convergence divergence ( MACD ) is a trend-following momentum indicator that shows
the relationship between two moving averages of a security’s price.
-ADX: ADX is used to quantify trend strength. ADX calculations are based on a moving average of price range expansion over a given period of time.
-DMI: DMI is a moving average of range expansion over a given period (the default is 14 days). The positive directional
movement indicator ( +DMI ) measures how strongly price moves upward; the negative directional movement indicator ( -DMI )
measures how strongly price moves downward. The two lines reflect the respective strength of the bulls versus the bears.
Included:
Different forms of Take profit, included:
Take profit on squeeze candles
Take profit based on Risk-Benefit (RR)
Take profit a pre-determined %.
Different forms of Stop Loss, including
ATR-based stop loss
Trail stop loss (with option to use a trigger)
Stop loss a pre-determined %.
For access you can send a message or consult in my social networks.
Links in my tradingview signature (below).
Examples:
The default configuration works very well for most pairs.
You just have to look for which time frame goes better with each one.
Recommended to try with 30m, 45m and 1 hour.

Price in BitcoinHi folks,
This script simply converts the price of assets from USD to bitcoin and displays that price in a separate chart. Currently, only assets quoted in USD will work but I will add more currencies in the future.
Use:
1. Make sure the asset you're viewing is quoted in USD or USX. To check, hover over the symbol on the top left part of the chart, click the "More" ellipsis and select "Symbol Info". The currency will be among the info displayed.
2. Apply the script and view the chart at your own risk.
Math:
price(btc) = (x/usd) / (btc/usd)
Cheers!
Jared

Bitcoin: Confidence BandsPurpose of this Script
This script is designed to show regions of positive and negative overextension for Bitcoin, where price is expected to either reverse long-term or at least shorter-term, using custom price loops. The idea is that one can be highly confident that Bitcoin's price stays within the Confidence Bands, especially when looking at weekly closes. It might be wise to reduce exposure to Bitcoin when price gets very near to the red band, and vice versa for an approach of the blue band. Of course this constitutes no financial advice, and one should always consider all available information for making trading decisions.
Settings
This indicator should only be used:
- with the default inputs (but of course feel free to play around a bit for testing purposes)
- on the weekly (W) time frame
- and for the BraveNewCoin Liquid Index for Bitcoin (BNC:BLX).
Otherwise the intended functionality cannot be guaranteed.
Access
For access please contact me via DM on TradingView or on Twitter (linked on my TradingView profile and in my signature).

rocketLaunchI wanted to see if I could programmatically identify the conditions I saw just before Bitcoin broke its all-time high end of 2020. The signal picks up several rocket launch moments prior to launching which is quite cool. It also picks up a few false starts, however. In any case, I would have loved to be stopped out on those false starts but been there for all the starts this thing picks up.
It could probably use more confirmatory elements such as trailing conditions and volume perhaps?
BINANCE:BTCUSDTPERP


BITCOIN CME FUTURES GAPSDisplays information about Bitcoin CME Futures Gaps over BTCUSD (or XBTUSD) charts.
You can configure a threshold percentage to only display gaps whose size is greater than that percentage. The gap precentage is calculated based on the current close price.
Gaps up are displayed in Orange, gaps down in Green

Bitcoin Comparison to GBTC!This script tells you if GBTC is overvalued or undervalued compared to Bitcoin.

200 Week Moving Average HeatmapСolors part of the SMA depending on the change in % (delta %) to the previous value. From blue(none to low increase) through green(moderate increase) to red(high increase).


BTC CME PremiumThe Chicago Mercantile Exchange bitcoin futures price versus a volume weighted index of bitcoin spot markets.
Positive values (green) means the CME price is higher than the spot index.
Negative values (red) means the CME price is lower than the spot index.
Whether a high CME price is bullish or not is up for debate so make of it what you will.
Weekends are highlighted with soft blue shading because during the weekend CME trading is halted which obviously has a big impact on the premium.
There's an option to turn this shading off.
Markets included for the volume weighted index:
Coinbase USD
Bitstamp USD
Bitfinex USD
Kraken USD
FTX USD
Binance USDT
Huobi USDT
This indicator is free, enjoy.

gold price levels denominated in usd/gramsPlots the gold price (USD) for the quantities (grams) identified as support or resistance in the indicator settings. Default values are:
75 gold grams
300 gold grams
500 gold grams
1000 gold grams
5000 gold grams
More context: The purchasing power of Bitcoin

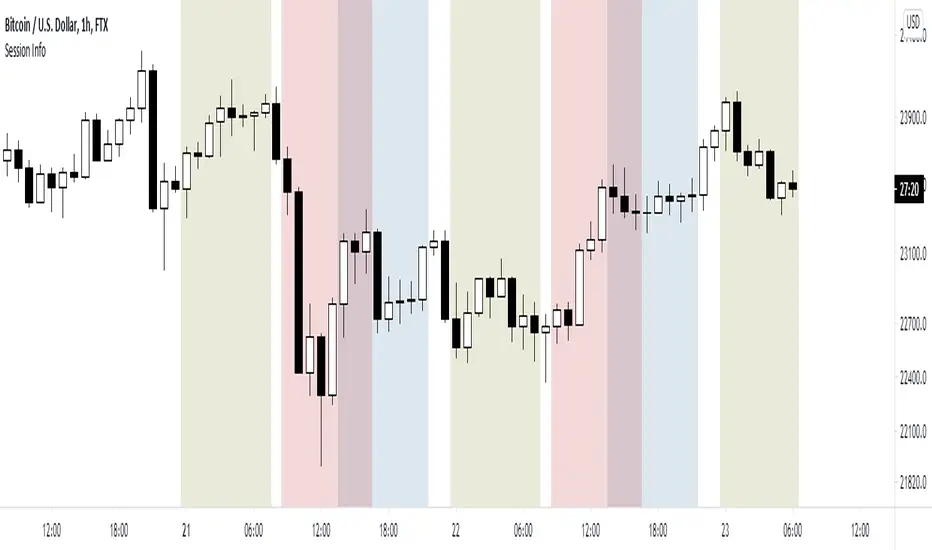
World market Session Information for bitcoinIt marks out different world markets active timings on the bitcoin charts.
You can also modify the script to a strategy and test out different strategies.
Finex PremiumBitfinex:BTCUSD premium/discount compared to market average spot exchanges.
Smoothed option available.

BTC On-Chain vs Exchange Volume ratioThis indicator compares on-chain transaction volume in BTC to spot exchange volume also denominated in BTC.
For the on-chain tx volume QUANDL data is used and for the exchange volume an aggregated index is made of some of the top spot exchanges.
Next a percentage ratio is made to give an idea of what type of volume is dominating.
Positive values (green) means on-chain volume is higher than exchange volume.
Negative values (red) means on-chain volume is lower than exchange volume.
These are the exchanges used for the spot index:
Binance USDT
Huobi USDT
Coinbase USD
Bitfinex USD
Bitstamp USD
Kraken USD
Bitflyer JPY
Bithumb KRW
Bittrex USDT
Poloniex USDT
In the settings you can choose to include or exclude certain exchanges.
There's also a smoothed moving average of which you can choose the length.
Because of limitations with the data you can only use this indicator on the daily time frame or higher.

Bitcoin Difficult Model [ChuckBanger]Simple script that graphically represents the mining difficulty of Bitcoin. It is ment to be used as a tool to decide when it is good time to dollar cost average (DCA) in your Bitcoin hodl position. When Price is below the difficulty model it is usually a good time to DCA.
Formula for the model used in this calculation is 0.002 * difficulty ^ 0.51. It is possible to change this numbers if necessarily.
