Leonid's Bitcoin Sharpe RatioThe Sharpe ratio is an old formula used to value the risk-adjusted return of an asset. It was developed by Nobel Laureate William F. Sharpe. In this case, I have applied it to Bitcoin with an adjustable look-back date.
The Sharpe Ratio shows you the average return earned after subtracting out the risk-free rate per unit of volatility (I've defaulted this to 0.02 ).
Volatility is a measure of the price fluctuations of an asset or portfolio. Subtracting the risk-free rate from the mean return allows you to understand what the extra returns are for taking the risk.
If the indicator is flashing red, Bitcoin is temporarily overbought (expensive).
If the indicator is flashing green, Bitcoin is temporarily oversold (cheap).
The goal of this indicator is to signal out local tops & bottoms. It can be adjusted as far as the lookback time but I have found 25-26 days to be ideal.
Bitcoin-btcusd-btc

BITCOIN CME FUTURES GAPSDisplays information about Bitcoin CME Futures Gaps over BTCUSD (or XBTUSD) charts.
You can configure a threshold percentage to only display gaps whose size is greater than that percentage. The gap precentage is calculated based on the current close price.
Gaps up are displayed in Orange, gaps down in Green

BITCOIN Miners Revenue VS Price Correlation OscillatorUse 3D(3-day candle) as timeframe for best reading.
------
original template for Correlation indicator was created by obaranova. credit goes to her.

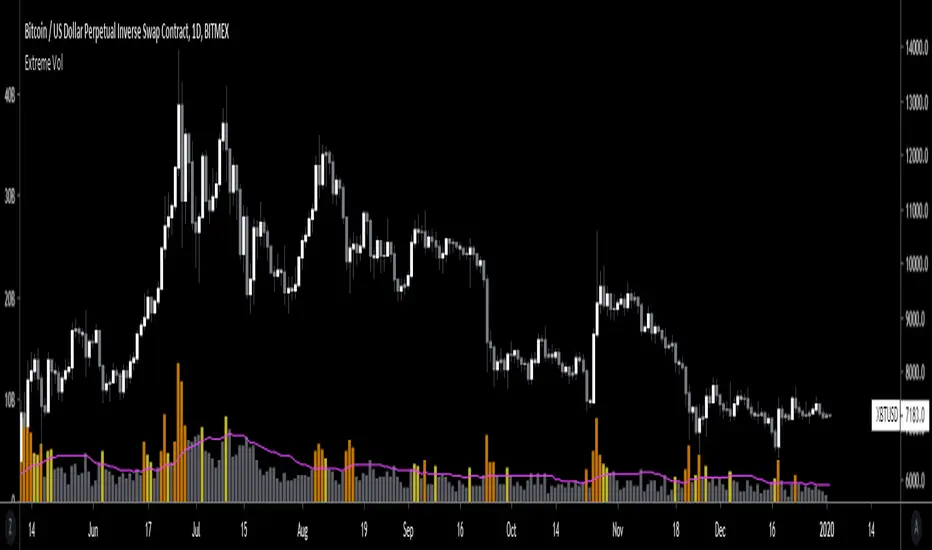
Extreme VolumeThis indicator colors volume bars that are significantly higher volume than the vol moving average ( SMA ). Utilizes two multiplier that can be adjusted by user. Defaults are that the indicator colors volume bars yellow if 20% higher than average, and orange if over 50% higher than average.
Reason why i created this indicator is i typically don't care about volume unless it is significantly higher than average. I find extreme volume useful for confirmation of a breakout, etc. This is why the rest of the volume bars are gray, they are still available for reference, but I dont pay much attention until volume is higher than average.
Also, when you load this indicator it will be in its own pane below the chart. To try and figure out how to add it to same pane as the chart was a huge pain in the ass. Once you figure it out it is pretty easy. I'll try to explain below...
Next to the indicator name you have the following options ... Hide, Settings, Show Source Code{}, Delete(X), and More (3 dots)
1) Click on "More" (3 dots)
2) Click on "Move To" then chose "Existing Pane Above"
3) Volume will likely be too large. Volume scale should be on left side, use your mouse to adjust volume smaller
4) Volume will likely be in the middle of your chart, click on it and drag it down.
BEST Mayer MultipleHello traders
I'm not a HODLer by any means. I know when to sell (or I think I know....) when an asset starts going against me too much.
Even if it's a "long-term" investment.
My mentor used to telling me this: "If a short-term trade becomes a long-term investment, then you're in for a hell of a ride".
I have no clue if Bitcoin/BTC will go back up or not - I don't even care because I'm an intraday trader.
What if BTC was actually a way to accumulate more fiat? Satoshi fooled us
I coded this Mayer Multiple according to the specifications below. By the way, I'm a big fan of Willy Woo. I've been monitoring all his work since I learned about crypto (10 minutes ago.... it's a joke come on)
charts.woobull.com
Scaling
To respect the Mayer's multiple model, I recommend to select the Logarithmic scaling as shown below
imgur.com
What Mayer's model says
Using the reference below, the model says we're in the oversold zone. But, we can be in that zone for months/years...
When a model says an asset could bounce in a 1000-7000 USD range... well... I don't know how I would be able to perform optimally with that insight. This is very subjective and not a recommendation.
Mayer's Multiple model reference
All the BEST
Dave

Bitcoin Prices InfoPanelHello traders
This script is based on the great Ricardo Santos InfoPanel script
It will display all the Bitcoin prices
The script is public so you can adjust according to your own needs
PS
You might have to scroll right on your chart to see the panel
Enjoy :)
Dave

CME & XBT - BTC Futures Settlement DatesHi everyone
This in an indicator inspired by Scarrff
I added the XBT quarterly and yearly settlement dates
Enjoy
David

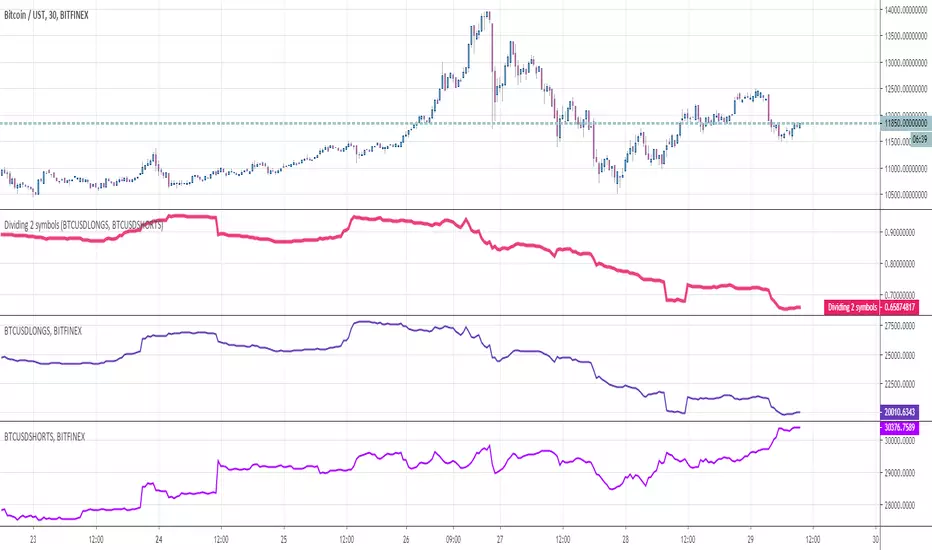
Dividing 2 symbolsHello Traders
This indicator is used to divide two assets between them. Why you would ask ?
For instance, in crypto trading, traders often look at the ratio Longs/Shorts or Shorts/Longs to figure out which side is leading the market and use this information as a powerful hedge for their next trade
Enjoy
Dave
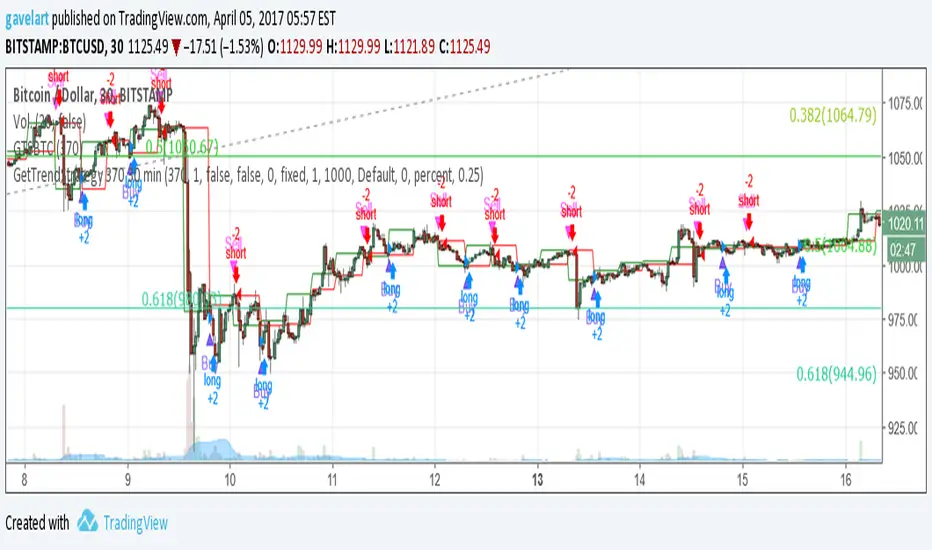
GetTrendStrategy 370 30 minModificación de la estrategia “GetTrendStrategy” optimizada para Bitcoin.