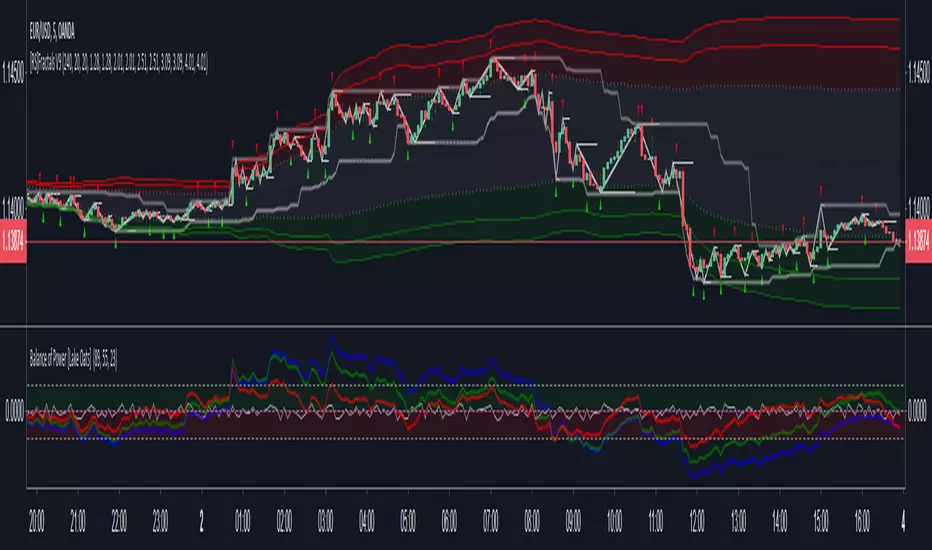
Balance of Power [Lake Oats] Balance of Power indicator - Useful tool for finding great Timing upon Entering Postions and Existing Postions, Also Useful for finding Normal and Hidden Divergences
Ayı Formasyonları
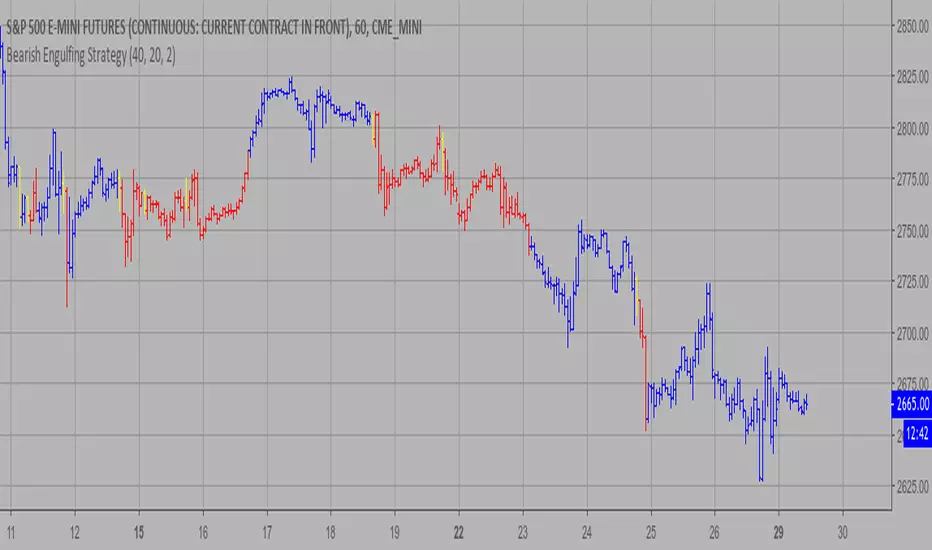
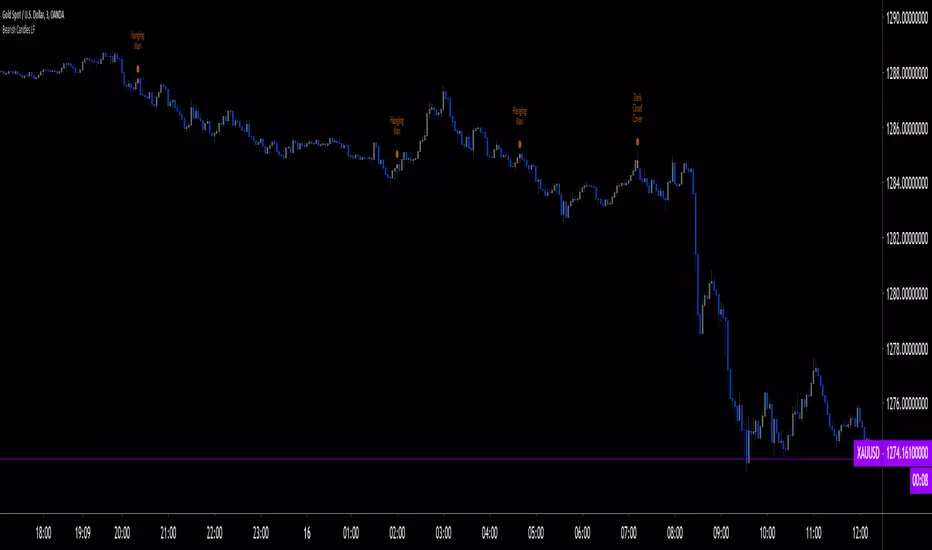
Bearish Engulfing Strategy This is a bearish candlestick reversal pattern formed by two candlesticks.
Following an uptrend, the first candlestick is a up candlestick which is
followed by a down candlestick which has a long real body that engulfs or
contains the real body of the prior bar. The Engulfing pattern is the reverse
of the Harami pattern.
WARNING:
- This script to change bars colors.
RSI Divergence PRO - Baby WhaleThis RSI script will show you the following things:
When the RSI moves between the green lines (40 - 80++) we are in a Bull market.
If the RSI moves between the middle green and red line (40-60) we have some sideways action.
And yes, when the RSI is between the red lines (60 - 20--) we can say that we are in a Bear market.
The dashed lines in between are on every 10 points on the RSI .
All colors and lines are customisable.
The real MVP -1.38% of this scrip is the RSI Divergence spotter.
A little green or red triangle will show up on the chart when a RSI Divergence is formed.
The Divergence is only shown when it happens in overbought (70+) or oversold (30-) regions to avoid too many signals.
I highly recommend not to jump in on every signal you get, but also use multiple reasons, like Elliot Wave or fib levels, before entering a trade.
This Pro version is for paid subscribers of TradingView only.
It will give you the ability to create alert inside of TradingView.
If you want access, just send a message please.
Much love from Baby Whale!!
🙏❤️🐳

RSI Divergence - Baby WhaleThis RSI script will show you the following things:
When the RSI moves between the green lines (40 - 80++) we are in a Bull market.
If the RSI moves between the middle green and red line (40-60) we have some sideways action.
And yes, when the RSI is between the red lines (60 - 20--) we can say that we are in a Bear market.
The dashed lines in between are on every 10 points on the RSI.
All colors and lines are customisable.
The real MVP of this scrip is the RSI Divergence spotter.
A little green or red triangle will show up on the chart when a RSI Divergence is formed.
The Divergence is only shown when it happens in overbought (70+) or oversold (30-) regions to avoid too many signals.
I highly recommend not to jump in on every signal you get, but also use multiple reasons, like Elliot Wave or fib levels, before entering a trade.
If you want access, just send a message please.
Much love from Baby Whale!!
🙏❤️🐳

RSI Divergence AlertRSI Divergence Alert
Input: range
Bullish RSI Divergence
yellow
Bearish RSI Divergence
red

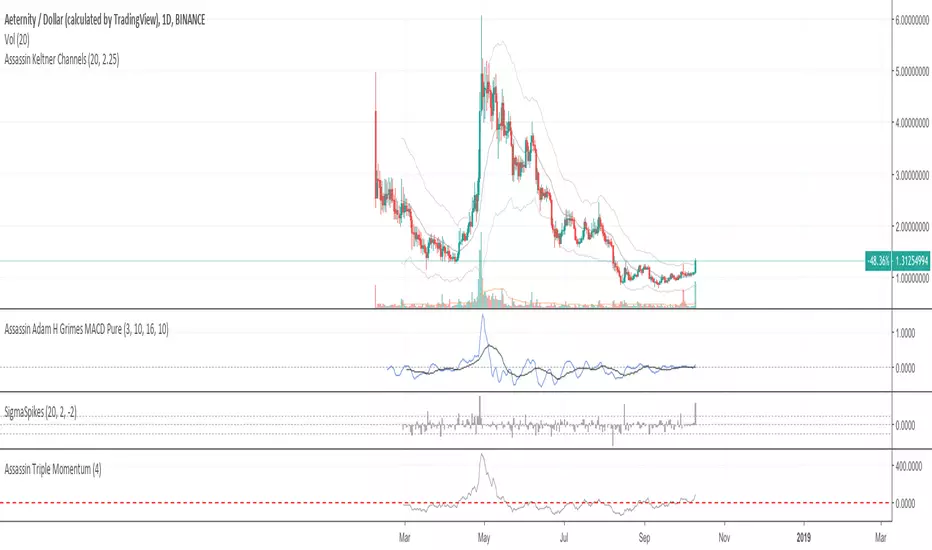
Assassin Triple MomentumThere are a red base line on chart.
If crossunder the base line , we can treat it as bear market. If crossover baseline , we can treat it as bull market.
you can setting the base line number yourself for some special case.
T3DMA Trend DirectionI am using T3 moving averages to generate the idea of what kind of bias I should take in a current market.
So, how does this works?
When the close is higher than T3EMA10, the trend direction is upwards,
When the close is lower than T3EMA10, the trend direction is downward.
Using this, we can assume that there is higher probability for market to continue it's trend up or down, hence trade only in that direction. T3EMA5 is used to exit any open positions before trend changes it's direction.
Have a nice day trading and enjoy.
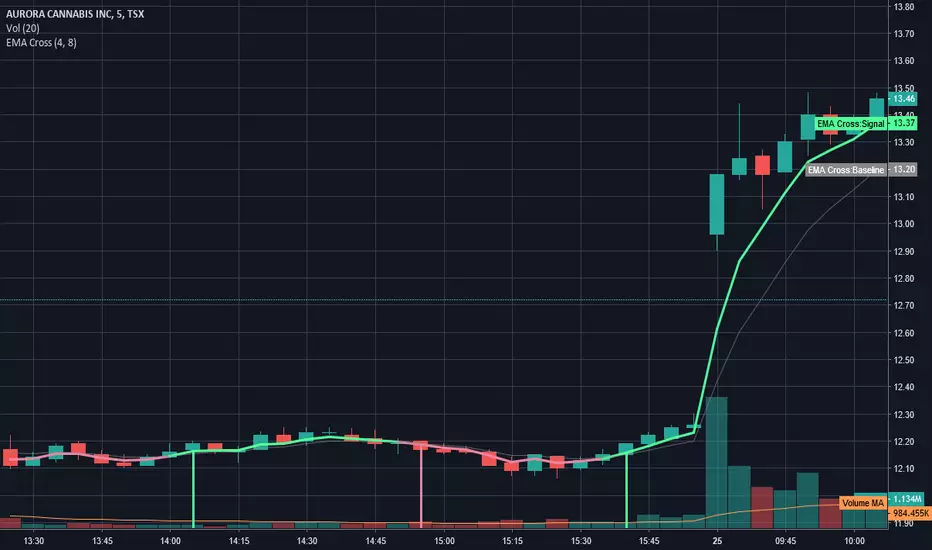
Stockr - EMA CrossesThis script lets you setup 2 EMA time frames and color codes the short line (signal) based on if it is above or below the longer term line (baseline)
When the short time frame crosses up the short line turns green and draws a green bar down to signal upward cross.
When the short time frame crosses down the short line turns red and draws a red bar down to signal downward cross
Oscillator Divergence HistogramIdentify Divergences on 6 oscillators simultaneously.
From the bottom up.
0 to 1 (black): MACD
1 to 2 (green): Elders Force Index
2 to 3 (blue): RSI
3 to 4 (purple): Awesome Oscillator
4 to 5 (red): Commodity channel index
5 to 6 (orange): Stochastic
You can change the identification of the divergence in the settings and use the Oscillator Divergences indicator to visually see them when testing.
This detects the following divergences between price and the oscillator.
Regular Bullish Divergence: Price lower low | Oscillator higher low
Regular Bearish Divergence: Price higher high | Oscillator lower high
Hidden Bullish Divergence: Price higher low | Oscillator lower low
Hidden Bearish Divergence: Price lower high | Oscillator higher high
Early warning alert system. This identifies a developing divergence and can be used to set alerts.
Colors
Bearish: Maroon
Bullish: Green
Hidden Bearish: Light brown
Hidden Bullish: Light green
Developing early warning are lighter shades of the above.

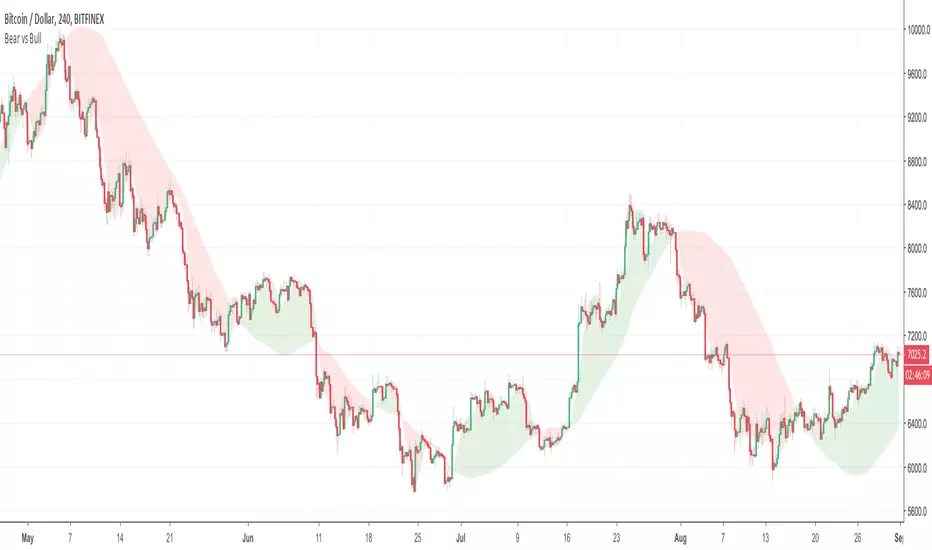
Bear vs Bull Trend indicator by Atilla YurtsevenHi Traders,
Bear vs Bull Trend indicator helps you to determine the trend direction easily. Using this indicator, you will not need to look for the cross-over anymore. You can simply choose your favorite Trend detection indicator from the properties (sma, wma, ema, linear). I usually use Linear trends.
Disclaimer: All the information in this article, including the algorithm & indicator, was provided and published for informational purposes only and should not be considered legal or financial advice.
PS: Please leave some comments and remember to follow me. I share only the indicators that i use.
Happy trading :)
Atilla Yurtseven
08-2018 Stochastic 5m [ALERT SETUP] [INDICATOR]This is an accumulation of small buy orders and a complete sell order strategy, that can be used for manual trading or for a trading bot. The strategy is based on stockastic divergences ( an indicator that I made myself and is published on my profile earlier ), and I added my personnal touch of course. Note that the bullish and bearish stochastic divergences are calculated separately and can be configured in the inputs.
To be used with a 5m timeframe, and on a flat or bullish pair.
Everyone can favorite the script, apply it to the chart, but only I can see or modify the code. If you need anything, leave a comment, thanks :D
More info about the script, such as inputs description, how to configure the script, strategy explanation, alert configuration can be found here : blockchainfiesta.com
--------------------------------------------------------------------------------------------------------------
I do commission work: TradingView Pine Script development & Reverse Engineering.
contact@blockchainfiesta.com.
You can also send me a message in TradingView or Discord (discord.gg)
Bitcoin address: 19sVQvCDmVfEACq7BiMnWSMqFPZ8qfSQ2K
ETH address: 0xc8a5d3a63a05db0c2363ea1c08b37a01cce9ebfb

Volume Plus (Volume+)View Total Volume, Bull Volume, and/or Bear Volume. View Volume Effectiveness to reveal how Volume has effected the price. View the Moving Average of any of the above metrics, selecting one or more types of moving averages(SMA, EMA, RMA, SWMA, VWMA, WMA, or ALMA). Create nearly infinite crossovers by activating the Secondary Moving Average and choosing a longer or shorter Length. Use the highlighter to quickly filter out noise and focus the events you're searching for, by choosing one or more highlight-scenarios from the Highlighting Menu. Use the Average Amplifier to fine tune your Highlighting results.
Use as an ordinary Volume Indicator
Show the Bullish volume within Total Volume
Show the Bearish volume within Total Volume
Show the Bullish and Bearish volume simultaneously within Total Volume
Create crossovers like this one, Bullish Volume Average with Bearish Volume Average
Show the gas mileage of volume, the Volume Effectiveness
Create crossovers like this, Volume Effectiveness 14 with Volume Effectiveness 60
Use Amplifiers to show things that are usually out of scale with one another, like Volume Effectiveness with Volume
Use the Highlighter to show anything, like here, when Bearish Volume was above average AND Volume Effectiveness was under average
From left to right, the Indicator Values are as follows:
1) Total True Volume (red, green, or gray when viewed alongside Bulls/Bears)
2) Volume Winner - Bulls v/s Bears (red or green)
3) Volume Loser - Bulls v/s Bears (red or green)
4) Volume Effectiveness (blue)
5) Design Spacer - Ignore This (green)
6) Design Spacer - Ignore This (red)
7) Total True Volume Primary Moving Average (dark gray)
8) Total True Volume Secondary Moving Average (dark gray)
9) Inferred Bullish Volume Primary Moving Average (dark green)
10) Inferred Bullish Volume Secondary Moving Average (dark green)
11) Inferred Bearish Volume Primary Moving Average (dark red)
12) Inferred Bearish Volume Secondary Moving Average (dark red)
13) Volume Effectiveness Primary Moving Average (blue)
14) Volume Effectiveness Secondary Moving Average (blue)
Click the sprocket and you'll find the following settings (which are explained below):
Total True Volume - This is your everyday, ordinary volume indicator, a total sum of the volume from each candle.
Inferred Bullish Volume - This subtracts Bearish Volume out of the Total True Volume. But without the bull-volume data from the exchange, we can only forensically infer the bullish volume by evaluating OHLC data to guess what ratio of upward v/s downward movement happened within the candle.
Inferred Bearish Volume - This subtracts Bullish Volume out of the Total True Volume. But without the bear-volume data from the exchange, we can only forensically infer the bearish volume by evaluating OHLC data to guess what ratio of downward v/s upward movement happened within the candle.
Volume Effectiveness - This shows how much price movement occurred for each unit of Volume, by dividing the Price Change of each candle by the Total True Volume of each candle. If this volume were gas-mileage, then Volume would be the gas and Price would be the mileage.
• Inferred Effectiveness - Rather than using the Price Change divided by the Total True Volume, this method of determining Volume Effectiveness uses the Total Price-Mileage divided by the Total True Volume. The Total Price-Mileage is determined by figuring the high minus low, the wick times two, and the tail times two, and ad

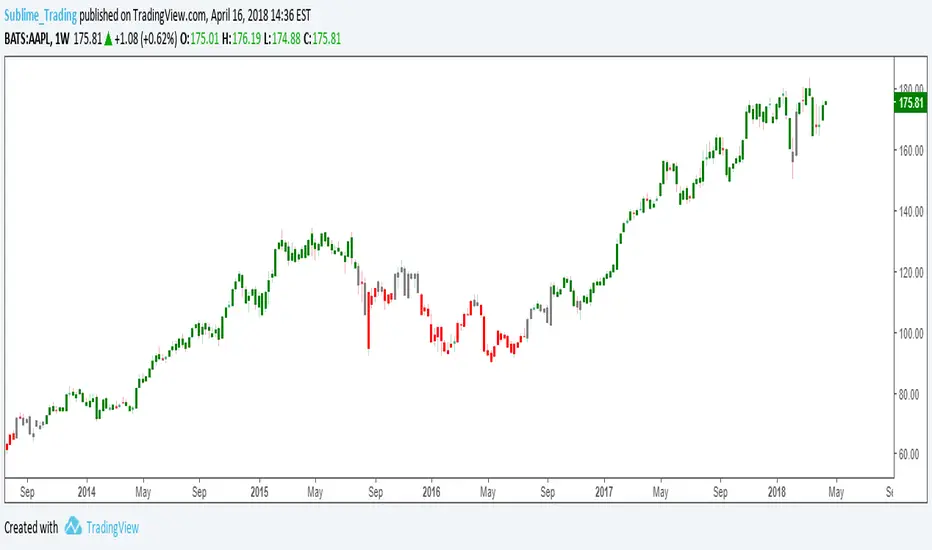
Fibonacci Retracement (S)-Silver
The Automatic Fib Retracement - Silver -0.24% script indicates the 50-61.8% pullback region.
The lines of the upper and lower pivots, the support and resistance areas are also highlighted.
Customisable Fib Length - Time period over which max and min pivots are chosen.
Offsetfib - Automatically offsets the pivots and sell zone as your entry position
will be some time after the upper and lower pivots are set.
Works well when used in combination with an oscillator which highlights Divergence.
A strategy based off buying the 50-618 with a defined stop loss and target can be the basis of your strategy.
This tool will automatically plot those points but a defined Risk Management strategy will always be needed.
Works best in Bearish trends but will work on all timeframes (Bearish correction in an uptrend also possible).
Previous pivots shown but be careful to identify which of the several pivots you are using.
Start at a larger timeframe and move down. (Entries consistent on several timeframes are golden)
Pivots and retracements are dynamic. Be sure to note your entry and targets.

Stochastique Divergences IndicatorHello,
I made a custom indicator.
Divergences with stochastique and price are really strong signals.
About the indicator
A bullish divergence happens when the stoch K makes a higher low and is depicted by a green triangle up.
A bearish divergence happens when the stoch K makes a lower high and is depicted by a red triangle down.
This script is the base for my next strategy that I should upload soon.
I will grant access (to this script and my others) to people willing to make a small donation.
Here is my BTC address : 19sVQvCDmVfEACq7BiMnWSMqFPZ8qfSQ2K
If you prefer ETH : 0xc8a5d3a63a05db0c2363ea1c08b37a01cce9ebfb
Send me a Private Message with the ID of the transaction
If you want to do some forward testing first, send me a message.
Also check blockchainfiesta.com


wTF50This is a customized trend filter that has several uses:
It helps identify trend direction, either bullish or bearish
It distinguishes between a pullback and a trend reversal
It helps identify areas where traders should stand aside
It highlights areas of consolidation
dTF50This is a customized trend filter that has several uses:
It helps identify trend direction, either bullish or bearish
It distinguishes between a pullback and a trend reversal
It helps identify areas where traders should stand aside
It highlights areas of consolidation
CCI AnalysesThis script analyses the CCI indicator values, showing when a fall in price or a rise in price may happen, or when the CCI is confirming the trend.
The user can personalize:
The period to be used and the range of the CCI bands ( by default)
The slow SMA period to be used and the price percentage variation to react for bullish/bearish
Consecutive number of bullish/bearish in order to consider the CCI as a trend confirmation rather than a price reversal

Bearish CandlesPlots 6 different kinds of bearish candlesticks. I started with HPotter's previous work, added 4 other types of bearish Candlesticks and bunched them in one indicator.
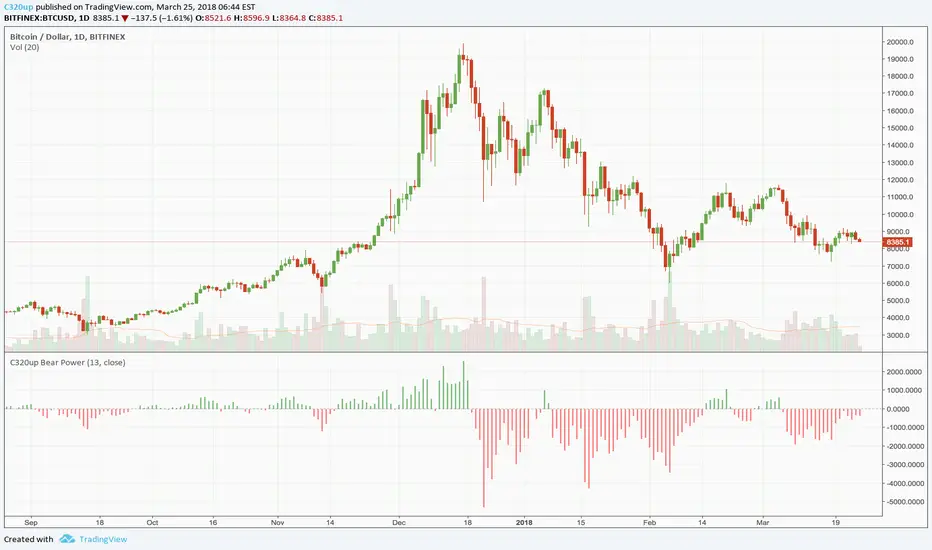
C320up Bear Power
C320up Bear Power
“The Bears Power oscillator was developed by Alexander Elder. It measures the difference between the lowest price and a 13-day Exponential Moving Average (EMA), plotted as a histogram. If the Bears Power indicator is below zero, it means sellers were able to drive price below the EMA. If the Bears Power indicator is above zero, it means buyers were able to keep the lowest price above the EMA. Bears Power is a fully unbounded oscillator with a base value of 0 and has no lower or upper limit. The indicator is often used in combination with other signals.” ~ TradingView
You can customise the colours of this indicator or change from histogram to area, line, etc., or a combination of these.
The default colours are Green (Bulls) for above zero, and Red (Bears) for below zero.
This indicator is not to be confused with Elder’s Force Index, which uses SMA and Volume.
CMYK VRMI◊ Introduction
This script indicates the relative movement of price x volume.
◊ Origin
Based on 'The Relative Momentum Index' by Roger Altman : February, 1993 issue of Technical Analysis of Stocks & Commodities magazine.
While RSI counts up and down days from close to close, the Relative Momentum Index counts up and down days from the close relative to a close x number of days ago.
This results in an RSI that is smoother. The input has been changed to the change of a smoothed close multiplied by a smoothed volume.
The polarity of VRMI indicates bearish/bullish movement.
◊ Adjustments
CMYK color theme applied.
◊ Usage
VRMI indicates the force the market moves with.
◊ Future Prospects
-
◊ ◊ ◊ ◊ ◊ ◊ ◊ ◊ ◊ ◊ ◊ ◊ ◊ ◊ ◊ ◊ ◊ ◊ ◊ ◊ ◊ ◊ ◊ ◊ ◊ ◊ ◊ ◊ ◊ ◊ ◊ ◊ ◊ ◊ ◊ ◊ ◊ ◊ ◊ ◊ ◊ ◊ ◊ ◊ ◊ ◊ ◊ ◊ ◊ ◊ ◊ ◊ ◊ ◊ ◊ ◊ ◊ ◊ ◊ ◊ ◊ ◊ ◊ ◊ ◊ ◊ ◊ ◊ ◊ ◊ ◊ ◊ ◊ ◊ ◊ ◊ ◊ ◊ ◊ ◊ ◊ ◊ ◊ ◊ ◊ ◊ ◊ ◊ ◊ ◊ ◊ ◊ ◊ ◊ ◊ ◊ ◊ ◊ ◊ ◊ ◊ ◊ ◊ ◊ ◊ ◊

CMYK VRMI RAYS ◊ Introduction
Introducing VRMI in this script, an RMI based on price movement and volume, to indicate bullish and bearish trends.
This script marks the background depending on RMI <> VRMI , VRMI polarity and large buy/sell sprees.
◊ Origin
Based on 'The Relative Momentum Index' by Roger Altman : February, 1993 issue of Technical Analysis of Stocks & Commodities magazine.
While RSI counts up and down days from close to close, the Relative Momentum Index counts up and down days from the close relative to a close x number of days ago.
This results in an RSI that is smoother.
In addition VRMI reacts quick, it is used to cut off latency from RMI, and it's polarity indicates the beginning and end of a trend.
Large buy sell sprees and detected in their proportion with an sma on the volume
◊ Adjustments
CMYK color theme applied.
◊ Usage
This indicator can be used to detect trends and mark reversals.
◊ Prospects
◊ ◊ ◊ ◊ ◊ ◊ ◊ ◊ ◊ ◊ ◊ ◊ ◊ ◊ ◊ ◊ ◊ ◊ ◊ ◊ ◊ ◊ ◊ ◊ ◊ ◊ ◊ ◊ ◊ ◊ ◊ ◊ ◊ ◊ ◊ ◊ ◊ ◊ ◊ ◊ ◊ ◊ ◊ ◊ ◊ ◊ ◊ ◊ ◊ ◊ ◊ ◊ ◊ ◊ ◊ ◊ ◊ ◊ ◊ ◊ ◊ ◊ ◊ ◊ ◊ ◊ ◊ ◊ ◊ ◊ ◊ ◊ ◊ ◊ ◊ ◊ ◊ ◊ ◊ ◊ ◊ ◊ ◊ ◊ ◊ ◊ ◊ ◊ ◊ ◊ ◊ ◊ ◊ ◊ ◊ ◊ ◊ ◊ ◊ ◊ ◊ ◊ ◊ ◊ ◊ ◊

Bearish Engulfing StrictMost of the engulfing indicators i tried seemed to only look at the candle bodies which i didnt like. This one takes into account the highs and lows as well. You get less signals but each one seem to be more reliable.
