Ichimoku Cloud with RSI (By Coinrule)The Ichimoku Cloud is a collection of technical indicators that show support and resistance levels, as well as momentum and trend direction. It does this by taking multiple averages and plotting them on a chart. It also uses these figures to compute a “cloud” that attempts to forecast where the price may find support or resistance in the future.
The Ichimoku Cloud was developed by Goichi Hosoda, a Japanese journalist, and published in the late 1960s. It provides more data points than the standard candlestick chart. While it seems complicated at first glance, those familiar with how to read the charts often find it easy to understand with well-defined trading signals.
The Ichimoku Cloud is composed of five lines or calculations, two of which comprise a cloud where the difference between the two lines is shaded in.
The lines include a nine-period average, a 26-period average, an average of those two averages, a 52-period average, and a lagging closing price line.
The cloud is a key part of the indicator. When the price is below the cloud, the trend is down. When the price is above the cloud, the trend is up.
The above trend signals are strengthened if the cloud is moving in the same direction as the price. For example, during an uptrend, the top of the cloud is moving up, or during a downtrend, the bottom of the cloud is moving down.
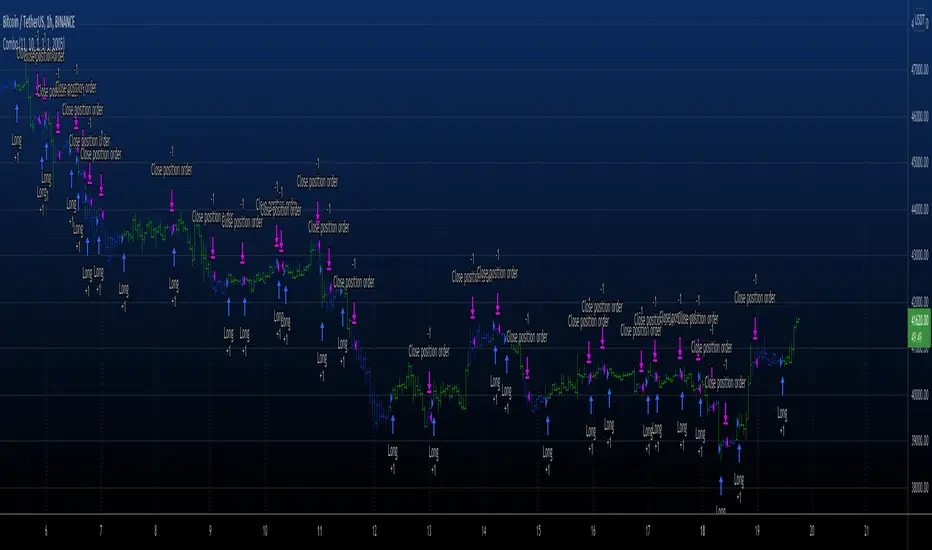
This strategy combines the Ichimoku Cloud with the RSI indicator to better enter trades.
Long/Short orders are placed when three basic signals are triggered.
Long Position:
Tenkan-Sen is above the Kijun-Sen
Chikou-Span is above the close of 26 bars ago
Close is above the Kumo Cloud
RSI is greater less than 50
Short Position:
Tenkan-Sen is below the Kijun-Sen
Chikou-Span is below the close of 26 bars ago
Close is below the Kumo Cloud
RSI is greater than 50
The script is backtested from 1 June 2022 and provides good returns.
The strategy assumes each order is using 30% of the available coins to make the results more realistic and to simulate you only ran this strategy on 30% of your holdings. A trading fee of 0.1% is also taken into account and is aligned to the base fee applied on Binance.
This script also works well on SOL (45m timeframe), BNB (1h timeframe), and ETH (1h timeframe).
Ayı Formasyonları

Inverse MACD + DMI Scalping with Volatility Stop (By Coinrule)This script is focused on shorting during downtrends and utilises two strength based indicators to provide confluence that the start of a short-term downtrend has occurred - catching the opportunity as soon as possible.
This script can work well on coins you are planning to hodl for long-term and works especially well whilst using an automated bot that can execute your trades for you. It allows you to hedge your investment by allocating a % of your coins to trade with, whilst not risking your entire holding. This mitigates unrealised losses from hodling as it provides additional cash from the profits made. You can then choose to hodl this cash, or use it to reinvest when the market reaches attractive buying levels.
Alternatively, you can use this when trading contracts on futures markets where there is no need to already own the underlying asset prior to shorting it.
ENTRY
The trading system uses the Momentum Average Convergence Divergence (MACD) indicator and the Directional Movement Index (DMI) indicator to confirm when the best time is for selling. Combining these two indicators prevents trading during uptrends and reduces the likelihood of getting stuck in a market with low volatility.
The MACD is a trend following momentum indicator and provides identification of short-term trend direction. In this variation it utilises the 12-period as the fast and 26-period as the slow length EMAs, with signal smoothing set at 9.
The DMI indicates what way price is trending and compares prior lows and highs with two lines drawn between each - the positive directional movement line (+DI) and the negative directional movement line (-DI). The trend can be interpreted by comparing the two lines and what line is greater. When the negative DMI is greater than the positive DMI, there are more chances that the asset is trading in a sustained downtrend, and vice versa.
The system will enter trades when two conditions are met:
1) The MACD histogram turns bearish.
2) When the negative DMI is greater than the positive DMI.
EXIT
The strategy comes with a fixed take profit combined with a volatility stop, which acts as a trailing stop to adapt to the trend's strength. Depending on your long-term confidence in the asset, you can edit the fixed take profit to be more conservative or aggressive.
The position is closed when:
Take-Profit Exit: +8% price decrease from entry price.
OR
Stop-Loss Exit: Price crosses above the volatility stop.
In general, this approach suits medium to long term strategies. The backtesting for this strategy begins on 1 April 2022 to 18 July 2022 in order to demonstrate its results in a bear market. Back testing it further from the beginning of 2022 onwards further also produces good returns.
Pairs that produce very strong results include SOLUSDT on the 45m timeframe, MATICUSDT on the 2h timeframe, and AVAUSDT on the 1h timeframe. Generally, the back testing suggests that it works best on the 45m/1h timeframe across most pairs.
A trading fee of 0.1% is also taken into account and is aligned to the base fee applied on Binance.

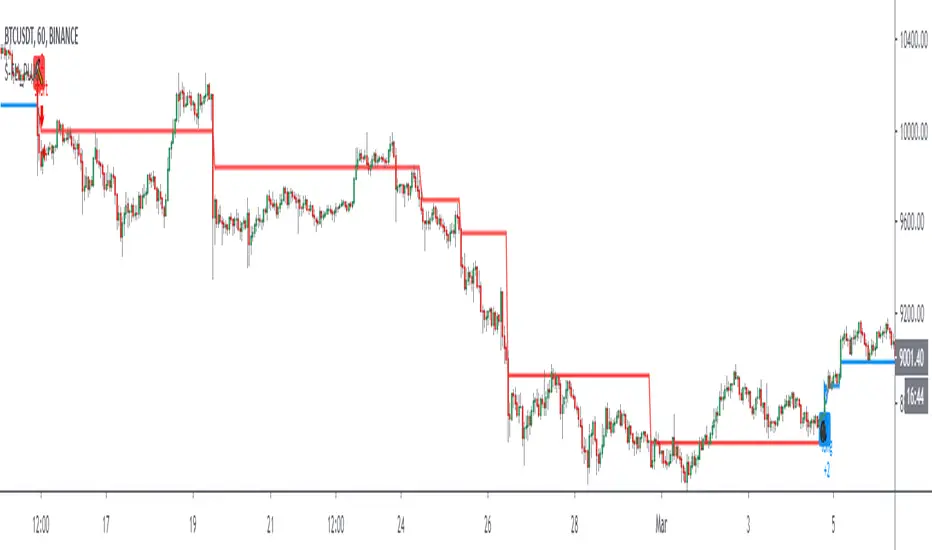
Short Swing Bearish MACD Cross (By Coinrule)This strategy is oriented towards shorting during downside moves, whilst ensuring the asset is trading in a higher timeframe downtrend, and exiting after further downside.
This script can work well on coins you are planning to hodl for long-term and works especially well whilst using an automated bot that can execute your trades for you. It allows you to hedge your investment by allocating a % of your coins to trade with, whilst not risking your entire holding. This mitigates unrealised losses from hodling as it provides additional cash from the profits made. You can then choose to hodl this cash, or use it to reinvest when the market reaches attractive buying levels. Alternatively, you can use this when trading contracts on futures markets where there is no need to already own the underlying asset prior to shorting it.
ENTRY
This script utilises the MACD indicator accompanied by the Exponential Moving Average (EMA) 450 to enter trades. The MACD is a trend following momentum indicator and provides identification of short-term trend direction. In this variation it utilises the 11-period as the fast and 26-period as the slow length EMAs, with signal smoothing set at 9.
The EMA 450 is used as additional confirmation to prevent the script from shorting when price is above this long-term moving average. Once price is above the EMA 450 the script will not open any shorts - preventing the rule from attempting to short uptrends. Due to this, this strategy is ideal for setting and forgetting.
The script will enter trades based on two conditions:
1) When the MACD signals a bearish cross. This occurs when the EMA 11 crosses below the EMA 26 within the MACD signalling the start of a potential downtrend.
2) Price has closed below the EMA 450. Price closing below this long-term EMA signals that the asset is in a sustained downtrend. Price breaking above this could indicate a bullish strength in which shorting would not be profitable.
EXIT
This script utilises a set take-profit and stop-loss from the entry of the trade. The take profit is set at 8% and the stop loss of 4%, providing a risk reward ratio of 2. This indicates the script will be profitable if it has a win ratio greater than 33%.
Take-Profit Exit: -8% price decrease from entry price.
OR
Stop-Loss Exit: +4% price increase from entry price.
Based on backtesting results across a selection of assets, the 45-minute and 1-hour timeframes are the best for this strategy.
The strategy assumes each order is using 30% of the available coins to make the results more realistic and to simulate you only ran this strategy on 30% of your holdings. A trading fee of 0.1% is also taken into account and is aligned to the base fee applied on Binance.
The backtesting data was recorded from December 1st 2021, just as the market was beginning its downtrend. We therefore recommend analysing the market conditions prior to utilising this strategy as it operates best on weak coins during downtrends and bearish conditions, however the EMA 450 condition should mitigate entries during bullish market conditions.

Combo 2/20 EMA & Bear Power This is combo strategies for get a cumulative signal.
First strategy
This indicator plots 2/20 exponential moving average. For the Mov
Avg X 2/20 Indicator, the EMA bar will be painted when the Alert criteria is met.
Second strategy
Bear Power Indicator
To get more information please see "Bull And Bear Balance Indicator"
by Vadim Gimelfarb.
WARNING:
- For purpose educate only
- This script to change bars colors.
RSI Average Swing BotThis is a modified RSI version using as a source a big length(50 candles) and an average of all types of sources for candle calculations such as ohlc4, close, high, open, hlc3 and hl2.
In this case we are going to use a 0-1 scale for an easier calculation, where 0.5 is going to be our middle point.
Above 0.5 we consider a bullish possibility.
Below 0.5 we consider a bearish possibility.
I made a small example bot using that initial logic, together with 2 exit points for long or short positions.
If there are any questions, let me know !

when bull D timeframeEcco a voi la mia strategia basata su atr con implementazioni personali per definire facilmente la condizione di mercato su btc e eth, come potete vedere punta ad identificare solo le salite più importati ignorando i falsi segnali che avvengono nelle fasi di bear market (o di incertezza). Da utilizzare con timeframe D.
Condivido una versione disponibile e funzionante gratuitamente fino al 31/12/2022 dopo tale data lo script tornerà a pagamento.
Here is my strategy based on atr with personal implementations to easily define the market condition on btc and eth, as you can see it aims to identify only the most important climbs ignoring the false signals that occur in the bear market (or uncertainty) phases. For use with timeframe D. I share a version available and working for free until 31/12/2022 after that date the script will return not for free.
Stay Tuned

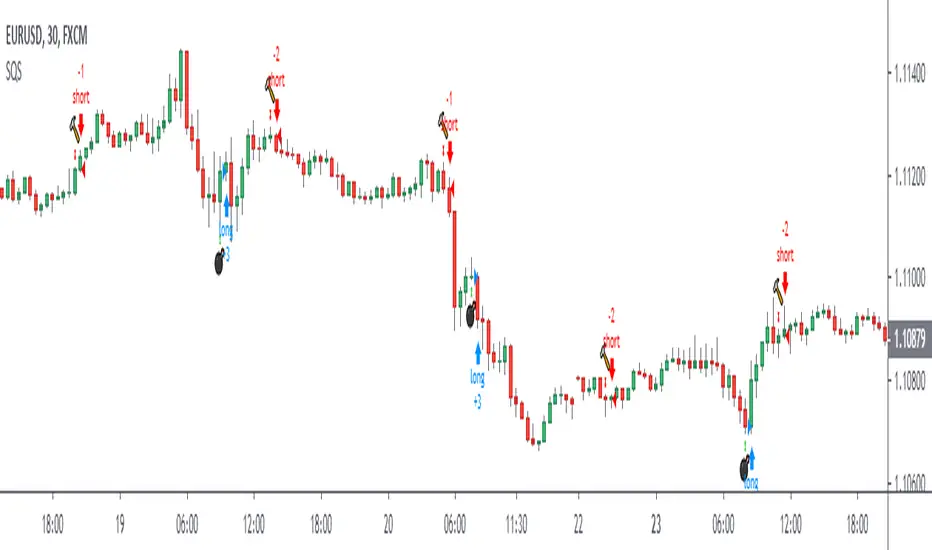
Macd Divergence + MTF EMA MACD Divergence + Multi Time Frame EMA
This Strategy uses 3 indicators: the Macd and two emas in different time frames
The configuration of the strategy is:
Macd standar configuration (12, 26, 9) in 1H resolution
10 periods ema, in 1H resolution
5 periods ema, in 15 minutes resolution
We use the two emas to filter for long and short positions.
If 15 minutes ema is above 1H ema, we look for long positions
If 15 minutes ema is below 1H ema, we look for short positions
We can use an aditional filter using a 100 days ema, so when the 15' and 1H emas are above the daily ema we take long positions
Using this filter improves the strategy
We wait for Macd indicator to form a divergence between histogram and price
If we have a bullish divergence, and 15 minutes ema is above 1H ema, we wait for macd line to cross above signal line and we open a long position
If we have a bearish divergence, and 15 minutes ema is below 1H ema, we wait for macd line to cross below signal line and we open a short position
We close both position after a cross in the oposite direction of macd line and signal line
Also we can configure a Take profit parameter and a trailing stop loss

Bear & Bull Zone Signal StrategySince I love to mix and match, here is something fresh and that actually works on the breakout of Ethereum without losing your ass on lagging indicators.
It blends some of the nice parts of my previous scripts while moving to big boy pants with a twist on the Fibonacci retracement using SMA and EMA at multiple levels to do a sanity check.
Is it too good to be true? Nope, just what happens when a Solution Architect starts messing around with crypto and applies engineering and mathematics to the mix. You get a strategy that really doesn't have high profit losses when you tweak it just the right way.
What's the right tweak you ask?
1. Start with a 30 minute timeframe and set your window start date to the date the market began the bear or bull run
2. Make sure you can see your strategy performance window (not the graph one)
3. Set Stop Loss and Target Profit to 50%
4. Use your mouse wheel or up and down arrows and mess around with the RSI, go down one at a time but no lower than 7. Whichever value displayed the highest long or short gain is the one to pick.
5. Now select long or short only based on whichever one shows the highest gain.
6. Now go to K and D, leave K as 3 and check what happens when D is 4 or 5. Leave D at the value that gives you the highest gain.
7. Now go to EMA Fast and Slow Lengths. Leave Fast at 5 and check what happens when the Slow is moved up to 11 or 12, do the gains go up. If not, check what happens when Slow is moved down to 9, 8, or 7. Whichever gives you the highest gain, leave it there. Now go mess with the fast length, keep in mind that fast must always be less than slow. So check values down to 3 and up to 6. Same concept, mo money...leave it be.
8. Now go mess with the Target Profit, I start at 5, hit enter, then go to 7, hit enter, then 9...up by 2 until I get to 21 to make sure I don't hastily pick a low one and always keep in mind between which values the gain switched from high to low. For example, in this example I published at 11 it was $5k and at 13 it was $3700 for the gains. So after I got up to 21 I went back to 11 and started going up by 0.01 steps until the value dropped, which was at 11.19 so I set it at 11.18.
9. Now stop loss is trickier, you've maximized the gains, which means if you set the stop loss at a low value you will sacrifice gains. Typically by this point your loss is less than 10% with this script. So, my approach is to find the value where the stop loss doesn't change what I've tweaked already. In this example, I did the same start at 5 and go up by 2 and saw that when I went to 17 it stopped changing. So I started going back down by 0.5 and saw at 15.5 the gains went lower again. Now I started going back up in steps of 0.01 and at 15.98 it went back to the high gain I already tweaked for. I kept stop loss there and unleashed the strategy on ETH.
So far so good, no bad trades and it's been behaving pretty well.

Sentiment analysis combined with multiple MA types for CRYPTOThis is a strategy made from price action combined with multiple moving averages calculations used for the candle histograms.
In this case we calculate the bear and the bull candles based on the next criteria :
Bull candle : ((CLOSE - LOW ) + (HIGH -OPEN) / 2 ) / Candle length
Bear candle: ((HIGH - CLOSE ) + (OPEN-LOW ) / 2 ) / Candle length
Once we have the candle we use moving average to smooth the process, and then we calculate the differece between the bull ma and bear ma.
The result is going to be our histogram.
Once we have the histogram we can start setting up rules for entries and exit.
If you have any question, please let me know!

Strategy Follow Line MTF Any MM AverageThe objective is only to evaluate different configurations of the indicator "Follow Line MTF Any MM Average".
The strategy does not have position management, it's very basic, this indicator should be used to see trend, range zones, evaluate the best areas to enter the market, use higher time frames to confirm a direction can be useful.
I do not recommend using only this indicator to trade, because you can lose all your money if you do not know what you are doing.
I hope you find it useful.
Successes
Strategy Follow Line Indicator The objective is only to evaluate different configurations, I do not recommend using only this indicator to trade, because you can lose all your money if you do not know what you are doing.
I hope you find it useful.
Successes

Strategy PyramiCoverStrategy for pyramidization and coverage. (Indicator PyramiCover)
Recommended time frame 60 min.

Strategy Quadratic Semaphore I add a basic strategy for the "Quadratic traffic light" indicator, it can help to find a good configuration.
Regards.
[BERA] KEANU REEVES STRATEGY TESTThis is a strategy test of my indicator.
Indicator based on Average true range.
LIME ARROW = LONG
RED ARROW = SHORT
LIME COLOR BARS IF GREEN ARROW CONDITION VALID.
RED COLOR BARS IF RED ARROW CONDITION VALID.

Bull and Bear Fear Expert by Walter Downs StrategyBull and Bear Fear Expert by Walter Downs Strategy

Combo Backtest 123 Reversal & Bear Power This is combo strategies for get
a cumulative signal. Result signal will return 1 if two strategies
is long, -1 if all strategies is short and 0 if signals of strategies is not equal.
First strategy
This System was created from the Book "How I Tripled My Money In The
Futures Market" by Ulf Jensen, Page 183. This is reverse type of strategies.
The strategy buys at market, if close price is higher than the previous close
during 2 days and the meaning of 9-days Stochastic Slow Oscillator is lower than 50.
The strategy sells at market, if close price is lower than the previous close price
during 2 days and the meaning of 9-days Stochastic Fast Oscillator is higher than 50.
Second strategy
Bear Power Indicator
To get more information please see "Bull And Bear Balance Indicator"
by Vadim Gimelfarb.
WARNING:
- For purpose educate only
- This script to change bars colors.

Bearish&Bullish Engulfing (created by LucaBono)Questo indicatore (o price action pattern) stampa sul grafico delle frecce o barre colorate (modificabili dalle impostazioni) quando si verificano entrambi i segnali del Bearish e Bullish Engulfing ufficiali, ovvero quando il corpo della candela è più ampio dell'intera candela precedente.
Il segnale LONG si effettua quando il massimo della Bullish bar viene rotto dalla candela successiva.
Il segnale SHORT viceversa si effettua alla rottura del minimo.
E' più facile trovare questo tipo di segnali su timefrime giornaliero e mercati come azioni, futures e titoli che non stanno aperti 24h.
Consiglio sempre di accompagnare questi segnali ad altri tipi di segnali o analisi per maggiorare le probabilità di successo e di tenuta del trade.
This indicator (or price action pattern) prints on the graph arrows or colored bars (which can be changed from the settings) when both official Bearish and Bullish Engulfing signals occur, ie when the body of the candle is wider than the entire previous candle.
The LONG signal is made when the maximum of the Bullish bar is broken by the next candle.
The SHORT signal, on the other hand, is performed when the minimum is broken.
It is easier to find this type of signals on daily timefrime and markets like stocks, futures and stocks that are not open 24h.
I always advise to accompany these signals to other types of signals or analyzes to increase the chances of success and stability of the trade.

LazyBear's Wave Trend Strategy by SDMFHello.
This is a strategy using the Lazy Bears Wave Trend indicator which he was so nice to release for free.
I heavily modified it and added a huge amount of options for the indicator as well as for the strategy.
Unfortunately it's locked with a passcode for now so my friends can use it
The results above are nit picked for oil 15 minute chart.
using 40% of our equity per trade on 50x leverage.
these are not 100% realistic altho shouldn't be too far from the truth.
Have not tried it on crypto.
Script is in Beta version and will get upgraded plenty in the near future.

Bearish Harami Backtest This is a bearish reversal pattern formed by two candlesticks in which a short
real body is contained within the prior session's long real body. Usually the
second real body is the opposite color of the first real body. The Harami pattern
is the reverse of the Engulfing pattern.
WARNING:
- For purpose educate only
- This script to change bars colors.

Bearish Engulfing Backtest This is a bearish candlestick reversal pattern formed by two candlesticks.
Following an uptrend, the first candlestick is a up candlestick which is
followed by a down candlestick which has a long real body that engulfs or
contains the real body of the prior bar. The Engulfing pattern is the reverse
of the Harami pattern.
WARNING:
- For purpose educate only
- This script to change bars colors.

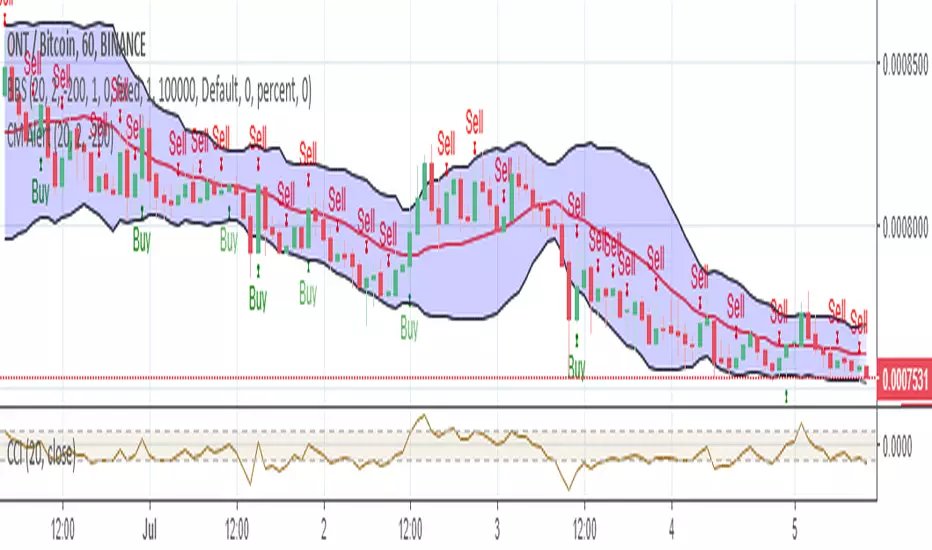
Bollinger Bear SniperThis script uses Bollinger Band but with different interpretation. The upper Bollinger Band is the resistant level, the lower Bollinger Band is the base or support level. The Commodity Channel Index (CCI) and the Bollinger Bandwidth helps us avoid high risk.
The script identifies candles that are marking bold upward moves in prices and fires buy signal. Sales signals are fired when the candle closes in positive. The idea is to buy and sell on the same candle or next positively closed candle. This is anti-bear-anti-bags strategy. You either make profit or loss holding no bag. When you gain more than lose you are in business. This script is set to gain more than lose. We however offer no guarantee, expressed or implied. We are NOT responsible.
Confluence Strategy Backtest This is modified version of Dale Legan's "Confluence" indicator written by Gary Fritz.
================================================================
Here is Gary`s commentary:
Since the Confluence indicator returned several "states" (bull, bear, grey, and zero),
he modified the return value a bit:
-9 to -1 = Bearish
-0.9 to 0.9 = "grey" (and zero)
1 to 9 = Bullish
The "grey" range corresponds to the "grey" values plotted by Dale's indicator, but
they're divided by 10.
You can change long to short in the Input Settings
Please, use it only for learning or paper trading. Do not for real trading.

Bull And Bear Balance Strategy Backtest This new indicator analyzes the balance between bullish and
bearish sentiment.
One can cay that it is an improved analogue of Elder Ray indicator.
To get more information please see "Bull And Bear Balance Indicator"
by Vadim Gimelfarb.
This modified strategy backtest from HPotter
