Enhanced KLSE Banker Flow Oscillator# Enhanced KLSE Banker Flow Oscillator
## Description
The Enhanced KLSE Banker Flow Oscillator is a sophisticated technical analysis tool designed specifically for the Malaysian stock market (KLSE). This indicator analyzes price and volume relationships to identify potential smart money movements, providing early signals for market reversals and continuation patterns.
The oscillator measures the buying and selling pressure in the market with a focus on detecting institutional activity. By combining money flow calculations with volume filters and price action analysis, it helps traders identify high-probability trading opportunities with reduced noise.
## Key Features
- Dual-Timeframe Analysis: Combines long-term money flow trends with short-term momentum shifts for more accurate signals
- Adaptive Volume Filtering: Automatically adjusts volume thresholds based on recent market conditions
- Advanced Divergence Detection: Identifies potential trend reversals through price-flow divergences
- Early Signal Detection: Provides anticipatory signals before major price movements occur
- Multiple Signal Types: Offers both early alerts and strong confirmation signals with clear visual markers
- Volatility Adjustment: Adapts sensitivity based on current market volatility for more reliable signals
- Comprehensive Visual Feedback: Color-coded oscillator, signal markers, and optional text labels
- Customizable Display Options: Toggle momentum histogram, early signals, and zone fills
- Organized Settings Interface: Logically grouped parameters for easier configuration
## Indicator Components
1. Main Oscillator Line: The primary banker flow line that fluctuates above and below zero
2. Early Signal Line: Secondary indicator showing potential emerging signals
3. Momentum Histogram: Visual representation of flow momentum changes
4. Zone Fills: Color-coded background highlighting positive and negative zones
5. Signal Markers: Visual indicators for entry and exit points
6. Reference Lines: Key levels for strong and early signals
7. Signal Labels: Optional text annotations for significant signals
## Signal Types
1. Strong Buy Signal (Green Arrow): Major bullish signal with high probability of success
2. Strong Sell Signal (Red Arrow): Major bearish signal with high probability of success
3. Early Buy Signal (Blue Circle): First indication of potential bullish trend
4. Early Sell Signal (Red Circle): First indication of potential bearish trend
5. Bullish Divergence (Yellow Triangle Up): Price making lower lows while flow makes higher lows
6. Bearish Divergence (Yellow Triangle Down): Price making higher highs while flow makes lower highs
## Parameters Explained
### Core Settings
- MFI Base Length (14): Primary calculation period for money flow index
- Short-term Flow Length (5): Calculation period for early signals
- KLSE Sensitivity (1.8): Multiplier for flow calculations, higher = more sensitive
- Smoothing Length (5): Smoothing period for the main oscillator line
### Volume Filter Settings
- Volume Filter % (65): Minimum volume threshold as percentage of average
- Use Adaptive Volume Filter (true): Dynamically adjusts volume thresholds
### Signal Levels
- Strong Signal Level (15): Threshold for strong buy/sell signals
- Early Signal Level (10): Threshold for early buy/sell signals
- Early Signal Threshold (0.75): Sensitivity factor for early signals
### Advanced Settings
- Divergence Lookback (34): Period for checking price-flow divergences
- Show Signal Labels (true): Toggle text labels for signals
### Visual Settings
- Show Momentum Histogram (true): Toggle the momentum histogram display
- Show Early Signal (true): Toggle the early signal line display
- Show Zone Fills (true): Toggle background color fills
## How to Use This Indicator
### Installation
1. Add the indicator to your TradingView chart
2. Default settings are optimized for KLSE stocks
3. Customize parameters if needed for specific stocks
### Basic Interpretation
- Oscillator Above Zero: Bullish bias, buying pressure dominates
- Oscillator Below Zero: Bearish bias, selling pressure dominates
- Crossing Zero Line: Potential shift in market sentiment
- Extreme Readings: Possible overbought/oversold conditions
### Advanced Interpretation
- Divergences: Early warning of trend exhaustion
- Signal Confluences: Multiple signal types appearing together increase reliability
- Volume Confirmation: Signals with higher volume are more significant
- Momentum Alignment: Histogram should confirm direction of main oscillator
### Trading Strategies
#### Trend Following Strategy
1. Identify market trend direction
2. Wait for pullbacks shown by oscillator moving against trend
3. Enter when oscillator reverses back in trend direction with a Strong signal
4. Place stop loss below/above recent swing low/high
5. Take profit at previous resistance/support levels
#### Counter-Trend Strategy
1. Look for oscillator reaching extreme levels
2. Identify divergence between price and oscillator
3. Wait for oscillator to cross Early signal threshold
4. Enter position against prevailing trend
5. Use tight stop loss (1 ATR from entry)
6. Take profit at first resistance/support level
#### Breakout Confirmation Strategy
1. Identify stock consolidating in a range
2. Wait for price to break out of range
3. Confirm breakout with oscillator crossing zero line in breakout direction
4. Enter position in breakout direction
5. Place stop loss below/above the breakout level
6. Trail stop as price advances
### Signal Hierarchy and Reliability
From highest to lowest reliability:
1. Strong Buy/Sell signals with divergence and high volume
2. Strong Buy/Sell signals with high volume
3. Divergence signals followed by Early signals
4. Strong Buy/Sell signals with normal volume
5. Early Buy/Sell signals with high volume
6. Early Buy/Sell signals with normal volume
## Complete Trading Plan Example
### KLSE Market Trading System
#### Pre-Trading Preparation
1. Review overall market sentiment (bullish, bearish, or neutral)
2. Scan for stocks showing significant banker flow signals
3. Note key support/resistance levels for watchlist stocks
4. Prioritize trade candidates based on signal strength and volume
#### Entry Rules for Long Positions
1. Banker Flow Oscillator above zero line (positive flow environment)
2. One or more of the following signals present:
- Strong Buy signal (green arrow)
- Bullish Divergence signal (yellow triangle up)
- Early Buy signal (blue circle) with confirming price action
3. Entry confirmation requirements:
- Volume above 65% of 20-day average
- Price above short-term moving average (e.g., 20 EMA)
- No immediate resistance within 3% of entry price
4. Entry on the next candle open after signal confirmation
#### Entry Rules for Short Positions
1. Banker Flow Oscillator below zero line (negative flow environment)
2. One or more of the following signals present:
- Strong Sell signal (red arrow)
- Bearish Divergence signal (yellow triangle down)
- Early Sell signal (red circle) with confirming price action
3. Entry confirmation requirements:
- Volume above 65% of 20-day average
- Price below short-term moving average (e.g., 20 EMA)
- No immediate support within 3% of entry price
4. Entry on the next candle open after signal confirmation
#### Position Sizing Rules
1. Base risk per trade: 1% of trading capital
2. Position size calculation: Capital × Risk% ÷ Stop Loss Distance
3. Position size adjustments:
- Increase by 20% for Strong signals with above-average volume
- Decrease by 20% for Early signals without confirming price action
- Standard size for all other valid signals
#### Stop Loss Placement
1. For Long Positions:
- Place stop below the most recent swing low
- Minimum distance: 1.5 × ATR(14)
- Maximum risk: 1% of trading capital
2. For Short Positions:
- Place stop above the most recent swing high
- Minimum distance: 1.5 × ATR(14)
- Maximum risk: 1% of trading capital
#### Take Profit Strategy
1. First Target (33% of position):
- 1.5:1 reward-to-risk ratio
- Move stop to breakeven after reaching first target
2. Second Target (33% of position):
- 2.5:1 reward-to-risk ratio
- Trail stop at previous day's low/high
3. Final Target (34% of position):
- 4:1 reward-to-risk ratio or
- Exit when opposing signal appears (e.g., Strong Sell for long positions)
#### Trade Management Rules
1. After reaching first target:
- Move stop to breakeven
- Consider adding to position if new confirming signal appears
2. After reaching second target:
- Trail stop using banker flow signals
- Exit remaining position when:
- Oscillator crosses zero line in opposite direction
- Opposing signal appears
- Price closes below/above trailing stop level
3. Maximum holding period:
- 20 trading days for trend-following trades
- 10 trading days for counter-trend trades
- Re-evaluate if targets not reached within timeframe
#### Risk Management Safeguards
1. Maximum open positions: 5 trades
2. Maximum sector exposure: 40% of trading capital
3. Maximum daily drawdown limit: 3% of trading capital
4. Mandatory stop trading rules:
- After three consecutive losing trades
- After reaching 5% account drawdown
- Resume after two-day cooling period and strategy review
#### Performance Tracking
1. Track for each trade:
- Signal type that triggered entry
- Oscillator reading at entry and exit
- Volume relative to average
- Price action confirmation patterns
- Holding period
- Reward-to-risk achieved
2. Review performance metrics weekly:
- Win rate by signal type
- Average reward-to-risk ratio
- Profit factor
- Maximum drawdown
3. Adjust strategy parameters based on performance:
- Increase position size for highest performing signals
- Decrease or eliminate trades based on underperforming signals
## Advanced Usage Tips
1. Combine with Support/Resistance:
- Signals are more reliable when they occur at key support/resistance levels
- Look for banker flow divergence at major price levels
2. Multiple Timeframe Analysis:
- Use the oscillator on both daily and weekly timeframes
- Stronger signals when both timeframes align
- Enter on shorter timeframe when confirmed by longer timeframe
3. Sector Rotation Strategy:
- Compare banker flow across different sectors
- Rotate capital to sectors showing strongest positive flow
- Avoid sectors with persistent negative flow
4. Volatility Adjustments:
- During high volatility periods, wait for Strong signals only
- During low volatility periods, Early signals can be more actionable
5. Optimizing Parameters:
- For more volatile stocks: Increase Smoothing Length (6-8)
- For less volatile stocks: Decrease KLSE Sensitivity (1.2-1.5)
- For intraday trading: Reduce all length parameters by 30-50%
## Fine-Tuning for Different Markets
While optimized for KLSE, the indicator can be adapted for other markets:
1. For US Stocks:
- Reduce KLSE Sensitivity to 1.5
- Increase Volume Filter to 75%
- Adjust Strong Signal Level to 18
2. For Forex:
- Increase Smoothing Length to 8
- Reduce Early Signal Threshold to 0.6
- Focus more on divergence signals than crossovers
3. For Cryptocurrencies:
- Increase KLSE Sensitivity to 2.2
- Reduce Signal Levels (Strong: 12, Early: 8)
- Use higher Volume Filter (80%)
By thoroughly understanding and properly implementing the Enhanced KLSE Banker Flow Oscillator, traders can gain a significant edge in identifying institutional money flow and making more informed trading decisions, particularly in the Malaysian stock market.
Bankerfund

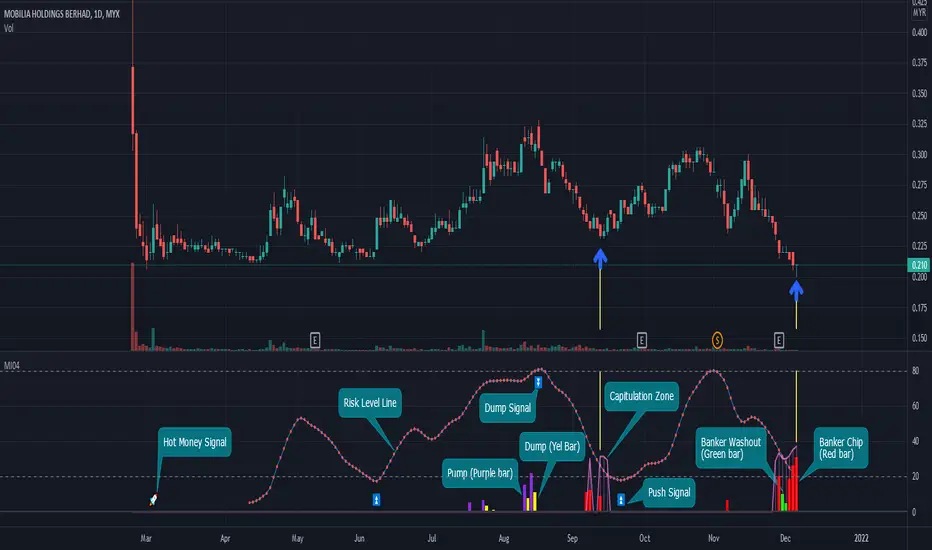
Banker Chip Pro (MI04)The Banker Chip Pro (MI04) indicator is used to track the activity of the banker collecting shares in the stage when price unexpectedly drops drastically,
and also pump & dump action with strong pull-up in stock price.
Therefore, traders need to remain cautions while using this indicator in the trendless market to avoid losing thier capital.
Banker Chip (Red bar) represents the banker's start engaging in the collection phase, while the Banker Washout (Green bar) represents the banker's washout to accumulate more chips.
Thus, if a Red bar is found near the end of a stock's decline, there is a high probability will form a wave of a rebound.
The last bar method is what it's called.
The Pump (Purple bar) represents the banker boosting up the stock price to attract regular investors.
The Dump (Yellow bar) represents regular investors committed to the stock, which is banker profit-taking activity (dump) that may result the price to collapse later.
The Capitulation Zone is when investors give up the stock by selling all the positions during periods of decline. It is a hint of bottom in pricing and consequently a good opportunity to observe whether can form a mark up phase (higher pivot highs and higher pivot lows)
The Risk Level Line (RLL) represents the risk level zone from horizontal 0 to 100. When the RLL rises beyond 80, it is considered a risk zone, may lead to a downward move.
Thus, investors who intend to enter the market at the bottom might use 20 as a safety zone and pay attention to the stock's trend in the future.
Banker Chip Pro features a total of 3 signals which are ⏫️ push signal and 🚀 hot money signal for bottom strategy and ⏬️ dump signal for an exit strategy.
This is referred to as signal method.
[blackcat] L5 Banker Fund Flow Trend Oscillator X Level: 5
Background
The large funds or banker fund are often referred to as Whale. Whale can have a significant impact on the price movements in various markets, especially in cryptocurrency . Therefore, how to monitor Whale trends is of great significance both in terms of fundamentals and technical aspects. I had published (blackcat1402) L3 Banker Fund Flow Trend Oscillator as open sourced version. Since this indicator is one of the most popular indicators in my collections. Many requested advanced features and improvements on accuracy. Here is the link of free version of L3 Banker Fund Flow Trend Oscillator:
Function
L5 Banker Fund Flow Trend Oscillator X can give you a model of complete banker fund flow operation in cycles. Compared to L3 free and open source version, it contains more advanced algorithms to provide entries. It is comprehensive to disclose the price trend with dynamic overbought and oversold tables. Compared to L4, which is also powerful, but they are using different banker fund engines. L4 is more suitable for those who have been used to L3 already. L5 is slightly different in visual effect and algorithm core, which is much different to L4 and L3. It can depict much clearer trajectory of banker fund as an oscillator. That is the reason why I list this as Level 5, which is closed source and invited-only. Unlike L4, whose cycle of banker fund flow may have 5 steps in max as entry, increase position, decrease position, exit, and weak rebound for exit, L5 only have buy and sell signal with a customized entry signal filter to filter out crowded entry signals.
This indicator derives from "(blackcat) L3 Banker Fund Flow Trend Oscillator". Therefore, it is an oscillator indicator with overbought and oversold threshold levels. However, it combine several novel indicators together but mainly focus on Whale Jump (Whale Pump and Whale Dump), Blackcat1402 featured supertrend indicator (entry signal = supertrend && oscillator signal), trading risk assessment indicator.
In case you are not familiar my indicators:
(blackcat) L5 Whales Jump Out of Ocean X:
(blackcat) L1 Trading Risk Assessment Indicator (I inverted it in this indicator here):
(blackcat) L4 Banker Fund Flow Trend Oscillator:
Indicator Set
Banker Fund Flow Trend Oscillator X, providing swing oscillator and entry signal.
Blackcat1402 Featured Supertrend, providing colors (green for bull and red for bear) on CurrentSafetyLevel of "Trading Risk Assessment Indicator".
Whales Jump Out of Ocean X, whale pumps and dumps
Trading Risk Assessment Indicator, output CurrentSafetyLevel, which is a large time frame oscillator ranging from overbought and oversold zones.
Inputs
EntryFiltPeriod --> Entry Signal Filter Period, default value is 5, which means crowded entry signal in future 5 bars will be ignored.
Safe Bottom --> User defined safe bottom threshold.
Risky Top --> User defined risky top threshold.
Oscillator Center --> define the center value of Oscillator X, which will influence long entry signal generation
Whale Scaler --> A scaling factor input to see whale dumps and pump more clearly in vision.
The other inputs --> Oscillator divergence inputs.
Golden Cross --> According to community feedbacks, popular L3 Yellow Candles for Banker Fund Entry are added Now. It is represented as a Yellow Cross and You can activate and deactivate them in indicator settings.
Dynamic OS/OB tables --> They are hidden commonly but appear only when OB or OS is happening on top right corner or bottom right corner respectively. Values are visiable for you to judge instant trend reversals.
Key Signal
Yellow bars --> Oscillator long
Fuchsia bars --> Oscillator short
Green columns --> CurrentSafetyLevel values and Supertrend long
Red columns --> CurrentSafetyLevel values and Supertrend short
Fuchsia Zone --> Overbought region
Yellow Zone --> Oversold region
Buy-Sell Labels --> "AND" output of Supertrend and Oscillator Entry Signal: Green for "Buy" and Red for "Sell".
Bull-Bear Labels --> Oscillator divergence signal: Yellow for "Bull" and Fuchsia for "Bear".
Long Whales / Banker Pump--> fuchsia and red stick bars (Motive waves with fuchsia color; corrective waves with red color)
Short Whales / Banker Dump --> yellow and red green stick bars (Motive waves with yellow color; corrective waves with green color)
Pros and Cons
Suitable for discretionary trading and auto trading with alerts.
Intuitive and effective, the output signal is more reliable after multi-indicator resonance.
Remarks
My first L5 indicator published
Closed-source
Invite-only
Subscription
500 Tradingview Coins per Monthly Sub.
500X10 Tradingview Coins per Yearly Sub.

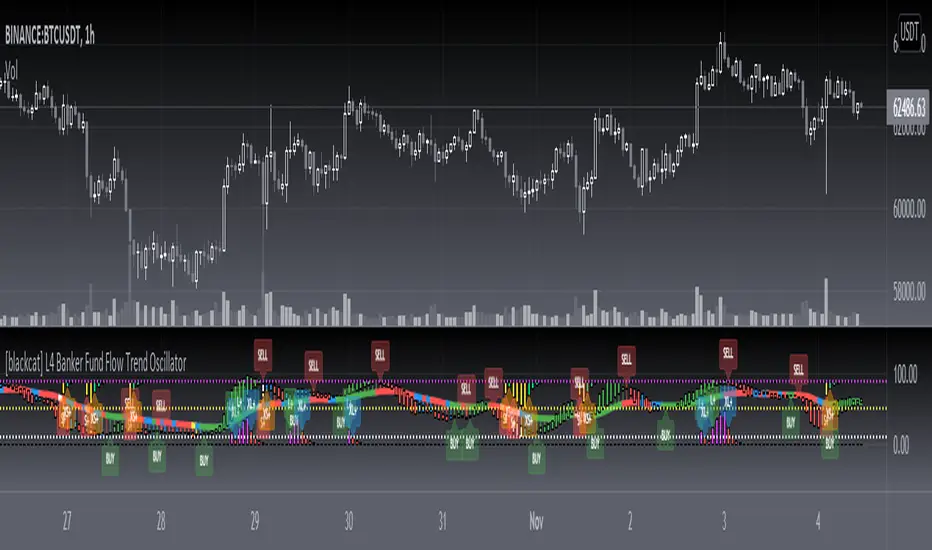
[blackcat] L4 Banker Fund Flow Trend OscillatorLevel: 4
Background
The large funds or banker fund are often referred to as Whale. Whale can have a significant impact on the price movements in various markets, especially in cryptocurrency . Therefore, how to monitor Whale trends is of great significance both in terms of fundamentals and technical aspects. I had published (blackcat1402) L3 Banker Fund Flow Trend Oscillator as open sourced version. Since this indicator is one of the most popular indicators in my collections. Many requested advanced features and improvements on accuracy. Here is the link of free version of L3 Banker Fund Flow Trend Oscillator:
Function
L4 Banker Fund Flow Trend Oscillator can give you a model of complete banker fund flow operation in cycles. Compared to L3 free and open source version, it contains more advanced algorithms to provide entries. It is comprehensive to disclose the price trend with overbought and oversold znoes. That is the reason why I list this as Level 4, which is closed source and invited-only. Each cycle of banker fund flow may have 5 steps in max as entry, increase position, decrease position, exit, and weak rebound for exit.
Inputs
Middle Trend Period --> Multiple layers of trend identification. This is used to define middle term trend, default value is 34.
Small Trend Period --> Multiple layers of trend identification. This is used to define short term trend, default value is 5.
Tiny Trend Period --> Multiple layers of trend identification. This is used to define ripple level tiny trend, default value is 3.
Trigger Period --> The slowline signal compared to above trends and it determine candle body length.
Overbought Threshold --> User defined overbought threshold, default value is 89.
Oversold Threshold --> User defined oversold threshold, default value is 11.
Long Trend Period Multiplier --> determine a larger time frame multiplifier to see larger trend moves.
Whale Scaler --> A scaling factor input to see whale dumps and pump more clearly in vision.
Key Signal
A much improved version of Banker Fund Flow Trend candles with the same color definitions:
1. banker fund entry with yellow candle;
2. banker increase position with green candle;
3. banker decrease position with white candle;
4. banker fund exit/quit with red candle;
5. banker fund weak rebound with blue candle;
Buy-Sell Labels --> Green for "Buy" and Red for "Sell".
Besides, this indicator also integrated with L5 Whale Jump Out of Ocean X function to track banker fund based pumps and dumps:
Long Whales / Banker Pump--> fuchsia and red stick bars (Motive waves with fuchsia color; corrective waves with red color)
Short Whales / Banker Dump --> yellow and red green stick bars (Motive waves with yellow color; corrective waves with green color)
Pros and Cons
Suitable for discretionary trading and auto trading with alerts.
Intuitive and effective, the output signal is more reliable after multi-indicator resonance.
Remarks
My 2nd L4 indicator published
Closed-source
Invite-only
Redeem rule: constant 500 tradingview coins per month and 500X10 tradingview coins per year.
[blackcat] L3 Banker Fund Breath OscillatorLevel: 3
Background
I have been working on studying Banker Fund's behavior and have also released some technical indicators. Among these, I liken the cyclical behavior of Banker Fund to breathing. From the perspective of technical indicators, this behavior is actually more like an oscillator of large capital flows. So, I named this indicator: (blackcat) L3 Banker Fund Breath Oscillator
Function
(blackcat) L3 Banker Fund Breath Oscillator is bounded by the zero axis. When the indicator line is above the zero axis, it indicates that there is an inflow of large funds, or it is called the inhalation of banker funds. On the contrary, when the indicator line is below the zero axis, it indicates that there is an outflow of banker funds, or it is called the exhalation of banker funds. It is worth noting that the starting point for banker funds to flow in or out does not necessarily start at the zero crossing point.
In order to more clearly express the starting point of banker fund inflows and outflows, I use gradient colors to indicate the flow of funds. Yellow means fund inflow, fuchsia means fund outflow. When the yellow color above the zero axis begins to change to fuchsia, it is the transition point where funds change from inflow to outflow. When the fuchsia below the zero axis starts to change to yellow, it is the transition point where the funds change from outflow to inflow. Amplitude indicates the intensity of fund inflows or outflows. Therefore, you can observe the divergence of banker fund flow to judge the trend of subsequent fund, or the trend of prices.
Finally, this indicator can work in a very small time frame to provide some information ahead of price movements.
Inputs
WMA Filter Length --> WMA filter length definition
Trend Step Resolution --> Define trend step value for banker fund output
Number of Sum --> Banker fund model input, which will influence banker model accuracy.
Color Breath Lookback --> The larger value, the more blur of transition point for inflow and outflow.
Key Signal
fundbreath --> Banker fund breath output with color gradient
Remarks
This is a Level 3 free but closed source indicator.
Feedbacks are appreciated.

[blackcat] L5 Whale Jump Screener 12 AlertsLinkage Authorization:
When you obtain any one of the following technical indicators authorization, the other one will automatically obtain a free authorization for the same length of time:
1. L5 Whale Jump Screener 25 NoAlerts
2. L5 Whale Jump Screener 12 Alerts
Discount Authorization:
While you are authorized for any of the following technical indicators, this indicator will only need to pay 200TVC (not per month) but you obtain the authorization length as long as your longest one among all invited-only indicators .
1. L5 Whales Jump Out of Ocean X
2. L5 Zen Master
Level: 5
Background:
L5 Whale Jump Screener 12 Alerts is a screeener which is based on principle of L5 Whales Jump Out of Ocean X, but it has its own scheme to work as a screener with alerts, which can track 12 trading pairs at the same time. With this indicator, you can track target in your list with remote alerts from TV to your mobile or emails.
At beginning, I want to incorporate this function to "L5 Whale Jump Screener 25 NoAlerts". However, I found it rather difficult to make it happen. One reason is that adding alerts will further increase computing power of it so that TV will not be functional for overloaded indicators. The only way to make a screen plus alerts happen is to reduce the number of targets allowed in the screener until TV rules are in compliance. The other reason is that I found alerts were conflicting with screener function in TV system during my testing. Because if you put many trading pairs that are highly correlated into inputs of the screener indicator. Huge amount of alerts may be produced at the same time, and TV system has its own protection scheme. If too many alerts happened at the same time, it will block and stop the alert scheme immediately. Therefore, I build this one for anyone who need alert function. But, remember, make input tikerids as NOT correlated as possible to prevent TV to shut down your alert for this indicator.
Function:
By tracking multiple targets with alerts, you will own the capability to tracking multiple markets. This ability will let you know the specific situation of the unconnected market and the trading targets in time in the rotating transaction. The alert function will remind you of the current status of multiple markets via mobile phones and emails.
Inputs:
12 tickerids for your customization
Key Signal:
Long Whales / Banker Pump--> fuchsia color area with 0% transparency
Close Long Whales / Close Banker Pump--> red color area with 0% transparency
Short Whales / Banker Dump --> yellow color area with 0% transparency
Close Short Whales / Close Banker Dump --> green color area with 0% transparency
Long Waves Start--> fuchsia color area with 50% transparency
Short Waves Start --> yellow color area with 50% transparency
No Whale or Wave Signal --> gray color rea with 50% transparency
Pros and Cons:
ONLY suitable for discretionary trading, and does NOT support automatic trading system/bots with alerts.
Intuitive and effective, the output signal is more reliable after multi-indicator resonance
For who does not alert function but track more targets, you can choose anther indicator: L5 Whale Jump Screener 25 NoAlerts.
Why 12 Targets are Supported?
From the principle of TV principle, it should be possible to track up to 40 targets at the same time. However, TV has another condition that restricts server computing resources. When the two condition work at the same time, for the whale jump algorithm, the number of targets it can track at the same time will drop from 40 to about 26~27! In addition, this indicator needs to support the display function from the daily time frame to the 1min time frame. Therefore, the requirements for computing resources have further deteriorated. In the end, the maximum tracking number I obtained by compromise is 25 to ensure that this indicator can support 1min or second level normal display without report an error. Based on above fact, adding alerts will further increase computing power needed for this indicator. To prevent TV shutdown this indicator w/ alerts, only 12 tickerids are supported based on this algorithm. Also, due to quite different user scenarios between these two screeners, two versions are published for different group of traders with a linkage authorization schmeme.
Remarks:
My fourth L5 indicator published
Closed-source
Invite-only
Redeem Fee Life Lock Guarantee
Although I take the efforts to inform the script requesters that the best way to promote trading skills is to learn from the open source scripts I released by themself and to improve their PNIE script programming skills, there are still many people asking how to obtain or pay to use BLACKCAT L4/L5 private scripts. In fact, I do not encourage people to use Tradingview Coins ( TVC ) / Cryptocurrency to redeem the right to use BLACKCAT L4/L5 scripts. However, redeeming private script usage rights through TV Coins/ Cryptocurrency may be an effective way to force more people to learn PINE script programming seriously. And then I can concentrate on answering more valuable community questions instead of being overwhelmed by L4/L5 scripting permission reqeusts.
I would like to announce a ‘Redeem Fee Lock Guarantee’ program to further simplify the L4/L5 indicator/strategy utility offering and distinguish itself from the competition. ‘Redeem Fee lock guarantee’ is one of the major initiatives by BLACKCAT as a part of overall value packaging designed to guard BLACKCAT’s followers’ against cost-overruns and operational risks usually borne by them when it comes to PINE script innovation ecosystem. The TVCs redeemed for L4/L5 a follower signs up for with BLACKCAT is their guaranteed lifetime locked in TVC Quantity/ cryptocurrency, with no special conditions, exclusions and fine print whatsoever. Based on this scheme, I can constantly refine, expand, upgrade and improve PINE script publishing to ensure the very best experiences for my followers. The 'Redeem Fee Lock Guarantee' is a step in the direction of rewarding the valuable followers. NOTE: Every L4/L5 script redeeming service is ONLY limited to TVC or Cryptocurrency ("Win$ & Donate w/ This" Addresses displayed on script page) redeeming which the 1st signed up TVC Qty/ equivalent cryptocurrency is the lifetime offered TVC Qty/ equivalent crypto.
How to subscrible this indicator?
The script subscription period only has two options of one month or one year, and its price is floating. The latest price of the script subscription is proportional to the number of likes/agrees this script has already received. Therefore, the price of subscribing to this script shows an increasing trend, and the earliest subscribers can enjoy the price of lifetime lock to this script. As the number of likes / agrees of this script increases, the subscription fee for one month and one year will also increase linearly. Whatever, the first subscription price of the use will be locked for life.
Monthly subscription and annual subscription can be done either by tradingview coins ( TVC ) or by converting into equivalent cryptocurrency at the exchange rate (1TVC=0.01USD) for redeem.
TVC payment needs to pay TVC directly in the comments under this script. Every time I authorize a new user, I will update the latest number of subscribed users and latest price for next subscription under the script comment. If there are any conflicting scenario happened to the rules and my update. My updated price based on the rule will be the final price for next subscription. The following subscribers need to pay the corresponding amount of TVC or cryptocurrency in accordance with the latest number of users and price announced by me in accordance with the rules published.
TVC redemption is the method I strongly recommend, and I hope you can complete the redemption in the comment area of this script. This is like a blockchain structure, each comment is a block, each subscription is a chain, which is conducive to open and transparent publicity and traceability to avoid unnecessary disputes.
Monthly Subscription Charges
500TVC <50 Agrees (A)
50A<850TVC<100A
100A<1000TVC<150A
150A<1350TVC<200A
200A<1500TVC<250A
250A<1850TVC<300A
300A<2000TVC<350A
350A<2350TVC<400A
400A<2500TVC<450A
450A<2850TVC<500A
500A<3000TVC<550A
550A<3350TVC<600A
600A<3500TVC<650A
650A<3850TVC<700A
700A<4000TVC<750A
750A<4350TVC<800A
800A<4500TVC<850A
850A<4850TVC<900A
900A<5000TVC<950A
950A<5350TVC<1000A
1000A<5500TVC<1050A
And so on...
Annual Subscription Charges
5000TVC <50 Agrees (A)
50A<8500TVC<100A
100A<10000TVC<150A
150A<13500TVC<200A
200A<15000TVC<250A
250A<18500TVC<300A
300A<20000TVC<300A
350A<23500TVC<400A
400A<25000TVC<450A
500A<28500TVC<550A
500A<30000TVC<550A
550A<33500TVC<600A
600A<35000TVC<650A
650A<38500TVC<700A
700A<40000TVC<750A
750A<43500TVC<800A
800A<45000TVC<850A
850A<48500TVC<900A
900A<50000TVC<950A
950A<53500TVC<1000A
1000A<55000TVC<1050A
And so on...

[blackcat] L5 Whale Jump Screener 25 NoAlertsLinkage Authorization:
When you obtain any one of the following technical indicators authorization, the other one will automatically obtain a free authorization for the same length of time:
1. L5 Whale Jump Screener 25 NoAlerts
2. L5 Whale Jump Screener 12 Alerts
Discount Authorization:
While you are authorized for any of the following technical indicators, this indicator will only need to pay 200TVC (not per month) but you obtain the authorization length as long as your longest one among all invited-only indicators .
1. L5 Whales Jump Out of Ocean X
2. L5 Zen Master
Level: 5
Background:
L5 Whale Jump Screener 25 NoAlerts is a screeener which is based on principle of L5 Whales Jump Out of Ocean X, but it has its own scheme to work as a screener, which can track 25 trading pairs at the same time. With this indicator, you will see an overall market state if your inputs are major instruments in a specific market via a colorful heat map.
Function:
By tracking multiple targets in the same section can help you increase confidence level of trading because most targets move to the same direction witin the same section. It provides a macro picture to support you know the background of your trading. Also, you can choose your trading target by comparing with others in the same section to make a better decision.
Inputs:
25 tickerids for your customization
Key Signal:
Long Whales / Banker Pump--> fuchsia color area with 0% transparency
Close Long Whales / Close Banker Pump--> red color area with 0% transparency
Short Whales / Banker Dump --> yellow color area with 0% transparency
Close Short Whales / Close Banker Dump --> green color area with 0% transparency
Long Waves Start--> fuchsia color area with 50% transparency
Short Waves Start --> yellow color area with 50% transparency
No Whale or Wave Signal --> gray color rea with 50% transparency
Pros and Cons:
ONLY suitable for discretionary trading, and does NOT support automatic trading system/bots with alerts.
Intuitive and effective, the output signal is more reliable after multi-indicator resonance
For who need alert function, you can choose anther indicator: L5 Whale Jump Screener 12 Alerts.
Why 25 Targets are Supported?
From the principle of TV principle, it should be possible to track up to 40 targets at the same time. However, TV has another condition that restricts server computing resources. When the two condition work at the same time, for the whale jump algorithm, the number of targets it can track at the same time will drop from 40 to about 26~27! In addition, this indicator needs to support the display function from the daily time frame to the 1min time frame. Therefore, the requirements for computing resources have further deteriorated. In the end, the maximum tracking number I obtained by compromise is 25 to ensure that this indicator can support 1min or second level normal display without report an error.
Remarks:
My third L5 indicator published
Closed-source
Invite-only
Redeem Fee Life Lock Guarantee
Although I take the efforts to inform the script requesters that the best way to promote trading skills is to learn from the open source scripts I released by themself and to improve their PNIE script programming skills, there are still many people asking how to obtain or pay to use BLACKCAT L4/L5 private scripts. In fact, I do not encourage people to use Tradingview Coins ( TVC ) / Cryptocurrency to redeem the right to use BLACKCAT L4/L5 scripts. However, redeeming private script usage rights through TV Coins/ Cryptocurrency may be an effective way to force more people to learn PINE script programming seriously. And then I can concentrate on answering more valuable community questions instead of being overwhelmed by L4/L5 scripting permission reqeusts.
I would like to announce a ‘Redeem Fee Lock Guarantee’ program to further simplify the L4/L5 indicator/strategy utility offering and distinguish itself from the competition. ‘Redeem Fee lock guarantee’ is one of the major initiatives by BLACKCAT as a part of overall value packaging designed to guard BLACKCAT’s followers’ against cost-overruns and operational risks usually borne by them when it comes to PINE script innovation ecosystem. The TVCs redeemed for L4/L5 a follower signs up for with BLACKCAT is their guaranteed lifetime locked in TVC Quantity/ cryptocurrency, with no special conditions, exclusions and fine print whatsoever. Based on this scheme, I can constantly refine, expand, upgrade and improve PINE script publishing to ensure the very best experiences for my followers. The 'Redeem Fee Lock Guarantee' is a step in the direction of rewarding the valuable followers. NOTE: Every L4/L5 script redeeming service is ONLY limited to TVC or Cryptocurrency ("Win$ & Donate w/ This" Addresses displayed on script page) redeeming which the 1st signed up TVC Qty/ equivalent cryptocurrency is the lifetime offered TVC Qty/ equivalent crypto.
How to subscrible this indicator?
The script subscription period only has two options of one month or one year, and its price is floating. The latest price of the script subscription is proportional to the number of likes/agrees this script has already received. Therefore, the price of subscribing to this script shows an increasing trend, and the earliest subscribers can enjoy the price of lifetime lock to this script. As the number of likes / agrees of this script increases, the subscription fee for one month and one year will also increase linearly. Whatever, the first subscription price of the use will be locked for life.
Monthly subscription and annual subscription can be done either by tradingview coins ( TVC ) or by converting into equivalent cryptocurrency at the exchange rate (1TVC=0.01USD) for redeem.
TVC payment needs to pay TVC directly in the comments under this script. Every time I authorize a new user, I will update the latest number of subscribed users and latest price for next subscription under the script comment. If there are any conflicting scenario happened to the rules and my update. My updated price based on the rule will be the final price for next subscription. The following subscribers need to pay the corresponding amount of TVC or cryptocurrency in accordance with the latest number of users and price announced by me in accordance with the rules published.
TVC redemption is the method I strongly recommend, and I hope you can complete the redemption in the comment area of this script. This is like a blockchain structure, each comment is a block, each subscription is a chain, which is conducive to open and transparent publicity and traceability to avoid unnecessary disputes.
Monthly Subscription Charges
500TVC <50 Agrees (A)
50A<850TVC<100A
100A<1000TVC<150A
150A<1350TVC<200A
200A<1500TVC<250A
250A<1850TVC<300A
300A<2000TVC<350A
350A<2350TVC<400A
400A<2500TVC<450A
450A<2850TVC<500A
500A<3000TVC<550A
550A<3350TVC<600A
600A<3500TVC<650A
650A<3850TVC<700A
700A<4000TVC<750A
750A<4350TVC<800A
800A<4500TVC<850A
850A<4850TVC<900A
900A<5000TVC<950A
950A<5350TVC<1000A
1000A<5500TVC<1050A
And so on...
Annual Subscription Charges
5000TVC <50 Agrees (A)
50A<8500TVC<100A
100A<10000TVC<150A
150A<13500TVC<200A
200A<15000TVC<250A
250A<18500TVC<300A
300A<20000TVC<300A
350A<23500TVC<400A
400A<25000TVC<450A
500A<28500TVC<550A
500A<30000TVC<550A
550A<33500TVC<600A
600A<35000TVC<650A
650A<38500TVC<700A
700A<40000TVC<750A
750A<43500TVC<800A
800A<45000TVC<850A
850A<48500TVC<900A
900A<50000TVC<950A
950A<53500TVC<1000A
1000A<55000TVC<1050A
And so on...

[blackcat] L5 Whales Jump Out of Ocean XLevel: 5
Background
I have been working on developing indicators on how to track the banker funds or whales. In my open source indicators published, you can search for the keywords "Banker" or "Whale" to find and use these indicators. After three years of development and hard work, I have perfectly combined the banker fund/whale mathematical model and the unique Fibonacci space-time indicators. This is named as "L5 Whales Jump Out of Ocean X" indicator that I will introduce today.
Function
This indicator introduces three independent judgment standards. They are whales & waves, Fibonacci time windows and dynamic Fibonacci retracement arrows. Whales and waves are banker fund/ whale behavior modeling based on my unique moving average technology. Fibonacci time and space indicators are a unique improvement I made to traditional indicators of the same kind to make them more powerful.
This indicator is basically applicable to all markets, but requires traders to choose the most suitable trading pair to operate. This indicator is used for multiple periods. Because the smaller the period, the more unstable the data, the larger the period, the more stable the Fibonacci space-time indicator. I use this indicator for the operation of cryptocurrency, commodities, forex, local stocks and ETFs. When this indicator is combined with the candle patterns of Japanese candlesticks, it will often produce higher quality signals, so I suggest that people who use this indicator should have the basic knowledge of Japanese candlesticks in order to better use this indicator.
Key Signal
Long Whales / Banker Pump--> fuchsia and red stick bars (Motive waves with fuchsia color; corrective waves with red color)
Short Whales / Banker Dump --> yellow and red green stick bars (Motive waves with yellow color; corrective waves with green color)
Long Waves --> fuchsia and red areas (Motive waves with fuchsia color; corrective waves with red color)
Short Waves --> yellow and red green areas (Motive waves with yellow color; corrective waves with green color)
Fibonacci Top Time Window --> red background color
Fibonacci Bottom Time Window --> green background color
Dynamic Fibonacci Retracement Support Arrows --> green arrows with "SUP" text; the brighter color, the stronger support.
Dynamic Fibonacci Retracement Resistance Arrows --> red arrows with "RES" text; the brighter color, the stronger resistance.
Ready for Support Cross --> green crosses with "*SUP" text on zero axis.
Ready for Resistance Cross --> red crosses with "*RES" text on zero axis.
Pros and Cons
ONLY suitable for discretionary trading, and does NOT support automatic trading system/bots with alerts.
Intuitive and effective, the output signal is more reliable after multi-indicator resonance
Remarks
My first L5 indicator published
Closed-source
Invite-only
Redeem Fee Life Lock Guarantee
Although I take the efforts to inform the script requesters that the best way to promote trading skills is to learn from the open source scripts I released by themself and to improve their PNIE script programming skills, there are still many people asking how to obtain or pay to use BLACKCAT L4/L5 private scripts. In fact, I do not encourage people to use Tradingview Coins (TVC) / Cryptocurrency to redeem the right to use BLACKCAT L4/L5 scripts. However, redeeming private script usage rights through TV Coins/ Cryptocurrency may be an effective way to force more people to learn PINE script programming seriously. And then I can concentrate on answering more valuable community questions instead of being overwhelmed by L4/L5 scripting permission reqeusts.
I would like to announce a ‘Redeem Fee Lock Guarantee’ program to further simplify the L4/L5 indicator/strategy utility offering and distinguish itself from the competition. ‘Redeem Fee lock guarantee’ is one of the major initiatives by BLACKCAT as a part of overall value packaging designed to guard BLACKCAT’s followers’ against cost-overruns and operational risks usually borne by them when it comes to PINE script innovation ecosystem. The TVCs redeemed for L4/L5 a follower signs up for with BLACKCAT is their guaranteed lifetime locked in TVC Quantity/ cryptocurrency, with no special conditions, exclusions and fine print whatsoever. Based on this scheme, I can constantly refine, expand, upgrade and improve PINE script publishing to ensure the very best experiences for my followers. The 'Redeem Fee Lock Guarantee' is a step in the direction of rewarding the valuable followers. NOTE: Every L4/L5 script redeeming service is ONLY limited to TVC or Cryptocurrency ("Win$ & Donate w/ This" Addresses displayed on script page) redeeming which the 1st signed up TVC Qty/ equivalent cryptocurrency is the lifetime offered TVC Qty/ equivalent crypto.
How to subscrible this indicator?
The script subscription period only has two options of one month or one year, and its price is floating. The latest price of the script subscription is proportional to the number of likes/agrees this script has already received. Therefore, the price of subscribing to this script shows an increasing trend, and the earliest subscribers can enjoy the price of lifetime lock to this script. As the number of likes / agrees of this script increases, the subscription fee for one month and one year will also increase linearly. Whatever, the first subscription price of the use will be locked for life.
Monthly subscription and annual subscription can be done either by tradingview coins (TVC) or by converting into equivalent cryptocurrency at the exchange rate (1TVC=0.01USD) for redeem.
TVC payment needs to pay TVC directly in the comments under this script. Every time I authorize a new user, I will update the latest number of subscribed users and latest price for next subscription under the script comment. If there are any conflicting scenario happened to the rules and my update. My updated price based on the rule will be the final price for next subscription. The following subscribers need to pay the corresponding amount of TVC or cryptocurrency in accordance with the latest number of users and price announced by me in accordance with the rules published.
TVC redemption is the method I strongly recommend, and I hope you can complete the redemption in the comment area of this script. This is like a blockchain structure, each comment is a block, each subscription is a chain, which is conducive to open and transparent publicity and traceability to avoid unnecessary disputes.
Monthly Subscription Charges
500TVC <50 Agrees (A)
50A<850TVC<100A
100A<1000TVC<150A
150A<1350TVC<200A
200A<1500TVC<250A
250A<1850TVC<300A
300A<2000TVC<350A
350A<2350TVC<400A
400A<2500TVC<450A
450A<2850TVC<500A
500A<3000TVC<550A
550A<3350TVC<600A
600A<3500TVC<650A
650A<3850TVC<700A
700A<4000TVC<750A
750A<4350TVC<800A
800A<4500TVC<850A
850A<4850TVC<900A
900A<5000TVC<950A
950A<5350TVC<1000A
1000A<5500TVC<1050A
And so on...
Annual Subscription Charges
5000TVC <50 Agrees (A)
50A<8500TVC<100A
100A<10000TVC<150A
150A<13500TVC<200A
200A<15000TVC<250A
250A<18500TVC<300A
300A<20000TVC<300A
350A<23500TVC<400A
400A<25000TVC<450A
500A<28500TVC<550A
500A<30000TVC<550A
550A<33500TVC<600A
600A<35000TVC<650A
650A<38500TVC<700A
700A<40000TVC<750A
750A<43500TVC<800A
800A<45000TVC<850A
850A<48500TVC<900A
900A<50000TVC<950A
950A<53500TVC<1000A
1000A<55000TVC<1050A
And so on...

SN Intraday BundleThe intraday bundle is a combination of this item:
1 ) Buy and Sell trailing based on the Average True Range (ATR) with an alert
2 ) 3 customizable moving average line
Blue: MA 1 (5)
Red: MA 2 (18)
Green: MA 3 (13)
3 ) Trend line indicator
Green: when CCI is positive
Orange: when CCI is negative
4 ) Trend card background-color based on EMA trend direction
Green: Uptrend
Red: Downtrend
Yellow: Neutral
5 ) Bursa Malaysia Limit Up and Limit Down indicator
Green Dotted Line: + 30% from last day closed priced
Red Dotted Line: - 30% from last day closed priced
6 ) Daily, weekly, and monthly VWAP line
Grey: Daily VWAP
Blue: Weekly VWAP
Silver: Monthly VWAP
7 ) Above and below daily VWAP indicator with alert
Blue Arrow Up: Price above daily VWAP
Blue Arrow Down: Price below daily VWAP
Trade with caution ✌️

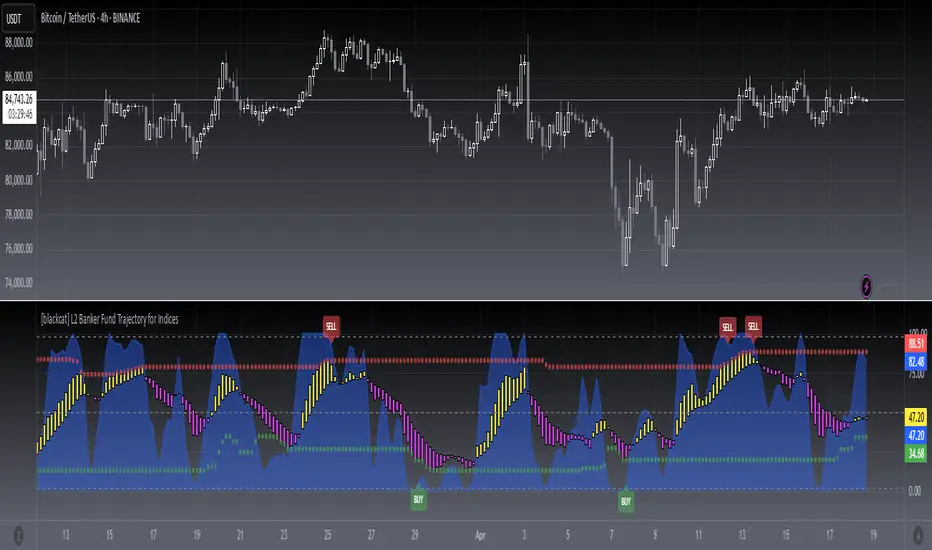
[blackcat] L2 Banker Fund Trajectory for IndiceLevel: 2
Background
This script creates a model of banker fund (whale) with yellow and fuchsia candles. I use blue waves (b5) to detect oversold and overbought, which is more sensistive than candles.
Function
Use composite banker fund trajectory oversold and overbought for long and short entries, which works better for indice trading pairs
Key Signal
j --> banker fund fast line
a2 --> banker funder slow line
support --> dynamic support levels
resistance --> dynamic resistance levels
long --> oversold long entry
short --> overbought short entry
Pros and Cons
This script is suitable for indice trading pairs. It will not work so well for other trading pairs due to overbought and oversold is not as stable as an index trading pair
Remarks
You feedbacks on index trading pairs are appreciated.
Readme
In real life, I am a prolific inventor. I have successfully applied for more than 60 international and regional patents in the past 12 years. But in the past two years or so, I have tried to transfer my creativity to the development of trading strategies. Tradingview is the ideal platform for me. I am selecting and contributing some of the hundreds of scripts to publish in Tradingview community. Welcome everyone to interact with me to discuss these interesting pine scripts.
The scripts posted are categorized into 5 levels according to my efforts or manhours put into these works.
Level 1 : interesting script snippets or distinctive improvement from classic indicators or strategy. Level 1 scripts can usually appear in more complex indicators as a function module or element.
Level 2 : composite indicator/strategy. By selecting or combining several independent or dependent functions or sub indicators in proper way, the composite script exhibits a resonance phenomenon which can filter out noise or fake trading signal to enhance trading confidence level.
Level 3 : comprehensive indicator/strategy. They are simple trading systems based on my strategies. They are commonly containing several or all of entry signal, close signal, stop loss, take profit, re-entry, risk management, and position sizing techniques. Even some interesting fundamental and mass psychological aspects are incorporated.
Level 4 : script snippets or functions that do not disclose source code. Interesting element that can reveal market laws and work as raw material for indicators and strategies. If you find Level 1~2 scripts are helpful, Level 4 is a private version that took me far more efforts to develop.
Level 5 : indicator/strategy that do not disclose source code. private version of Level 3 script with my accumulated script processing skills or a large number of custom functions. I had a private function library built in past two years. Level 5 scripts use many of them to achieve private trading strategy.