AE - ATR Exhaustion ChannelAE - ATR Exhaustion Channel
📈 Overview
Identify Exhaustion Zones & Trend Breakouts with ATR Precision!
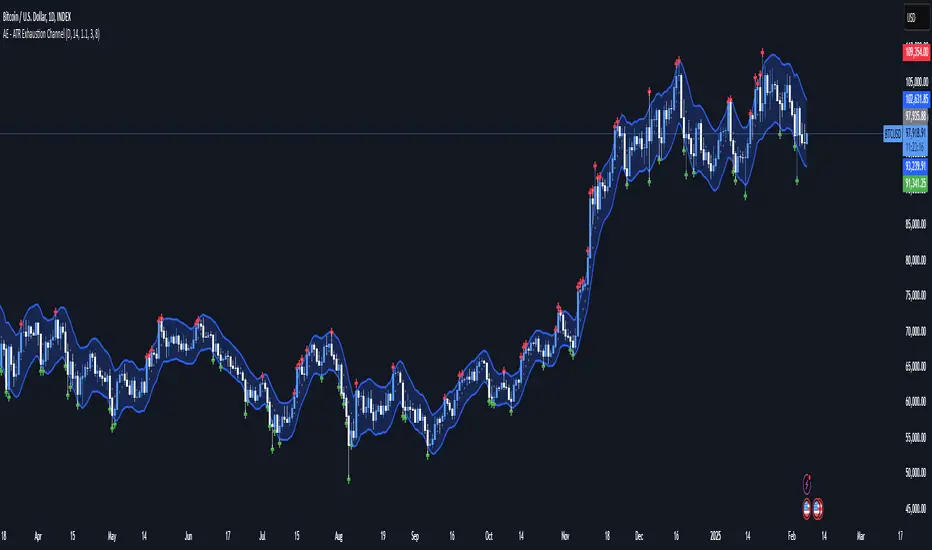
The AE - ATR Exhaustion Channel is a powerful volatility-based trading tool that combines an averaged SMA with ATR bands to dynamically highlight potential trend exhaustion zones. It provides real-time breakout detection by marking when price moves beyond key volatility bands, helping traders spot overextensions and reversals with ease.
🔑 Key Features
✔️ ATR-SMA Hybrid Channel: Uses an averaged SMA as the core trend filter while incorporating adaptive ATR-based bands for precise volatility tracking.
✔️ Dynamic Exhaustion Markers: Marks red crosses when price exceeds the upper band and green crosses when price drops below the lower band.
✔️ Customizable ATR Sensitivity: Adjust the ATR multiplier and length settings to fine-tune band sensitivity based on market conditions.
✔️ Clear Channel Visualization: A gray SMA midpoint and a blue-filled ATR band zone make it easy to track market structure.
📚 How It Works
1️⃣ Averaged SMA Calculation: The script calculates an averaged SMA over a user-defined range (min/max period). This smooths out short-term fluctuations while preserving trend direction.
2️⃣ ATR Band Construction: The ATR value (adjusted by a multiplier) is added to/subtracted from the SMA to form dynamic upper and lower volatility bands.
3️⃣ Exhaustion Detection:
If high > upper ATR band, a red cross is plotted (potential overextension).
If low < lower ATR band, a green cross is plotted (potential reversal zone).
4️⃣ Filled ATR Channel: The area between the upper and lower bands is shaded blue, providing a visual trading range.
🎨 Customization & Settings
⚙️ ATR Length – Adjusts the ATR calculation period (default: 14).
⚙️ ATR Multiplier – Scales the ATR bands for tighter or wider volatility tracking (default: 0.8, adjustable in 0.1 steps).
⚙️ SMA Range (Min/Max Length) – Defines the period range for calculating the averaged SMA (default: 5-20).
⚙️ Rolling Lookback Length – Controls how far back the high/low comparison is calculated (default: 50 bars).
🚀 Practical Usage
📌 Spotting Exhaustion Zones – Look for red/green markers appearing outside the ATR bands, signaling potential trend exhaustion and possible reversal opportunities.
📌 Breakout Confirmation – Price consistently breaching the upper band with momentum could indicate continuation, while repeated touches without strong closes may hint at reversal zones.
📌 Trend Reversal Signals – Watch for green markers below the lower band in uptrends (buy signals) and red markers above the upper band in downtrends (sell signals).
🔔 Alerts & Notifications
📢 Set Alerts for Exhaustion Signals!
Traders can configure alerts to trigger when price breaches the ATR bands, allowing for instant notifications when volatility-based exhaustion is detected.
📊 Example Scenarios
✔ Trend Exhaustion in Overextended Moves – A series of red crosses near resistance may indicate a short opportunity.
✔ Trend Exhaustion in Overextended Moves – A series of red crosses near resistance may indicate an opportunity to open a short trade.
✔ Volatility Compression Breakouts – If price consolidates within the ATR bands and suddenly breaks out, it could signify a momentum shift.
✔ Reversal Catching in Trending Markets – Spot potential trend reversals by looking for green markers below the ATR bands in bullish markets.
🌟 Why Choose AE - ATR Exhaustion Channel?
Trade with Confidence. Spot Volatility. Catch Breakouts.
The AE - ATR Exhaustion Channel is an essential tool for traders looking to identify trend exhaustion, detect breakouts, and manage volatility effectively. Whether you're trading stocks, crypto, or forex, this ATR-SMA hybrid system provides clear visual cues to help you stay ahead of market moves.
✅ Customizable to Fit Any Market
✅ Combines Volatility & Trend Analysis
✅ Easy-to-Use with Instant Breakout Detection
Pine Script® göstergesi