LSMA Z-Score [BackQuant]LSMA Z-Score
Main Features and Use in the Trading Strategy
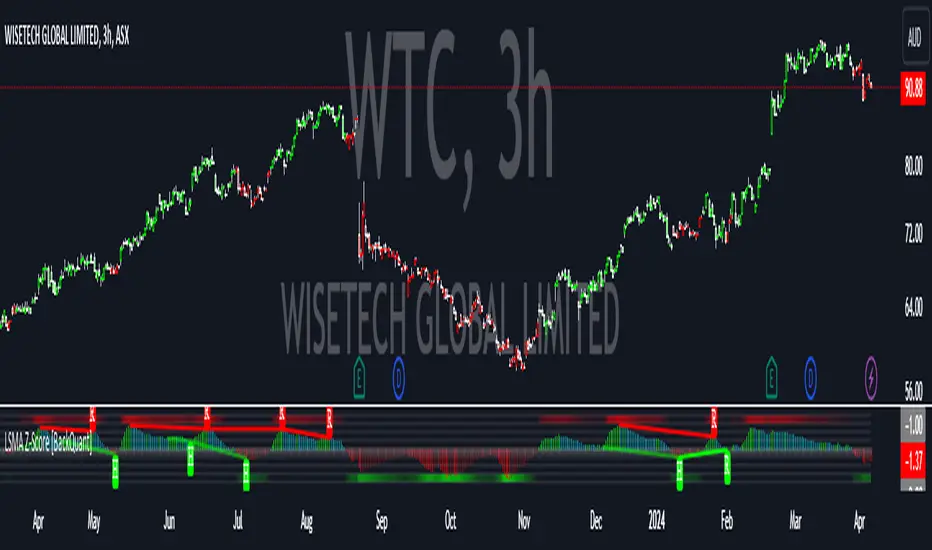
- The indicator normalizes the LSMA into a detrended Z-Score, creating an oscillator with standard deviation levels to indicate trend strength.
- Adaptive coloring highlights the rate of change and potential reversals, with different colors for positive and negative changes above and below the midline.
- Extreme levels with adaptive coloring indicate the probability of a reversion, providing strategic entry or exit points.
- Alert conditions for crossing the midline or significant shifts in trend direction enhance its utility within a trading strategy.
1. What is an LSMA?
The Least Squares Moving Average (LSMA) is a technical indicator that smoothens price data to help identify trends. It uses the least squares regression method to fit a straight line through the selected price points over a specified period. This approach minimizes the sum of the squares of the distances between the line and the price points, providing a more statistically grounded moving average that can adapt more smoothly to price changes.
2. What is a Z-Score?
A Z-Score is a statistical measurement that describes a value's relationship to the mean of a group of values, measured in terms of standard deviations from the mean. If a Z-Score is 0, it indicates that the data point's score is identical to the mean score. A Z-Score helps in understanding if a data point is typical for a given data set or if it is atypical. In finance, a Z-Score is often used to measure how far a piece of data is from the average of a set, which can be helpful in identifying outliers or unusual data points.
3. Why Turning LSMA into a Z-Score is Innovative and Its Benefits
Converting LSMA into a Z-Score is innovative because it combines the trend identification capabilities of the LSMA with the statistical significance testing of Z-Scores. This transformation normalizes the LSMA, creating a detrended oscillator that oscillates around a mean (zero line), with standard deviation levels to show trend strength. This method offers several benefits:
Enhanced Trend Detection:
- By normalizing the LSMA, traders can more easily identify when the price is deviating significantly from its trend, which can signal potential trading opportunities.
Standardization:
- The Z-Score transformation allows for comparisons across different assets or time frames, as the score is standardized.
Objective Measurement of Trend Strength:
- The use of standard deviation levels provides an objective measure of trend strength and volatility.
4. How It Can Be Used in the Context of a Trading System
This indicator can serve as a versatile tool within a trading system for a range of things:
Trend Confirmation:
- A positive Z-Score can confirm an uptrend, while a negative Z-Score can confirm a downtrend, providing traders with signals to enter or exit trades.
Oversold/Overbought Conditions:
- Extreme Z-Score levels can indicate overbought or oversold conditions, suggesting potential reversals or pullbacks.
Volatility Assessment:
- The standard deviation levels can help traders assess market volatility, with wider bands indicating higher volatility.
5. How It Can Be Used for Trend Following
For trend following strategies, this indicator can be particularly useful:
Trend Strength Indicator:
- By monitoring the Z-Score's distance from zero, traders can gauge the strength of the current trend, with larger absolute values indicating stronger trends.
Directional Bias:
- Positive Z-Scores can be used to establish a bullish bias, while negative Z-Scores can establish a bearish bias, guiding trend following entries and exits.
Color-Coding for Trend Changes :
- The adaptive coloring of the indicator based on the rate of change and extreme levels provides visual cues for potential trend reversals or continuations.
Thus following all of the key points here are some sample backtests on the 1D Chart
Disclaimer: Backtests are based off past results, and are not indicative of the future.
This is using the Midline Crossover:
INDEX:BTCUSD
INDEX:ETHUSD
BINANCE:SOLUSD
Backtested
DEMA Adjusted Average True Range [BackQuant]The use of the Double Exponential Moving Average (DEMA) within your Adjusted Average True Range (ATR) calculation serves as a cornerstone for enhancing the indicator's responsiveness to market changes. To delve deeper into why DEMA is employed specifically in the context of your ATR calculation, let's explore the inherent qualities of DEMA and its impact on the ATR's performance.
DEMA and Its Advantages
As previously mentioned, DEMA was designed to offer a more responsive alternative to the traditional Exponential Moving Average (EMA). By giving more weight to recent price data, DEMA reduces the lag typically associated with moving averages. This reduction in lag is especially beneficial for short-term traders looking to capitalize on trend reversals and other market movements as swiftly as possible.
The calculation of DEMA involves the following steps:
Calculate EMA1: This is the Exponential Moving Average of the price.
Calculate EMA2: This is the Exponential Moving Average of EMA1, thus it is a smoothing of a smoothing, leading to a greater lag.
Formulate DEMA: The formula
EMA1 = EMA of price
EMA2 = EMA of EMA1
DEMA = (2 x EMA1) - EMA2
effectively doubles the weighting of the most recent data points by subtracting the lagged, double-smoothed EMA2 from twice the single-smoothed EMA1.
This process enhances the moving average's sensitivity to recent price movements, allowing the DEMA to adhere more closely to the price bars than either EMA1 or EMA2 alone.
Integration with ATR
In the context of your ATR calculation, the integration of DEMA plays a crucial role in defining the indicator's core functionality. Here's a detailed explanation of how DEMA affects the ATR calculation:
Initial Determination of DEMA : By applying the DEMA formula to the chosen source data (which can be adjusted to use Heikin Ashi candle close prices for an even smoother analysis), you set a foundation for a more reactive trend-following mechanism within the ATR framework.
Application to ATR Bands : The calculated DEMA serves as the central line from which the ATR bands are derived. The ATR value, multiplied by a user-defined factor, is added to and subtracted from the DEMA to form the upper and lower bands, respectively. This dynamic adjustment not only reflects the volatility based on the ATR but does so in a way that is closely aligned with the most recent price action, thanks to the utilization of DEMA.
Enhanced Signal Quality : The responsiveness of DEMA ensures that the ATR bands adjust more promptly to changes in market conditions. This quality is vital for traders who rely on the ATR bands to identify potential entry and exit points, trend reversals, or to assess market volatility.
By employing DEMA as the core component in calculating the Adjusted Average True Range, your indicator leverages DEMA's reduced lag and increased weight on recent data to provide a more timely and accurate measure of market volatility. This innovative approach enhances the utility of the ATR by making it not only a tool for assessing volatility but also a more reactive indicator for trend analysis and trading signal generation.
The main concept of combining these is to reduce lag, get a more robust signal and still capture clear trends over medium time horizons.
For me, this is best used in confluence with other indicators, it can be made faster in order to get fasters response time, or slower. This is all depending on the needs of you as a trader.
User Inputs:
The script offers several user-configurable inputs, such as the period lengths for DEMA and ATR calculations, the multiplication factor for the ATR, and options to use Heikin Ashi candles or standard price data. Additionally, it allows for the toggling of visual features, like the plotting of the DEMA ATR and its moving average, and the application of color-coded trends on price bars.
Additional Features:
Moving Average Confluence: Traders can opt to display a moving average of the DEMA ATR, choosing from various types (e.g., SMA, EMA, HMA). This feature provides a layer of confluence, aiding in the identification of trend direction and strength.
Trend Identification :
The script employs logical conditions to ascertain the trend direction based on the movement of the DEMA ATR. It assigns colors to represent bullish or bearish trends, which are reflected in the plotted lines and the coloring of price bars.
Alerts :
Customizable alert conditions for trend reversals enhance the utility of the indicator for active trading, notifying users of significant changes in trend direction.
1D Backtests
We include these backtests as a general proxy for how they work.
Please do your own calibrating to suit it to your own needs and backtest.
Past results don't = future results but they can help you understand how it functions.
INDEX:BTCUSD
INDEX:ETHUSD
BINANCE:SOLUSD

RSI and MA with Trailing Stop Loss and Take Profit (by Coinrule)The relative strength index is a momentum indicator used in technical analysis. It measures the speed and magnitude of a coin's recent price changes to evaluate overvalued or undervalued conditions in the price of that coin. The RSI is displayed as an oscillator (a line graph essentially) on a scale of zero to 100. When the RSI reaches oversold levels, it can provide a signal to go long. When the RSI reaches overbought levels, it can mark a good exit point or alternatively, an entry for a short position. Traditionally, an RSI reading of 70 or above indicates an overbought situation. A reading of 30 or below indicates an oversold condition.
A moving average (MA) calculates the average of a selected range of prices, usually closing prices, by the number of periods in that range. Essentially it is used to help smooth out price data by creating a constantly updated average price.
The Strategy enters and closes trades when the following conditions are met:
Entry Conditions:
RSI is greater than 50
MA9 is greater than MA50
RSI increases by 5
Exit Conditions:
Price increases by 1% trailing
Price decreases by 2% trailing
This strategy is back-tested from 1 January 2022 to simulate how the strategy would work in a bear market. The strategy provides good returns.
The strategy assumes each order is using 30% of the available coins to make the results more realistic and to simulate you only ran this strategy on 30% of your holdings. A trading fee of 0.1% is also taken into account and is aligned to the base fee applied on Binance.

PIVOT STRATEGY [INDIAN MARKET TIMING]
A Back-tested Profitable Strategy for Free!!
A PIVOT INTRADAY STRATEGY for 5 minute Time-Frame , that also explains the time condition for Indian Markets
The Timing can be changed to fit other markets, scroll down to "TIME CONDITION" to know more.
The commission is also included in the strategy .
The basic idea is when ,
1) Price crosses above ema1 ,indicated by pivot highest line in green color .
2) Price crosses below ema1 ,indicated by pivot lowest line in red color .
3) Candle high crosses above pivot highest , is the Long condition .
4) Candle low crosses below pivot lowest , is the Short condition .
5) Maximum Risk per trade for the intraday trade can be changed .
6) Default_qty_size is set to 60 contracts , which can be changed under settings → properties → order size .
7) ATR is used for trailing after entry, as mentioned in the inputs below.
// ═════════════════════════//
// ————————> INPUTS <————————— //
// ═════════════════════════//
Leftbars —————> Length of pivot highs and lows
Rightbars —————> Length of pivot highs and lows
Price Cross Ema —————> Added condition
ATR LONG —————> ATR stoploss trail for Long positions
ATR SHORT —————> ATR stoploss trail for Short positions
RISK —————> Maximum Risk per trade for the day
The strategy was back-tested on RELIANCE ,the input values and the results are mentioned under "BACKTEST RESULTS" below .
// ═════════════════════════ //
// ————————> PROPERTIES<——————— //
// ═════════════════════════ //
Default_qty_size ————> 60 contracts , which can be changed under settings
↓
properties
↓
order size
// ═══════════════════════════════//
// ————————> TIME CONDITION <————————— //
// ═══════════════════════════════//
The time can be changed in the script , Add it → click on ' { } ' → Pine editor→ making it a copy [right top corner} → Edit the line 25 .
The Indian Markets open at 9:15am and closes at 3:30pm .
The 'time_cond' specifies the time at which Entries should happen .
"Close All" function closes all the trades at 3pm, at the open of the next candle.
To change the time to close all trades , Go to Pine Editor → Edit the line 103 .
All open trades get closed at 3pm , because some brokers don't allow you to place fresh intraday orders after 3pm .
NSE:RELIANCE
// ═══════════════════════════════════════════════ //
// ————————> BACKTEST RESULTS ( 128 CLOSED TRADES )<————————— //
// ═══════════════════════════════════════════════ //
INPUTS can be changed for better back-test results.
The strategy applied to NIFTY ( 5 min Time-Frame and contract size 60 ) gives us 60% profitability y , as shown below
It was tested for a period a 6 months with a Profit Factor of 1.45 ,net Profit of 21,500Rs profit .
Sharpe Ratio : 0.311
Sortino Ratio : 0.727
The graph has a Linear Curve with consistent profits .
The INPUTS are as follows,
1) Leftbars ————————> 3
2) Rightbars ————————> 5
3) Price Cross Ema ——————> 150
4) ATR LONG ————————> 2.7
5) ATR SHORT ———————> 2.9
6) RISK —————————> 2500
7) Default qty size ——————> 60
NSE:RELIANCE
Save it to favorites.
Apply it to your charts Now !!
↓
FOLLOW US FOR MORE !
Thank me later ;)

Consolidation Breakout [Indian Market Timing]OK let's get started ,
A Day Trading (Intraday) Consolidation Breakout Indication Strategy that explains time condition for Indian Markets .
The commission is also included in the strategy .
The basic idea is ,
1) Price crosses above upper band , indicated by a color change (green) is the Long condition .
2) Price crosses below lower band , indicated by a color change (red) is the Short condition .
3) ATR is used for trailing after entry
// ═══════════════════════════════//
// ————————> TIME CONDITION <————————— //
// ═══════════════════════════════//
The Indian Markets open at 9:15am and closes at 3:30pm.
The time_condition specifies the time at which Entries should happen .
"Close All" function closes all the trades at 2:57pm.
All open trades get closed at 2:57pm , because some brokers dont allow you to place fresh intraday orders after 3pm.
NSE:NIFTY1!
// ═══════════════════════════════════════════════ //
// ————————> BACKTEST RESULTS ( 114 CLOSED TRADES )<————————— //
// ═══════════════════════════════════════════════ //
LENGTH , MULT (factor) and ATR can be changed for better backtest results.
The strategy applied to NIFTY (3 min Time-Frame and contract size 5) gives us 60% profitability , as shown below
It was tested for a period a 8 months with a Profit Factor of 2.2 , avg Trade of 6000Rs profit and Sharpe Ratio : 0.67
The graph has a Linear Curve with consistent profits.
NSE:NIFTY1!
Save it favorites.
Apply it to your charts Now !!
Thank me later ;)

TradersAI_UTBotCREDITS to @HPotter for the orginal code.
CREDITS to @Yo_adriiiiaan for recently publishing the UT Bot study based on the original code -
I just added some simple code to turn it into a strategy. Now, anyone can simply add the strategy to their chart to see the backtesting results!
While @Yo_adriiiiaan mentions it works best on a 4-hour timeframe or above, I am happy to share that this seems to be working on a 15-minute chart on e-mini S&P 500 Index (using the KeyValue setting at 10)! You can play around with the different settings, and may be you might discover even better settings.
Hope this helps. Btw, if any of you play with different settings and discover great settings for a specific instrument, please share them with the community here - it will be rewarded back multiple times!
