PVA Range High & LowFINALLY LEFT. the RANGE DAILY at the top RDH and the RANGE DAILY at the bottom RDL, is a PVSRA indicator used to calculate the daily ATR (Average True Range), with the help of my friend @ferhro, I was the one that managed to get closer to the original indicator for the metatrader 4.
Let's the features.
This indicator works as a support and natural resistance of the price, as it has a similarity with the pz supertrend, only on the daily chart.
Range daily High is the gray color and Range daily Low is the red color.
To extract the greatest potential from this indicator, I recommend using forex.
The indicator will be open source for suggestions for improvements.
Averagedailyrange

ADR% - Average Daily Range % by MikeC (AKA TheScrutiniser)This applies a 'corrected' formula to the version created by alpine_trader (which is slightly off). It calculates the Average Daily Range (in percent) over the previous 20 periods and plots it in a chart.
I am grateful to GlinckEastwoot for the 'corrected' formula.


Trade Context Overnight Range & Average Daily Range ProjectionThis indicator plots the low and high of a time period of your choice. We use this to plot the overnight high and low for the futures markets.
The ADR projection shows you a dynamic projection of how far the average daily range would take us. It updates in real time as the market makes new highs and lows.


5 Day ADR ICT Intraday TrackerPretty self explanatory, this indicator tracks todays current range as a % of the 5 Day ADR.
This is most useful for finding entries and looking for exits intraday, ie: how much hypothetical room is there for a trade to run? looking for entries in yellow and orange zones, exiting in blue once the ADR is reached etc.
Reset variable should be used for the end of day close. For forex on Oanda its 1700. Probably a way to do this programatically, if its obvious let me know and i can update it.
Can be set to clip output above 110% once the daily ADR has been fulfilled - this can be turned on or off.
Experimental mode for finding consolidations, based on the ADR for each day not been fulfilled and contracting. can be good for finding pending range expansion.
Code is pretty ugly, feel free to tweak.
current known issues: Indicator doesnt work for many non forex pairs, due to coding laziness. Indicator does not work on 1 minute timeframe.

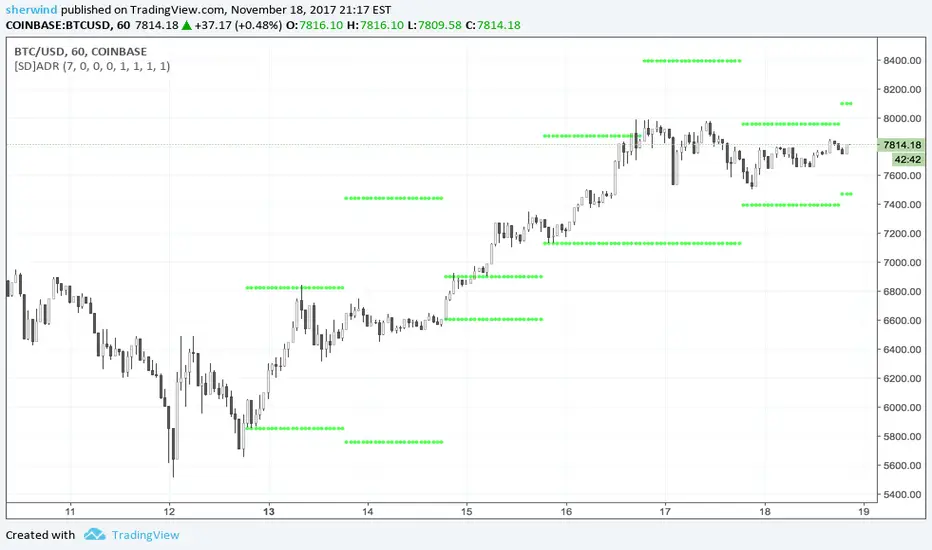
SD - Average Daily Range - Daily Weekly Monthly YearlyAverage Daily Range ('ADR') Indicator for TradingView
This script is based on the "Best 'ADR' Indicator for MT4" described at www.fxdayjob.com
Inputs:
Number of 'ADR' Back - Set the number of calendar days back to plot historical 'ADR'. The default value is 7.
Non-trading days are not taken into account.
A value of 7, for example, would display only 5 'ADR' for a 24x5 market.
Number of 'AWR' Back - Set the number of calendar weeks back to plot historical 'AWR'. The default value is 0.
Number of 'AMR' Back - Set the number of calendar months back to plot historical 'AMR'. The default value is 0.
Number of 'AYR' Back - Set the number of calendar years back to plot historical 'AYR'. The default value is 0.
'ADR' Length parameter - Set the length parameter of 'ADR'. The default value is 1.
'WDR' Length parameter - Set the length parameter of 'AWR'. The default value is 1.
'MDR' Length parameter - Set the length parameter of 'AMR'. The default value is 1.
'YDR' Length parameter - Set the length parameter of 'AYR'. The default value is 1.
See also:
- www.fxdayjob.com
- pivotboss.com
- www.jarrattdavis.com