ADR PercentUses past 5 day's daily average ranges and calculates average ADR percentage with respect to latest day's open
Acknowledgement - Uses code from another excellent indicator from critian.d
Average

Vision Essentials - MACDVision Essentials - MACD is the second indicator in our Essentials pack. It's a fully customizable MACD indicator with some extra perks the Vision team feels provides helpful & simplified insight when studying a chart.
What makes this indicator different?
Under the Standard mode you'll feel right at home compared to a standard macd indicator. Our Advanced mode is where things change a bit more. Under Advanced mode outside of the visual customization we provide visual outputs identifying bullish/bearish crossovers of the macd & signal, and track the high and low points of the macd with a second set of colors which users can customize. We also plot text in these areas so there's a clear indication of what the changing colors mean.
How do I use this indicator?
To start, it's best you have an understanding of what MACD (moving average convergence divergence) is. There are lots of great educational ideas here on TradingView which we recommend absorbing. We highly recommend you start with this article directly from the TradingView Help Center
Settings
MACD Mode - Standard provides you with a closer to traditional style MACD whereas Advanced at a glance highlights areas such as crossover points, highs, lows, and current direction relative to histogram movement.
MACD Settings - Select the source & values used for the macd calculations. close is the most commonly used source, and 12/26/9 are the most common length values. Adjust these to see how the indicator behaves. Lowering the fast and slow values will result in more activity, but be aware that doesn't = more accuracy.
Standard Visual Settings - STANDARD MODE: These settings will adjust the color you want to use as an indication of bullish & bearish movement.
Advanced Visual Settings - ADVANCED MODE: Use these settings to adjust the color you want to use as an indication of bullish, bearish, recent macd highs, recent macd lows, and text color.
High/Low Distance - ADVANCED MODE: This setting defines how far back the indicator looks to find the most recent highs/lows of macd.
Enable Crossover Bars - ADVANCED MODE: This settings enables the vertical bars that connect the center of the histogram to the macd/signal "wave" to indicate where crossovers are happening.

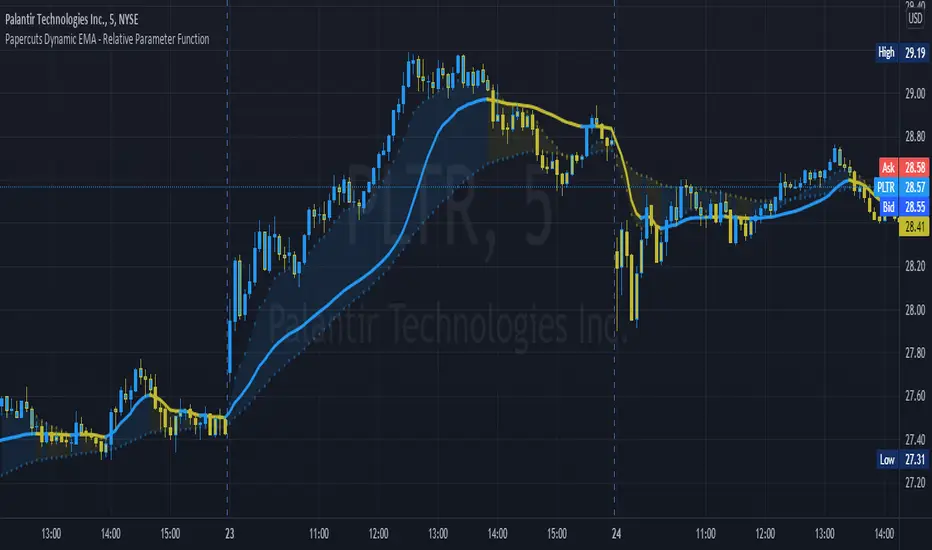
Papercuts Dynamic EMA - Relative Parameter FunctionThe goal of this is to link two parameters of different known low and high values so one affects the other.
In this case, I want to link Relative Volume to the length of an EMA, so it responds faster in times of high volume.
As an animator I am used to linking values in this way with Maya using a set driven key, took some work to figure it out in pine.
Looking up this concept, it has a few names, Relative values, linear interpolation, or rescale values.
Thanks to pinecoders for writing the EMA funciton that can accept length variables!
Here's a quick look at the root function to link the two values.
f_relativeVal(_source, in_bot, in_top, out_bot, out_top) =>
// float _source: input signal
// float in_bot : minimum range of input signal.
// float in_top : maximum range of input signal.
// float out_bot : minimum range of output signal.
// float out_top : maximum range of output signal.
clampSrc = _source > in_top ? in_top : _source < in_bot ? in_bot : _source //claps source to create a controlled range
//relInput = (clampSrc - in_bot) / (in_top - in_bot) * 100
inDiffIncrement = (in_top - in_bot)
outDiffIncrement = (out_top - out_bot)
out_bot + (clampSrc - in_bot) * outDiffIncrement / inDiffIncrement // rescale input range to output range
Complete MA DivisionThis indicator simply divides two moving averages and calculates the slope of the resulting curve to show when an asset's momentum is slowing down. The original idea was in a recent youtube video by Ben Cowen . His indicator didn't show the complete history of the moving average, so I wanted to try a little trick to get the moving averages at the beginning of time even when using a large moving average period. I accomplished this by counting the number off current bars using the cum() function. After the count is hit, the period will be constant.
Changing the curve smoothing will smooth the actual curve. Both moving average periods should be divisible by the curve smoothing.
Changing the slope smoothness will dictate when the slope is starting to slow down. Keep this high to break through the noise.
Start of Red = Good time to sell
Start of Green = Good time to buy
There is a weird issue with the smoothness of the line so just keep your moving averages divisible by the curve smoothing. I couldn't figure that issue out yet.

Multi-Length Stochastic Average [LuxAlgo]This indicator returns the average of stochastic oscillators with periods ranging from 4 to length . This allows for a slightly more reactive oscillator as well as having information regarding the position of the price relative to rolling maximums/minimums of different periods.
We introduce settings that allow for pre and post-smoothing, with selectable smoothing methods and periods for both steps.
Settings
Length: Period of the indicator, determine the maximum period of the stochastic oscillator used in the average
Source: Source input of the indicator
Pre-Smoothing (1st Input): Degree of smoothing applied to the source input
Pre-Smoothing (2nd Input): Pre-Smoothing Method
Post-Smoothing (1st Input): Degree of smoothing applied to the final oscillator output
Post-Smoothing (2nd Input): Post-Smoothing Method
Smoothing methods include a simple moving average, a triangular moving average, and a least-squares moving average (this method can induce overshoots during the post-smoothing step). The user can also select "None".
Usages
The "multi-length" aspect of technical indicators is something that hasn't been deeply explored yet such indicators can give us information regarding both short-term and long-term information which was the motivation for the creation of the indicator.
The Multi-length Stochastic Average allows us to quantify the price position relative to a multitude of highest/lowest levels.
In the example above the oscillator returns the average of stochastic oscillators with periods ranging from 4 to 20, as well as multiple rolling minimums with periods ranging from 4 to 20. We can see that when the price is equal to all rolling minimums the oscillator is equal to 0, the oscillator would return 100 if the price were equal to all rolling maximums with periods in that same range.
The oscillator can be interpreted like any scaled oscillator and can be used to estimate trend direction as well as trend strength.
Here we only make of use pre-smoothing by using a period 20 simple moving average. The indicator graphical elements such as colors/circles can help us determine potential directions trends might take.
Circles are displayed when the oscillator crosses over/under the 20/80 level. Such conditions offer better timing than waiting for the oscillator to be greater/lower than 50 and are less subjective to noise than simply looking at the direction taken by the oscillator. However, it can suffer from potential retracements in a trend more easily, this is illustrated in the chart above.

Trend System Multiple Moving Averages RatingThis is a trend system made with multiple moving averages designed especially for trending markets such as stocks or crypto.
It can be used with any timeframe.
Its made of multiple moving averages such as
Simple
Weighted
Volume Weighted
Exponential
Double EMA
Arnaud Legoux
Hull MA
Smoothed
Least Squares
Kaufman Adaptive
Triple EMA
Zero Lag
Fractal Adaptive
Variable Index Dynamic Average
Jurik Moving Average
Tillson
Triangular
Avg of all moving averages
It has also a rating, making an avg from all of the moving averages , going from -100 (all ma's are telling to go short ) to 100 ( all ma are telling to go long).
If you have any questions let me know !

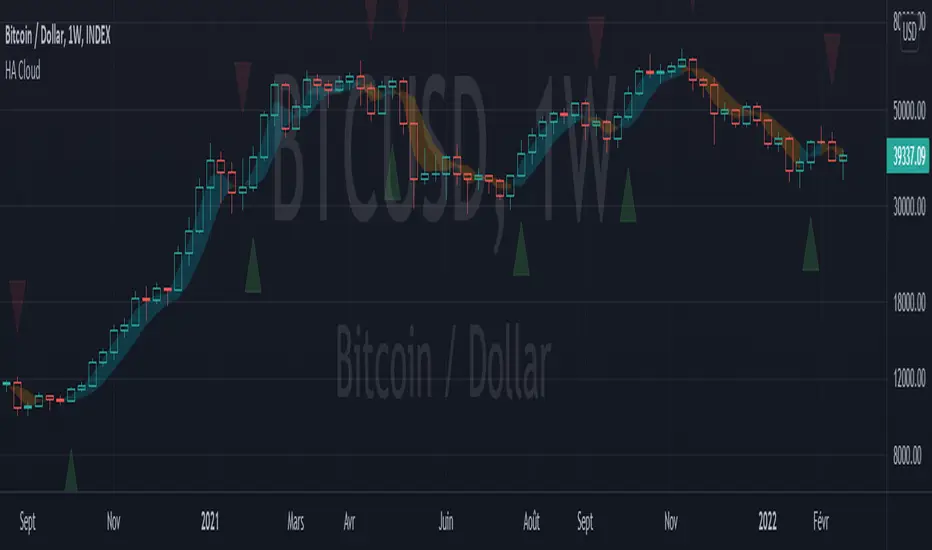
Heikin Ashi Cloud overlayThis script displays a cloud representing the bodies of Heikin Ashi candles, which allows to have all the information of the HA technique without losing focus on the classical candles.
Also has arrows to indicate a trend reversal (counterproductive in a range !)
Cross Average PriceSimple script that allows you to view crossings and averages 14/50/100/200 in a simple and intuitive way.
With this script you can keep an eye on trends visually.
Green Point = 14 crosses 50
Yellow Point = 14 crosses 100
Red Point = 14 crosses 200

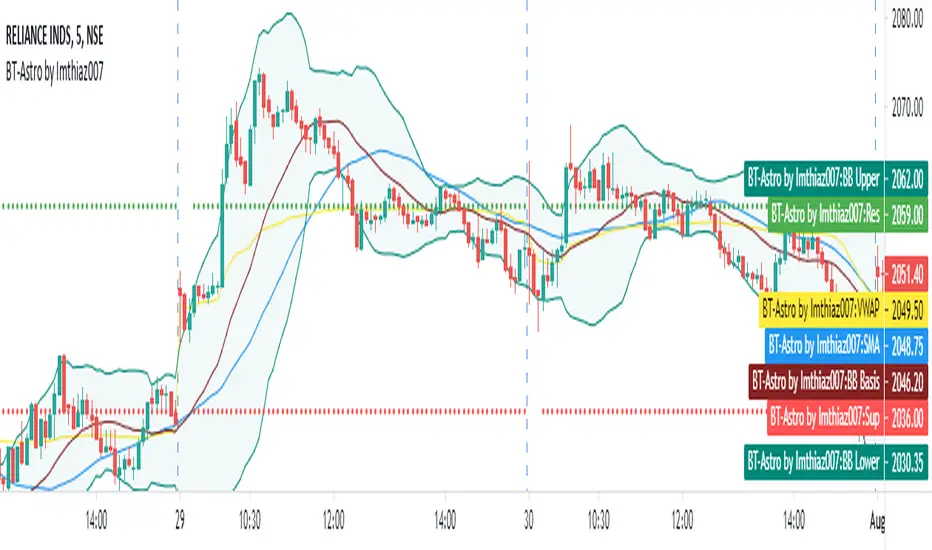
BT Astrology Indicator by Imthiaz007
BT-Astrology Indicator is fine tuned indicator to calculate and draw daly support and resistance based on Gann level for intraday trade or swing trade.
The original Idea is given by Mr. Alex from Badshai Trading; I am a Software Developer by profession so that I just coded it and add some signals for back testing.
I also add following Indicator for better view:
a) Simple Moving Average
b) VWAP
c) Bollinger Band
The Input section of the Indicator :
SMA :- Length 35 as per Mr. Alex suggestion
Minutes : Enter minutes in terms of number of minutes on which VWAP value will be taken for calculating the levels.
By default it will be 20 means VWAP value of 9:35 AM candle will be consider for drawing levels.
How it works ?
Buy : When resistance is broken with higher high formation and candle is above 35 SMA
Sell : When support is broken with lower low formation and candle is below 35 SMA
Hope you like it!!!
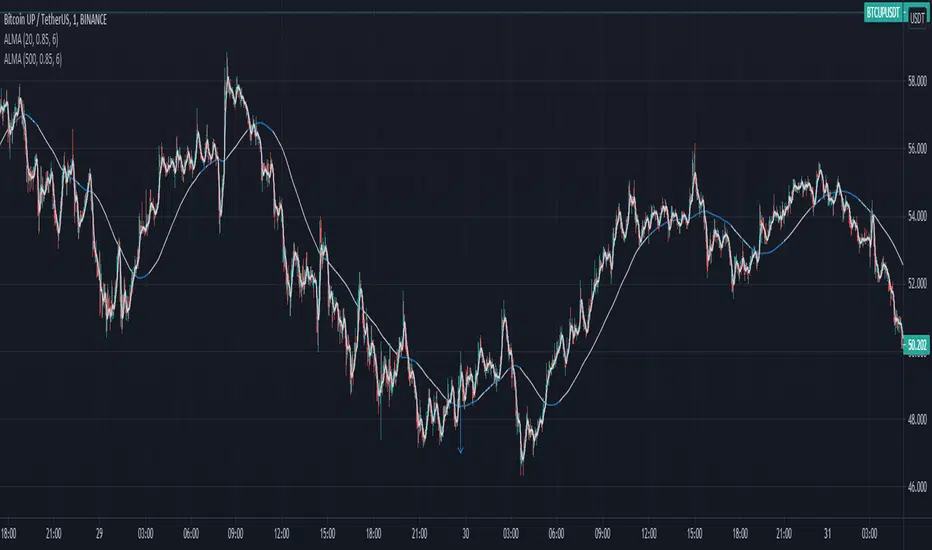
Moving Average Ribbon [TheBearFighter]
This code was written using:
•Pine Script Coding Conventions.
This script provides a very useful tool for new community users and professionals. It puts at your disposal a Moving Average Ribbon by hand to graph and easily find the ones with the highest performance. The creation of this script was motivated because in free TradingView accounts there is a limit of 3 indicators by chart, and with this tool you can draw up to 32 MA's at the same time!
Choose one of 10 types of MA´s:
•KAMA Kaufman's moving average.
•HULL Hull moving average.
•TEMA Triple exponencial moving average.
•LSMA Least square moving average.
•DEMA Double exponencial moving average.
•ALMA Arnaud Legoux moving average.
•WMA Weighted moving average
•EMA Exponencial moving average.
•VWMA Volume Weighted moving average.
•SMA Simple moving average.
Use the tooltips to know the lengths of MA´s.
A main characteristic of the script is that the lengths are in days but when changing the lowest timeframes, the same daily resolution is maintained. This gives us extreme precision in intraday timeframes, e.g 30 minutes.
Once this is understood, we can turning the MA´s on/off, and changing the timeframe to our liking.
Available timeframes: M, W, D, 4H, 1H, 30m, 15m, 5m.
Also the MA´s are colored for easy visualization and know if they grow or decrease.
Thank´s to @midtownsk8rguy to let me know more about HEX colors.
Thank´s to @HPotter for his KAMA.


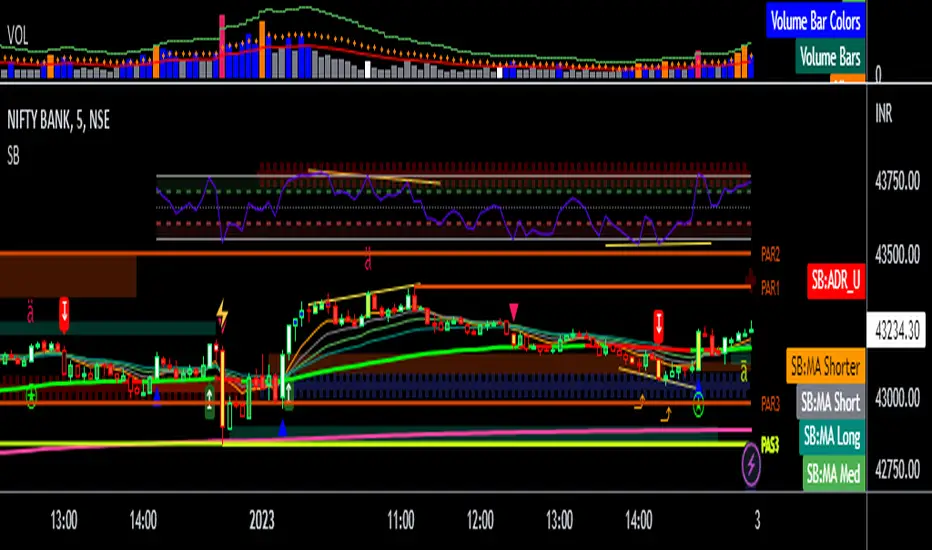
Supertrend BandsSupertrend Bands
What is the Supertrend indicator?
"The Supertrend indicator is a trend following overlay on your trading chart, much like a moving average, that shows you the current trend direction.
The indicator works well in a trending market but can give false signals when a market is trading in a range.
It uses the ATR (average true range) as part of its calculation which takes into account the volatility of the market. The ATR is adjusted using the multiplier setting which determines how sensitive the indicator is."
"For the basic Supertrend settings, you can adjust period and factor:
- The period setting is the lookback for the ATR calculation
- Factor is the what the ATR is multiplied by to offset the bands from price"
How to use this indicator
This indicator is inspired by a strategy I found. It includes four Supertrend indicators, each with different settings that displays trend strength and support/resistance zones. The default settings are optimal for cryptocurrency but do work quite well for traditional also. I highly recommend you try experimenting with different settings, increasing them to suit the instrument.
The bands are set from low to high, Band 1 being the fastest and Band 4 being the slowest. Band 4 is the one that sets the overall trend so when price is above Band 4, the trend is bullish and vice versa. Trend is strongest when price is above/below Band 1 and gets weaker as it filters through each band. Band 4 provides the strongest support/resistance and if that breaks the trend flips.
In the menu, you will see an option called "Remove Anti Trend?". It is enabled by default and it removes any bearish/resistance bands when the trend is up and any bullish/support bands when the trend is down. When turned off, it will show all Supertrend Bands as they are by default.
Bar Colors
Bar colors are optional and they reflect the current trend strength based on the Supertrend bands.
Alternate ways of using this indicator
You could leave everything as default or you can display individual bands. For instance, because I use many overlay indicators, most of the time I turn off all the bands and only show bar colors:
You can also turn off Bands 1 and 2 and only show the two slowest lengths:
This removes the noise of the two faster Supertrends.
Or just show the two fastest bands:
Any suggestions to improve this indicator are most welcome :)

Tradingview ToolkitA new trader's biggest barrier to entry is lack of understanding where they are in terms of time and price and with tradingview free they are often limited to just 1 or 2 extra indicators as many new traders slap on RSI and MACD as 2/3 free ones. While these indicators are fine for trend analysis, its important to know where the price is in relation to time. Thus, this all-in-one script is meant to have a lot of customizable utility to save on indicator spots and act as a hotspot for many common needs.
-2 Sets of VWAP line w/ standard deviation bands with customizable timeframes.
-1 more customizable timeframe VWAP line (no std dev bands) to use as a long time frame reference
-Ability to plot previous VWAP close prices over current timeframe on all VWAP lines w/ basic color changing if price closes above/below
-2 Sets of Bollinger Bands with customizable source length and MA type
-3 customizable moving averages with custom timeframe/resolutions
-Inside candle barcolor repainter to easily notice if a candle was inside the range of the previous candle (price contraction)
Not meant to have everything on at once, but simply a place to enable and disable different things and save spots for more important things

Moving Average Slope AnalysisThis is a simple script which allows to do slope analysis on any kind of Moving Average. Simply change the moving average function that you wish to work with , in the script.
Slope analysis may be required for fine-tuning trade automation software , which uses Moving Average for determining optimum enter/exit point.
Read code comments for instructions!
Moving Average Buy/Sell IndicatorUsing a selected Exponential Moving Average (EMA)/Simple Moving Average (SMA) range, this indicator inserts a Long/Short (buy/sell) indicator overlaid on chart depending on the following conditions:
- LONG/BUY SIGNAL = if SMA value is less than EMA, and both the SMA and EMA are less than the current average price.
- SHORT/SELL SIGNAL = if SMA value is greater than EMA, and both the SMA and EMA are greater than the current average price.
**Intended for use with the 21 and 34 weekly moving average time range. Much more useful for long-term analysis rather than short-term analysis.**

Moving Average Crossover with Shading Signals This script uses 3 moving averages (2 simple moving averages and 1 exponential moving average ) to signal long and short opportunities based on moving average crossovers.
A long SMA (Signal SMA2) is used to determine longer term trend. When the EMA crosses above the Slow SMA1 and price is above the Signal SMA2. The space between the moving averages will shade green and the Signal SMA should also be green.
A sell signal occurs when the EMA crosses below the Slow SMA1 and price is below the Signal SMA2. The space between the moving averages will turn red and the Signal SMA should also be red.
A retracement, consolidation, or reversal may be occurring if the shaded color is yellow.
Use the identifying shapes to learn when to open or close positions.

Buy/Sell Volume confirmation for BO_Entry_ExitThis script helps to identify the volume strength basis EMA and various EMA multipliers, There are provisions provided to enable and disable when the volume is gaining momentum and the volume for a particular candle touches the Break Out criteria. Users will be able to modify the criteria for Volume strength and Volume break out Indication. It will also show the buyers & sellers strength of a volume bar which the uses will be able to enable and disable.
Stepping MAInput desired timeframe and etc
Ex: Timeframe Daily
Input 100
Will display daily moving of 100 on every timeframe

Trend Indicator A-V2 (Smoothed Heikin Ashi Cloud)"Trend Indicator A-V2" and "Trend Indicator B-V2" are updated and improved versions of my initial trend indicators. Totally rethinking the code, adding highs and lows in the calculations, including some more customisation through colour schemes.
In practice, this indicator uses EMAs and Heikin Ashi to provide an overall idea of the trend.
The "Trend Indicator A-V2" is an overlay showing “Smoothed Heikin Ashi” .
The "Trend Indicator B-V2" uses the same values in a different way to measure the momentum of the trend and identify potential trend rejections.
Please, take into account that it is a lagging indicator.

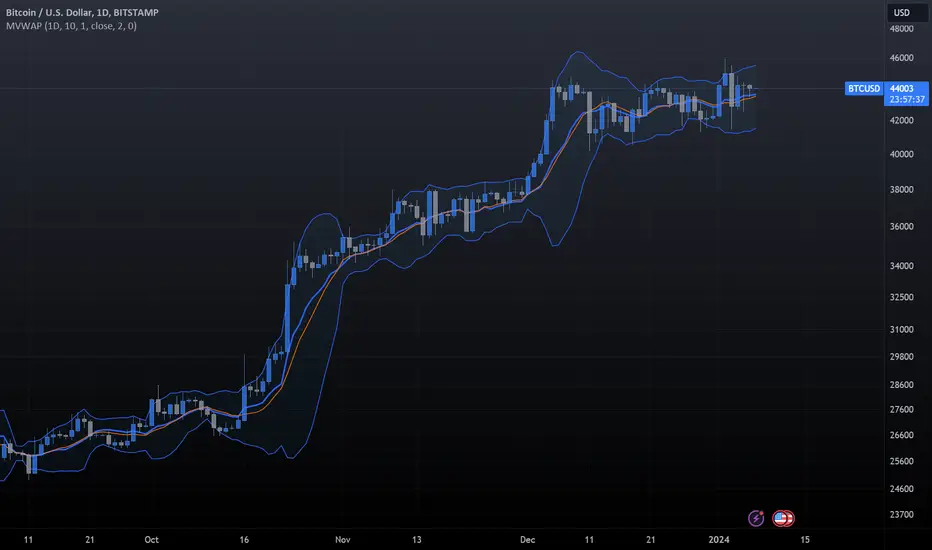
Moving Average BandsUse this script to find buy and sell zones for BTC based on momentum of the move relative to the average asset price over a given period. The script plots a series of offset bands above and below the Simple Moving Average. When price crosses another band further from the SMA, the background is rendered brighter. The brighter the background, the stronger the buy and sell signal is, as the expectation is that price wants to return to the SMA. Settings are adjustable to fine tune to various time frames and assets. Good settings for BTC Daily are length 30, layers at 10, 20, 30, and 40.
On 1H BTC/USD I use length 200, layers at 5, 10, 15, 20 to find decent swing trading opportunities.
On BTC/USD 1D chart, combine with Bitcoin Logarithmic Growth Curve from @mabonyi (original by @quantadelic )for confluence of very reliable signals.

RSI With Optional Average @RknOur old fellow RSI , but with an average (Select among SMA, EMA or WMA) line in this version. When RSI crosses its average or the center (50) line it may be considered as a Buy and/or Sell signal.
Just coded for learning purposes. Anyone who think that an average line would be good on RSI is welcomed.
