RSI DivergenceWhat is "RSI Divergence"?
"RSI Divergence" is a indicator that find RSI divergence automatically.
What it does?
When it finds an RSI divergence, it draws a line on the indicator.
How it does it?
The lines are found using the least squares method. If the signs of the linear regression on the graph and the linear regression plotted on the RSI are different, this is considered divergence.
How to use it?
RSI lenght = RSI lenght
source = source of RSI
RSI Divergence Lenght = lenght of lines that draws on indicator
zoom = zoom
examples:
Automatedsignals

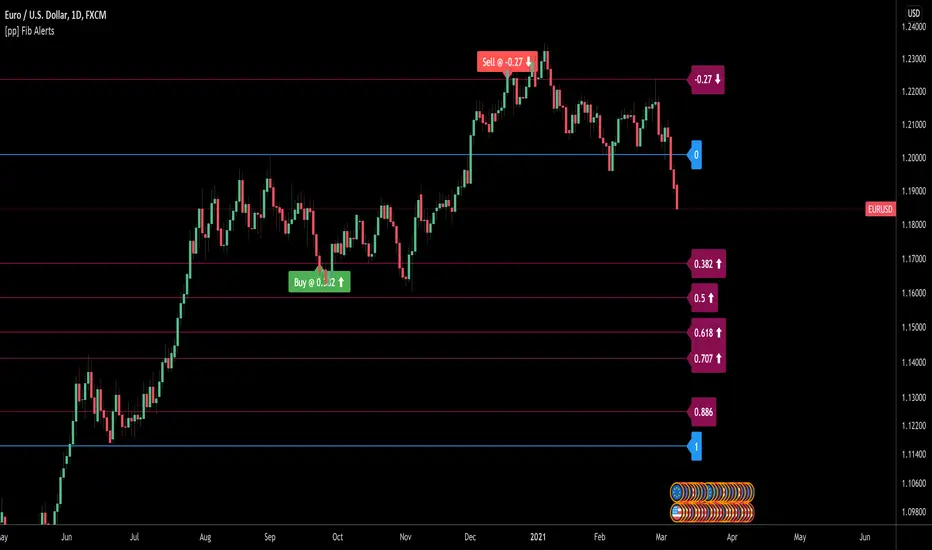
[pp] Fib AlertsUsing the new input.price() function we can now automate our fibonacci tools a little better.
This tool is designed with the intention of trading off of a fibonacci level using alerts.
How to use:
1.Add the indicator to your chart.
2. Place the bottom price where you would normally start your fibonnaci drawing
3. Place the top price where you would normally end your fibonacci drawing
4. Set your alert syntax "buy alert message" and "sell alert message" Should be replaced with webhook configurations or something better.
5. Fibonacci values > 1 (ie. 0.382, 0.5, 0.618) are recognized as retracements and work well as buying opportunities. When the price crosses one of these levels the "buy alert message" alert will be immediately triggered ONCE per BAR (I may update this in the future so it can only trigger ONCE ever to avoid multiple orders)
6. Fibonacci values < 1 (ie . -0.113, -0.27) are recognized as extensions levels and work well as selling opportunities. When the price crosses one of these levels the "Sell alert message" alert will be triggered.
If anyone knows how to convert the fibonacci values to logarithmic values I would greatly appreciate insight.
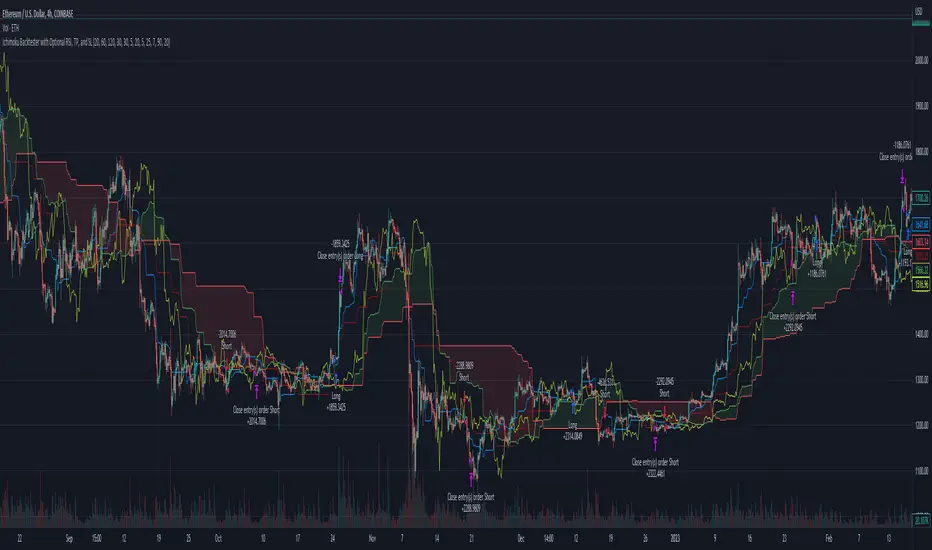
Ichimoku Basic AlertsStarted with Ichimoku Kinko Hyo by Mizuki32. Converted to study and added alerting and cloud confirmation.