TUE Argentum Algo V1This algorithm is designed to look trend for opening conditions, apply various filters including volume and volatility, then determine stop outs, break evens, and take profits.
The algorithm uses proprietary math based on the concepts of volatility, standard deviations, average true ranges, and volume to help determine trend. You can filter based on cumulative volume delta, volatility, and moving average based trend. It includes settings for either trend following or contrarian trades, and the ability to go long, short, or both.
The take profit areas are based on proprietary math that help find peaks and valleys. You can adjust the size of the take profits as a percentage of the position, change to static take profits (i.e. take profit in 16 ticks), or use both. You can also disable them and use the natural closing conditions of the trades (detection of trend change in the opposite direction).
Our algo works in any market and will allow user to adjust input settings to be used on any ticker they'd like. It is built as a strategy so you can back test on any ticker to find the exact right settings to dial it in and then switch to live trading mode to see signals. Can be used for day trades or swing trades.
Automated Trading
This algo has been tested and certified to work for automated trading.
Works on Forex
It's confirmed to work on forex so you can trade that market.
Gets you into long successful trades, and gets out of poor ones quickly
It keeps you in the long trades taking small profits along the way, but cuts losers quickly in comparison. This style leads to a high profit factor.
It looks at many variables so you don't have to
- Uses trend analysis for opening/closing conditions.
- It measures the strength of trends to help determine if it should enter or not.
- It uses volume, if the user wants, to help filter entries. The volume calculation is based off of my proprietary cumulative volume delta indicator and helps find if the volume is moving long or short.
- It uses proprietary take profit math to help find peaks and valleys to peel off profits. It is based on the changes in momentum of the underlying.
- It allows for stop outs and break evens based on volatility so they'll always adjust with the movement of the underlying ticker (see the blue lines above and below the opening in the chart).
- It allows for offset break evens to keep a portion of the profit.
Strategy for the Algo
Included so you can understand how to trade with it.
ONE: After loading this strategy onto a ticker turn off volume if it's a ticker with no volume , set the dates at the bottom to when the stock is active (you want to start backtesting when a stock started trading like it trades currently).
TWO: From there adjust the short term trend settings to find the highest win rate and profit factor.
THREE: Then adjust the volume length to find the highest win rate and profit factor. It's important while doing these that you pay attention to a smooth upward equity curve.
FOUR: After this has been done now adjust the long and short risk multipliers. This determines your stop out.
FIVE: Then adjust breakeven multipliers - this is the level at which it changes to a breakeven stop out instead of the previous one. You can also set an offset to keep a small part of the profit.
SIX: Finally adjust the take profit sizes.
SEVEN: Once this is all done go back through the list and adjust up and down by one or two clicks and see if a better curve can be obtained. Very frequently long and short trades have different settings.
EIGHT: When you are finished save the settings in a custom indicator template and put it with it's own chart.
Additional
The settings shown on screen are not the default settings, but are settings chosen for this ticker and timeframe based on the process above. Nearly every ticker and timeframe will require adjustment from default, that's why the algorithm is built to be highly flexible. It can fit any ticker and timeframe, as well as market environment.
This particular setup has the algo running a scalping program on ES 3 min with a 16 tick static target. This algorithm can be set up as a scalper, or used to day trade more regularly. It can also swing trade.
As shown here the algo includes $1.25 of commissions and 1 tick of slippage on all orders (about our average for automated trading on ES).
Automatedsignals

TUE ADX/MACD Confluence Algorithm V1This algorithm is designed to look at the ADX/MACD confluence for opening conditions, apply various filters including volume and volatility, then determine stop outs, break evens, and take profits.
The ADX and MACD confluence can be a powerful predictor in stock movements. Both of these indicators find trend but do it in different ways. When they're combined they have a high success rate of finding openings. That's done by finding the bar in which both show the same direction - that bar is the beginning of the confluence. I have a free indicator called the TUE ADX/MACD Confluence that you can use to see this in action.
This script will help you find those confluences in an easy to understand manner. It will open a trade on a detected confluence, using the rest of the variables available in the algorithm as filters. You can filter based on cumulative volume delta, volatility, and trend. It includes settings for either trend following or contrarian trades, and the ability to go long, short, or both.
It includes Buy and Sell signals for detected confluences, and will show colored candles to help you determine when to exit a trade if you don't want to follow the included take profit areas. When the candles turn to white that means the detected confluence is no longer in play. The Buy and Sell signals will display on the first occurrence of each confluence.
The take profit areas are based on proprietary math that help find peaks and valleys. You can adjust the size of the take profits as a percentage of the position, change to static take profits (i.e. take profit in 16 ticks), or use both. You can also disable them and use the natural closing conditions (reversal of MACD/ADX confluence).
Our algo works in any market and will allow user to adjust input settings to be used on any ticker they'd like. It is built as a strategy so you can back test on any ticker to find the exact right settings to dial it in and then switch to live trading mode to see signals. Can be used for day trades or swing trades.
Automated Trading
This algo has been tested and certified to work for automated trading.
Works on Forex
It's confirmed to work on forex so you can trade that market.
Gets you into long successful trades, and gets out of poor ones quickly
It keeps you in the long trades taking small profits along the way, but cuts losers quickly in comparison. This style leads to a high profit factor, as you can see over 3.0 in the included ES 3 Min chart.
It looks at many variables so you don't have to
- Uses ADX/MACD confluence for opening/closing conditions.
- It uses volume, if the user wants, to help filter entries. The volume calculation is based off of my proprietary cumulative volume delta indicator and helps find if the volume is moving long or short.
- It uses proprietary take profit math to help find peaks and valleys to peel off profits. It is based on the changes in momentum of the underlying.
- It allows for stop outs and break evens based on volatility so they'll always adjust with the movement of the underlying ticker (see the blue lines above and below the opening in the chart).
- It allows for offset break evens to keep a portion of the profit.
Strategy for the Algo
Included so you can understand how to trade with it.
ONE: After loading this strategy onto a ticker turn off volume if it's a ticker with no volume , set the dates at the bottom to when the stock is active (you want to start backtesting when a stock started trading like it trades currently).
TWO: From there adjust the ADX/MACD to find the highest win rate and profit factor.
THREE: Then adjust the volume length to find the highest win rate and profit factor. It's important while doing these that you pay attention to a smooth upward equity curve.
FOUR: After this has been done now adjust the long and short risk multipliers. This determines your stop out.
FIVE: Then adjust breakeven multipliers - this is the level at which it changes to a breakeven stop out instead of the previous one. You can also set an offset to keep a small part of the profit.
SIX: Finally adjust the take profit sizes.
SEVEN: Once this is all done go back through the list and adjust up and down by one or two clicks and see if a better curve can be obtained. Very frequently long and short trades have different settings.
EIGHT: When you are finished save the settings in a custom indicator template and put it with it's own chart.
Additional
The settings shown on screen are not the default settings, but are settings chosen for this ticker and timeframe based on the process above. Nearly every ticker and timeframe will require adjustment from default, that's why the algorithm is built to be highly flexible. It can fit any ticker and timeframe, as well as market environment.
Also included in the chart above is a $1.25 commission per contract, and a tick of slippage (which on average is about right for automated trading on ES).

RSI DivergenceWhat is "RSI Divergence"?
"RSI Divergence" is a indicator that find RSI divergence automatically.
What it does?
When it finds an RSI divergence, it draws a line on the indicator.
How it does it?
The lines are found using the least squares method. If the signs of the linear regression on the graph and the linear regression plotted on the RSI are different, this is considered divergence.
How to use it?
RSI lenght = RSI lenght
source = source of RSI
RSI Divergence Lenght = lenght of lines that draws on indicator
zoom = zoom
examples:

PlurexSignalLibrary "PlurexSignal"
Provides functions that wrap the built in TradingView strategy functions so you can seemlessly integrate with Plurex Signal automation.
NOTE: Be sure to set your strategy close_entries_rule="ANY" and pyramiding=20 or some other amount appropriate to your strategy in order to have multiple entries.
plurexMarket()
Build a Plurex market string from a base and quote asset symbol.
Returns: A market string that can be used in Plurex Signal messages.
tickerToPlurexMarket()
Builds Plurex market string from the syminfo
Returns: A market string that can be used in Plurex Signal messages.
simpleMessage(secret, action, marketOverride)
Builds Plurex Signal Message json to be sent to a Signal webhook
Parameters:
secret : The secret for your Signal on plurex
action : The action of the message. One of .
marketOverride : Optional, defaults to the syminfo for the ticker. Use the `plurexMarket` function to build your own.
Returns: A json string message that can be used in alerts to send messages to Plurex.
long(secret, marketOverride, qty)
Open a new long entry. Wraps strategy function and sends plurex message as an alert.
Parameters:
secret : The secret for your Signal on plurex
marketOverride : Optional, defaults to the syminfo for the ticker. Use the `plurexMarket` function to build your own.
qty : Corresponds to strategy.entry qty
short(secret, marketOverride, qty)
Open a new short entry. Wraps strategy function and sends plurex message as an alert.
Parameters:
secret : The secret for your Signal on plurex
marketOverride : Optional, defaults to the syminfo for the ticker. Use the `plurexMarket` function to build your own.
qty : Corresponds to strategy.entry qty
closeAll(secret, marketOverride)
Close all positions. Wraps strategy function and sends plurex message as an alert.
Parameters:
secret : The secret for your Signal on plurex
marketOverride : Optional, defaults to the syminfo for the ticker. Use the `plurexMarket` function to build your own.
closeLongs(secret, marketOverride)
Close all longs. Wraps strategy function and sends plurex message as an alert.
Parameters:
secret : The secret for your Signal on plurex
marketOverride : Optional, defaults to the syminfo for the ticker. Use the `plurexMarket` function to build your own.
closeShorts(secret, marketOverride)
Close all shorts. Wraps strategy function and sends plurex message as an alert.
Parameters:
secret : The secret for your Signal on plurex
marketOverride : Optional, defaults to the syminfo for the ticker. Use the `plurexMarket` function to build your own.
closeLastLong(secret, marketOverride)
Close last long entry. Wraps strategy function and sends plurex message as an alert.
Parameters:
secret : The secret for your Signal on plurex
marketOverride : Optional, defaults to the syminfo for the ticker. Use the `plurexMarket` function to build your own.
closeFirstLong(secret, marketOverride)
Close first long entry. Wraps strategy function and sends plurex message as an alert.
Parameters:
secret : The secret for your Signal on plurex
marketOverride : Optional, defaults to the syminfo for the ticker. Use the `plurexMarket` function to build your own.
closeLastShort(secret, marketOverride)
Close last short entry. Wraps strategy function and sends plurex message as an alert.
Parameters:
secret : The secret for your Signal on plurex
marketOverride : Optional, defaults to the syminfo for the ticker. Use the `plurexMarket` function to build your own.
closeFirstShort(secret, marketOverride)
Close first short entry. Wraps strategy function and sends plurex message as an alert.
Parameters:
secret : The secret for your Signal on plurex
marketOverride : Optional, defaults to the syminfo for the ticker. Use the `plurexMarket` function to build your own.

EasyTrade - Chandelier EMAHello Traders!
Starting from an idea of youtube channel "Ultra Trader", we have developed this simple indicator and prepared to be used with EasyTrade software.
You can setup Alerts for Crypto or Forex/Indices/Stocks/etc...
The simple but working idea behind this indicator, is a combination of "Chandelier Exit strategy" and EMA 200. It's great on long trend.
Good results are obtained with scalping timeframe from 1 to 15-minute timeframe (see video for details).
Settings
ATR Period : This value is used to change the number of candles used in ATR formula.
ATR Multiplier : This value is used to multiply the ATR value.
Use EMA filter and Value : This options Enable/Disable the EMA filter. You can change the period of the EMA
R/R ratio : You can set your Risk/Reward ratio according to your trading rules.
Show Trend : Show or hide the indicator cloud
Show Signals : Show or hide the dots on the bottom of the graphs and the "Sell" or "Buy" labels.
Show TP/SL : Show or hide Take profits (Purple line) and Stop Loss (Orange Line)
Alerts
The alert signal generated by the indicator can be directly used by the EasyTrade software to directly execute trades on your preferred Broker.
Conclusion
We hope it will be useful to simplify and automate your trading, but remember; always do your back-tests with your trading rules .
Suggestions or improvements are always welcome, if they make sense.
Credits
Ultra Trades Video
EasyTrade Free Indicators and Software

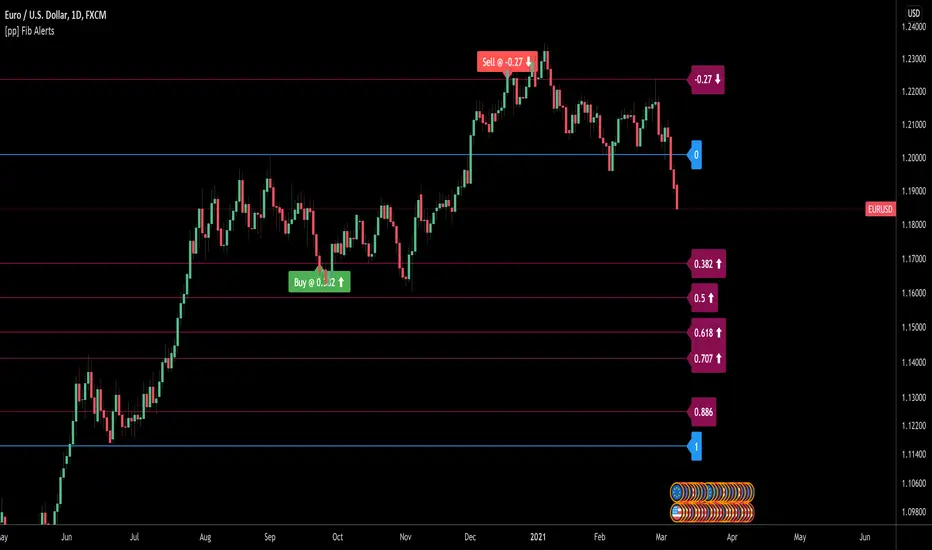
[pp] Fib AlertsUsing the new input.price() function we can now automate our fibonacci tools a little better.
This tool is designed with the intention of trading off of a fibonacci level using alerts.
How to use:
1.Add the indicator to your chart.
2. Place the bottom price where you would normally start your fibonnaci drawing
3. Place the top price where you would normally end your fibonacci drawing
4. Set your alert syntax "buy alert message" and "sell alert message" Should be replaced with webhook configurations or something better.
5. Fibonacci values > 1 (ie. 0.382, 0.5, 0.618) are recognized as retracements and work well as buying opportunities. When the price crosses one of these levels the "buy alert message" alert will be immediately triggered ONCE per BAR (I may update this in the future so it can only trigger ONCE ever to avoid multiple orders)
6. Fibonacci values < 1 (ie . -0.113, -0.27) are recognized as extensions levels and work well as selling opportunities. When the price crosses one of these levels the "Sell alert message" alert will be triggered.
If anyone knows how to convert the fibonacci values to logarithmic values I would greatly appreciate insight.
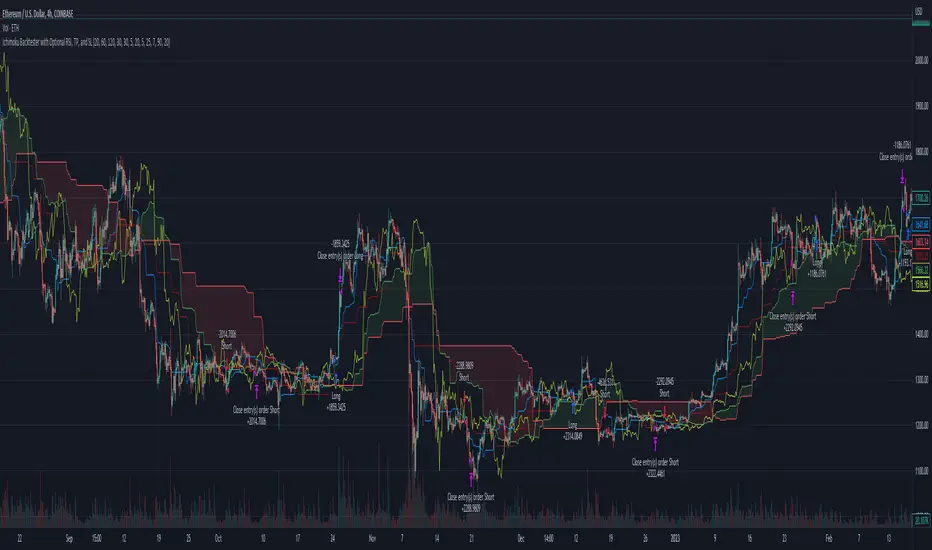
Ichimoku Basic AlertsStarted with Ichimoku Kinko Hyo by Mizuki32. Converted to study and added alerting and cloud confirmation.
Bitlinc MARSI Study AST w/ Take Profit & Stop loss - beta 0.1This script is beta 0.1 - will update as soon as the script is tradable
This script is based on AST on a 10 minute timeframe. You can change the asset and the timeframe for any asset you want to trade, but for it to work correct ALL settings have to be testes in the Strategy section of the TradingView. Each assets and timeframe require a different mixture of settings. This is NOT a one settings fits all trading for all assets on any timeframe. Below are the settings and explanation on how it works.
How it fires a buy / sell:
The script will plot an RSI with upper and lower bands in a separate indicator window. The idea behind this script is to fire a LONG when MA crosses OVER lower band and fire a SHORT when the MA crosses under the lower band. Each order that fires is an OCO (Order Cancels Order) for pyramiding.
Settings:
You have full control of these settings as mentioned above, you must configure every part of this script for each asset and timeframe you trade.
- Length of MA
- Length
- Upper bands of RSI
- Lower bands of RSI
- Take profit percentage
- Stop loss percentage
- Month to start and end the strategy (within 2020)
- Day to start and end the strategy (within 2020)
- Quantity type
- Slippage
- Pyramiding
***Remember that after the signal to enter or exit a trade is fired, the alert will trigger AFTER the close of the candle that caused the tigger to fire
