v1 Automatic Trading BotHello Friends.
We have been working on this script for a long time. Briefly, our scenario works as follows.
This test data includes results as of January 1, 2022 using a balance of $1000 and 10%.
WORKİNG LOGİC :
Relative Strength Index
Directional Movement Index
Relative Momentum Index
Indicators are Blended.
1 conditions are met in the overbought and oversold zone.
If the Directional Movement Index Signal is in the same direction, If all signals are in the same decision, it will be position.
We can set the take profit and stop loss levels on the algorithm as % over the entry price.
HOW TO ADJUST :
Formula a and formula b values are adjusted by increments or decrements of 1 each. these adjustments should be changed according to the time frame and chart layout.
You do not need to intervene in overbought and oversold zones. The Best Values were thus deemed appropriate.
If you still want to intervene, you need to know; When you change the overbought and oversold values, the entry time and risk will increase.
Together with the backtest script we are able to adjust the algorithm to all timeframes.
For example, while these settings are ideal for 5 minutes, it is necessary to change the strenght and formul values for a 15-minute period. This provides a user-specific adjustable strategy.
There are 6 different triggers in total on the alarm version.
Enter a long position.
Long position take profit
Long position stop loss
Enter a Short position.
Short position take profit
Short position stop loss
Currently, one platform is also connected to the binance exchange via an API .
The maximum leverage is set to 5 and a maximum of 5 trades are ordered to enter.
Good Luck Everyone !
Autobot

Hullk Autobot
HULLK AUTOBOT
• Long entry positions
• Profit targets
• Stop loss targets
Description
The Fast Signal Line is an extremely fast and smooth moving average indicator, designed to eliminate
the lag typically associated with traditional moving average indicators.
When the price is trending upward the Fast Signal Line is colored light grey then turns orange when
price is trending downward.
How to Trade
It is good practice to assess multiple timeframes to ensure you are mindful of the larger picture. The
15 minute and 4-hour charts are worthy of note.
In addition to displaying the current macro trend, the Fast Signal Line can also be used for judging
entries and exits from trades.
Aggressive traders may choose to trade based on the first touch of the Fast Signal Line whereas
conservative traders may wait for the signal line to be broken and established as a line of support or
resistance before taking action.
Indicator Configuration
The Fast Signal Line’s display and colors can be changed by modifying the ‘Fast Signal’ options in
the indicator’s style settings;
Volume Line
Description
The Volume Line uses short-term historic volume data to determine the balance between demand
and supply.
When volume is supporting price the Volume Line is colored yellow then turns red when the volume is
rejecting the price.
How to Trade
While the Volume Line can indicate support and resistance levels, it is best used to confirm bias
when using the Fast Trend Line indicator to enter or exit trades and can also be used by traders for
stop-loss or take profit entries.
Indicator Configuration
The Volume Line’s display and colors can be changed by modifying the ‘Volume’ options in the
indicator’s style settings;
Trend Line
Description
The Trend Line is a Weighted Moving Average indicator based on a fixed period and is used to
identify the current trend of the market.
When supporting the price, the Trend Line is colored green then turns red when rejecting the price.
How to Trade
Timeframes of 4H and above are best used to determine the current trends, while shorter timeframes
can be used for entering and exiting trades when the trendline is turning in the relevant direction.
Indicator Configuration
The Trend Line’s display and colors can be changed by modifying the ‘Volume’ options in the
indicator’s style settings;
Whales Volume Line
Description
The Whales Volume Line uses long-term historic volume data to determine the balance between
demand and supply dictated by large/institutional traders in the market.
When volume is supporting price the Volume Line is colored yellow then turns red when the volume is
rejecting the price.
How to Trade
While the Whale Volume Line can indicate support and resistance levels, it is best used to confirm
bias when using the Fast Trend Line indicator to enter or exit trades and can also be used by traders
for stop loss or take profit entries.
Indicator Configuration
The Whales Volume Line’s display and colors can be changed by modifying the ‘Whales Volume’
options in the indicator’s style settings;
Trendline Direction Line
Description
The Direction Line is a Weighted Moving Average indicator based on a longer period than the Trend
Line and is used to identify the current direction of the market.
The Direction Line indicator is colored purple when the market direction is up trending and red when
downtrend.
How to Trade
Timeframes of 4H and above are best used to determine current trend, while shorter timeframes
can be used for entering and exiting trades when the trendline is turning in the relevant direction.
Indicator Configuration
The Trendline Direction’s display and colors can be changed by modifying the ‘Trendline Direction’
options in the indicator’s style settings;
Channel Line
Description
The Channel Line is a Least Squares Moving Average indicator based on a fixed period and is used as
a crossover signal to identify bullish or bearish trends ahead of traditional simple or exponential
moving averages.
The Channel Line indicator is colored cyan when the market direction is up trending and red when
downtrend.
How to Trade
When the Channel Line changes to an uptrend along with a recovery in price, traders can use this as a
signal to enter a long position. If the signal changes to a downtrend along with a fall in price, traders
can use this to enter a short position.
Indicator Configuration
The Channel Line’s display and colors can be changed by modifying the ‘Channel’ options in the
indicator’s style settings;
Dip & Pop Signals
Description
Dip and Pop signals occur when the price is likely to make a counter-trend movement before continuing
its direction.
In a bullish trend, a Dip signal suggests that price will move down to test support before continuing,
whereas a Pop signal suggests that price will move up. In a bearish trend, a Pop signal suggests that
price will move up to test resistance before continuing, whereas a Dip signal would suggest price is
likely to continue the trend.
How to Trade
Dip and Pop signals should be used as notification for preparation rather than a call to action as the price
can move unpredictably during volatility.
Indicator Configuration
The Dip & Pop’s display and colors can be changed by modifying the ‘PoP’ & ‘DIP’ options in the
indicator’s style settings;
Entry & Exit Signals
Description
Entry and Exit Signals are indications of when to open and close trades but should be used in
conjunction with other indicators to interpret their meaning.
How to Trade
While Entry and Exit signals can be interpreted as simple long and short entries, their meaning does
change based on trend circumstance. An Entry signal is typically printed price is starting to see a
positive reaction after a drop.
When the Fast Signal, Trend, and Trend Direction lines are indicating an upward trend an Entry signal
signifies a good place to enter a long or exit a short position. However, if the lines are not suggesting
an upward trend then a long signal indicates that any long order should be exited as any new long
orders in this scenario are risky as you would be opening a position at resistance.
Likewise, when indicator lines are indicating a downward trend and an Exit signal is received this
signifies a good place to enter a short or exit a long position. However, if the signal is against the
trendlines then this is a riskier short into support.
Indicator Configuration
The Entry & Exit’s display and colors can be changed by modifying the ‘Entry’ & ‘Exit’ options in the
indicator’s style settings;
If you have any questions or are looking for access please send me a private message.
Thx for your time and support

DMT 369 DRAGRONFLY StudyDragonfly Study version plus statistics panel
Successful traders trade with a fixed plan and without emotion, but this a lot harder than many new traders think. Many never master this skill and suffer continual drawdowns on their accounts as they overtrade high leverage positions in volatile markets.
ĐΜŦ Autobot resolves this issue by taking the human element out of the equation, allowing full automation of trades using TradingView alerts to trigger your favourite trading bot, such as Alertatron or 3Commas.
Being a Trend Reversal Indicator based on Volatility & Average True Range , ĐΜŦ Autobot is designed to identify spots in the market that offer suitable scalp and swing trade opportunities.
Due to popular demand we have expanded our ĐΜŦ Autobot product line to include the new ĐΜŦ Autobot Dragonfly 3-6-9 Edition which combines DMT with 3-6-9 Vortex mathematics, our Titan indicator and a multi-ladder scalping strategy to ensure you maintain a preferable average entry when price action moves against your position.
Indicator View
It its default state the DMT Autobot Dragonfly indicator displays key signal information, such as:
• Support & resistance range lines
• Titan Body Small & Large Time Frame lines
• Long & Short entry positions
• Long & Short position ladders
• Profit targets
Dragonfly displays a range between resistance (upper line) and support (lower line) on the chart.
Once the price is granted support in the range the lower line will turn green. As price action develops it will make repeated attempts to test support. If support holds price will attempt to test the resistance line (red).
When resistance is broken and the price is above the upper line, the line will turn blue confirming the bullish momentum and provide a potential buy opportunity.
Price action will make attempts to test the upper line as support and will keep rising while support is granted.
Once support is lost the upper line will become red once more. As price action develops it will make repeated attempts to test resistance. If resistance holds, the price will attempt to test the support line (green).
When support is broken and the price goes below the lower line, the line will turn red confirming the bearish momentum and provide a potential selling opportunity.
Price action will make attempts to test the lower line as resistance and will keep dropping while resistance is granted.
Titan Body
The Titan Body Small & Large time frame options in the indicator add additional trendlines to the chart to provide further clarity and confirmation to the Support & Resistance range indication.
Once price is granted support by the Small Time Frame trend line the line will turn green. As price action develops it will make repeated attempts to test the Small Time Frame support. Once the price is below the Small Time Frame trend line , the line will turn red and can act as resistance in a trend reversal.
When price is granted support by the Large Time Frame trend line the line will turn cyan. As price action develops it will make repeated attempts to test the Large Time Frame support. Once the price is below the Large Time Frame trend line , the line will turn orange and can act as resistance in a trend reversal.
The Titan Body enabled and customized in the indicator’s style settings,
Alert indicators
DMT Autobot Dragonfly Edition generates signals that can be used to scalp trade a volatile asset.
Signals are enabled and customized in the indicator’s input settings Additional options can be found in the options, but it is recommended that these are left at the default, as shown below. The indicator generates many
Entry and Profit levels can be disabled or customized in the indicator’s style settings,
Tradingview Alerts
Using Tradingview alerts, DMT Autobot Dragonfly signals can be used to trigger a trading bot.
To trigger a long or short position, set the Tradingview Alert Condition to DMT 369 Dragonfly and select the long or short option.
It is recommended that long or short positions are configured to trigger Once Per Bar Close
Ladders can also be triggered using alerts. To trigger a ladder order, set the Tradingview Alert Condition to DMT 369 Dragonfly and select the appropriate Long or Short ADD option that is to be triggered by the relevant values defined in the indicator’s configuration.
It is recommended that ladder orders are configured to trigger Once Per Bar,
To trigger a take profit order, set the Tradingview Alert Condition to DMT 369 Dragonfly and select the Long or Short TP option that is to be triggered by the relevant values defined in the indicator’s configuration.
Take profit orders can be configured as Once Per Bar Close or Once Per Minute.
If you wish to trigger a take profit signal immediately when the indicator’s defined take profit value is achieved, then use the Once Per Bar option.
Selecting Once Per Bar Close to generate a take profit signal is a gamble as the candle may close far away from the defined profit target – positive or negative.
While stops can be used, they are not applicable to the recommended ladder strategy.
Ladder Strategy
The DMT Autobot Dragonfly indicator always turns an underwater position into a win by utilizing a ladder strategy.
By using the recommended defaults, the indicator will trigger ladder orders at 3%, 6% & 9% using increasing order sizes,
Order sizes increase exponentially to ensure a good average price is maintained. If you are not using DMT Autobot Dragonfly signals to trigger ladder or take profit orders, please ensure your trading bot is configured to recalculate the new ladder entry and profit target based on the new average position entry price as each ladder is filled.
If you are using DMT Autobot Dragonfly on a leveraged asset, please ensure the leverage position is configured suitably so that your position is not liquidated if the price rapidly moves against you.
If u are looking for more information or access to the script please private msg me in trading view chat thx for support

Multi Time Frame Buy&Sell V4.0 [ALERTSETUP]Hi guys,this indicator Developed for Intraday and multi Time Frame Trading. Note: Invite only Script.Request to me Access permission to test this.
*** THIS IS STUDY VERSION ***
Time Frame : can use for 15 min / 30 min / 1h / 4h time
15 min configuration is best result for bitcoin and ethereum .
This can be used : Crypto Currency/ Bitcoins / ethereum ,Forex,currencies ,Index ,Commodity Gold / silver , Oil Market and in Equity / Futures
ETHUSDT Futures 15min
BTCUSDT Futures 15min:
GOLD /USD FOREX 15min:
HOW IT WORKS:
this indicator analyze EMA&SMA support and resistance then combine with pivot point and fibo levels is used to calculate the signals.and finally show entry label on
chart with target point and stop loss
HOW TO USE:
Creating a signal is as simple as adding the indicator called to your chart(buy or sell)label and background color change ( green=buy / red = sell)
green line is target and black line is stop loss.
in top of setting page you can see noise filter option . that can change it to get better result and reduce noise. in setting can set 3 target level and stoploss
NOT:all information show to info panel in chart.
strategy tester : enabled .All you can test this in live market in any segment.
NOT: can to change noise filter in setting setup until to get best result.
Choose any Date Month Year to Current Date and check the results below in the Strategy Tester.
REPAINT/NO REPAINT : No Repaint ,entery labal(buy or sell) and Background Color wont change. In the current candle position wait for the candle to close to see the
stability.
"Set alert": Select "Once per bar close" for your alert options.
There are 5 alerts:
- BUY
- SELL
- BUY OR SELL (for free TV users)
- take profit
- stop loss
To Get access - Send me a private chat message in tradingview.com to get access.Or request in comment section below.
Review and Feedback.Thank you!
Any issues report to me to Fix.Thank you!
Use the link below to obtain access to this indicator:

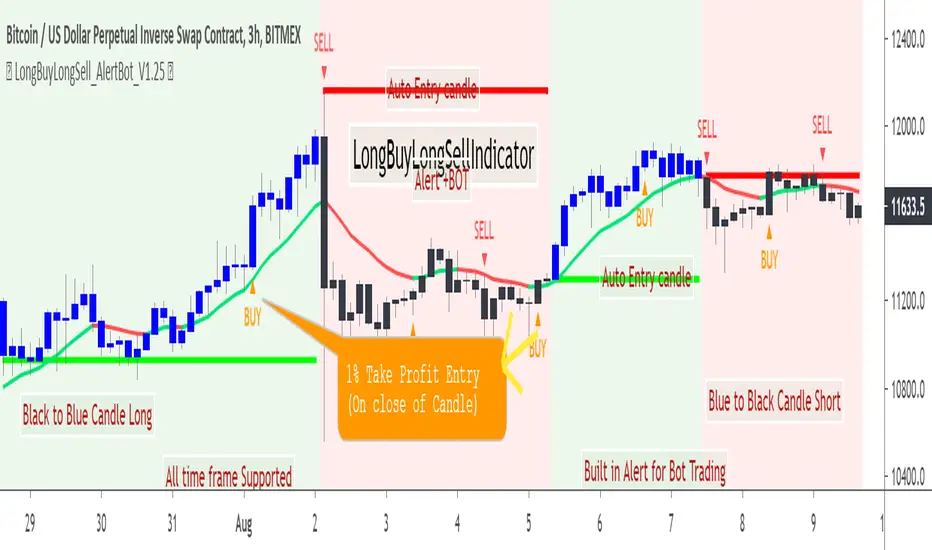
LongBuyLongSellIndicatorHello Friends,
Here is one more very simple to use LongBuyLongSellIndicator for trading. Details are given above in the chart.Happy trading.
This indicator can be used for very long term trading in any time frame. This is designed to avoid many noise in between the trade.
This indicator does not require any additional indicator setup ;as like traders do in price action trading ,just need to follow the colors for trading .
Always remember Black to Blue transition BUY (or cover the short position)
Blue to Black transition SELL(or cover the buy position)
Do not trade in the middle and ignore other colors if appear in the chart
Other Indicator that may be useful:
BUY2SELL2BUYindicator
SELL2BUY2SELLindicator
ProfitCandleBillionWayIndicator
Access is through invite only