Trend Following with Bollinger BandsThis is a trend following system which uses the Bollinger Bands instead of the Donchian Channels.
Long position:
* Price closes above the middle line.
* The fast EMA (in this case the 40) crosses over or is above the slow one (in this case the 120)
Short position:
* Price closes below the middle line.
* The fast EMA crosses under or is below the slow one.
Stoploss:
* 4 ATRs away from the price.
ATR

Trend Following with Donchian Channels and MACDThis is a trend following system based on the Donchian Channels. Instead of using a simple moving average crossover, this system uses the MACD as the trendfilter:
Long positions:
* Price makes a new 50 day high,
* The MACD-line crosses above or is above the Signal-line.
* Both the MACD and the Signal-lines are above the zero-line.
Short positions:
* Price makes a new 50 day low,
* The MACD-line crosses below or is below the Signal-line.
* Both the MACD and the Signal-lines are below the zero-line.
Stoploss:
The initial and the trailing stoploss are 4 ATRs away from the price.

Best Strategy on TradingView? (Maybe)Best is quite a broad adjective and can be interpreted in many ways.
Does this strategy produce the best net profit on everything it trades compared to every other strategy? Probably not.
Does this strategy have the highest profit factor compared to every other strategy? Probably not.
However, in terms of all in one packages that are easy to implement and understand, while providing great results on most assets on most time frames... Is this the best strategy on TradingView? Maybe!
This strategy provides enough flexibility to be completely customised to each users trading needs, while being based on strategy logic that is so broad, so time tested and not overfitted - that it can be used by everyone on anything.
The strategy is fairly simple, MA ribbons, and the ATR. Seriously that's pretty much it. For momentum and trend based trading what more do you need! I've tried adding multitudes of other indicators, fundamental factors, technical tools etc. But after all that, this simple combo provides the best and most rounded results across the board.
I've tried to make the UI simple and intuitive so all users can load up and go and feel like they understand everything that is happening - but if anyone has any questions please do not hesitate to ask!
Also, if you find some great settings on something, share your results in the comments!
Have any ideas how this can be improved? Again, just let me know!
I hope you enjoy and I hope this helps with your trading & investing.

Hull MA TimeFrame CrossOverHello traders,
Although this strategy is configured on BTCUSDT , with a changing of settings, it can be used on any trading instrument.
Here it is seen, on the 2 hour chart. With Trading Fees included in result (adjust to suit your exchange fees).
The candle crossover is set to Daily timeframe.
That means that the Candle crossover is going to see if todays price is higher than yesterdays price.
If user sets this to 4 hour timeframe, the candle crossover would be when price is higher than the the price 4 hours ago...
The rest is simple, a moving average to detect direction, and an ATR StopLoss (if activated).
There is StopLoss and Take Profit settings which work by percentage.
The periods of the moving average and the ATR can be adjusted, as can the TP % and SL %.
The price is taken from the CLOSE or the OPEN or OHLC4 etc... which can be changed in the settings. OPEN is recommended to avoid repainting.
The moving average also has selectable types (ALMA,SMA,EMA,WMA,HMA)
So if the Price is above the Moving average, and the moving average is above the alternate timeframe value, then a buy is activated
if the Price is below the Moving average, and the moving average is below the alternate timeframe value, then a sell is activated
if OPEN is selected as Price source, then the alternate timeframe value would be the OPEN of the alternate timeframes candle.
the values are all plotted on chart so user can see what is happening when what crosses over what, and then what changes when settings are adjusted.
Have FuN!
if this strategy brings you the epik win......
.... dont forget about me
seaside420 ❤️

DMI (Multi timeframe) DI Strategy [KL]Directional Movement Index Strategy
Entry conditions:
- (a) when DI+ > DI- on timeframe #1, and
- (b) Confirmation: when DI+ > DI- on timeframe #2
In the shown example, timeframe1 was same as the chart (1H) and timeframe2 was 1D.
Stop Loss: ATR based trailing stop
About DMI
Can refer to Investopedia for general understanding.
Applications of DMI in this strategy:
- Assumes uptrend when DI+ is above DI- (when green DI+ lines above red DI-), vice versa for downtrend. This is checked in two different timeframes that can be set by user in settings.
- DX is ignored, it doesn't give a direction of the trend. But if DX was applied, it would be a good indicator for quantifying the strength of uptrend/downtrend. This measurement would typically be read along a threshold (i.e. if below 20, then market is likely consolidating). All of these have been commented out (ignored by pinescript's interpreter via //) in the codes, as said; we are not using DX for sake of simplicity.
Visualizations
To make the chart look cleaner, DMI plots have been simplified to just down/up arrows placed at bottom of the chart.
Referring to the example chart:
- Green arrows : when DI+ > DI- for both timeframes, implies uptrend
- Red arrows: other way around (DI+ < DI-), implies downtrend

DC Breakout Strategy | This is simplicity at its finest.As the title already describes: this is a Donchian breakout strategy. This strategy, as of now, only goes long. It goes long when the price close makes a new high and the 8 day moving average is above the 32 day moving average. The strategy exits the trade if the price breaks the atr trailing stop of * 3 or the 8 day moving average crosses below the 32 day moving average.
This is simplicity at its finest.

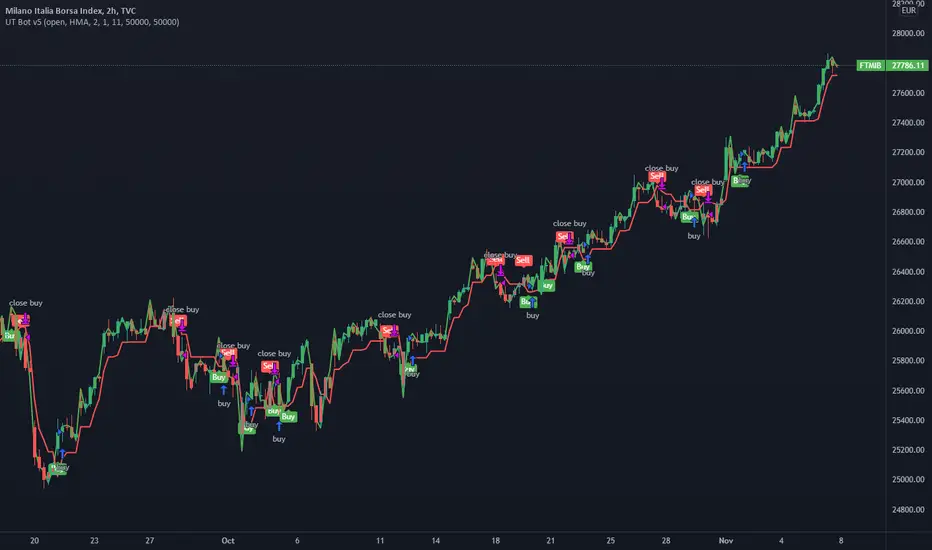
UT Bot v5This is an update by request, on someone elses strategy! well more of an edit, but also update from pine v4 to pine v5.
//CREDITS to HPotter for the orginal code. The guy trying to sell this as his own is a scammer lol.
//Edited and converted to @version=5 by SeaSide420 for Paperina
The UT Bot v5 is Movinging average (the MA) vs ATR (the ATR is in the form intended for use as trailing stop loss (ATR_TSL))
Entry logic:
buy = the MA > ATR_TSL and Price > ATR_TSL
sell = the MA < ATR_TSL and Price < ATR_TSL
The Moving average type can be changed in the settings:
options = "SMA", "EMA", "WMA", "HMA"]
the edits i made were:
convert to v5
Add TP and SL
Add Buy only or Sell only option
Add MA type option
Add price source option
Draw MA and ATR_TSL on-chart
DI Crossing Daily Straregy HulkTradingSimple strategy based on crossing DI+ and DI- and Average True Range.
Long entry when DI+ crossover DI-
Short entry when DI+ crossunder DI-
Stop Loss and Take Profits based on Average True Range.
Default values are 1*ATR(14) for stop loss and 2*ATR(14) for Take Profit.
Risk reward 1 to 2 ratio.
Recommended default values, but you can change it if you want.
Recommended timeframe - 1D.
Script was tested on BTCUSDT pair and have a 2.4 profit factor.

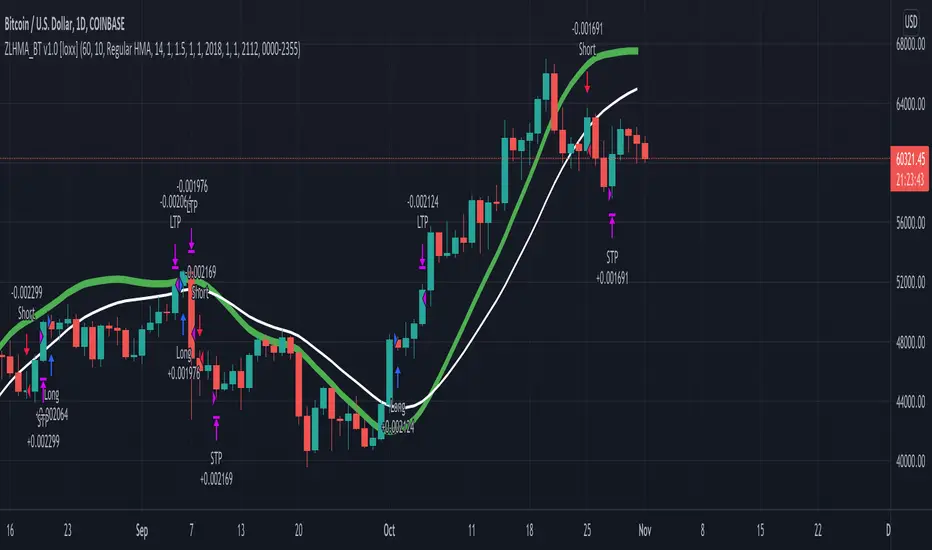
Zero-Lag HMA Backtest v1.0 [loxx]This backtest compares profitability differences between a regular Hull Moving Average ( HMA ) and a Zero-Lag HMA .
Things to know:
- Profit is set to 1 ATR
- Stop-loss is set to 1.5 ATR.
- This is by design to test the minimum the profit scenario (1 ATR up) and the worst case loss scenario (1.5 ATR down) for momentum trading. Actual results vary when additional TPs are added
How to use:
- Adjust settings and dates to view different market structures and position scenarios
- See results in the "Strategy Tester" pane
Conclusions and what's next
- Modifying HMA does very little to improve backtest results
- Future iterations will include options to backtest various moving averages with additional modifiers to improve profits and avoide losses
Comment below or send a PM with questions, comments, observations, or concerns.
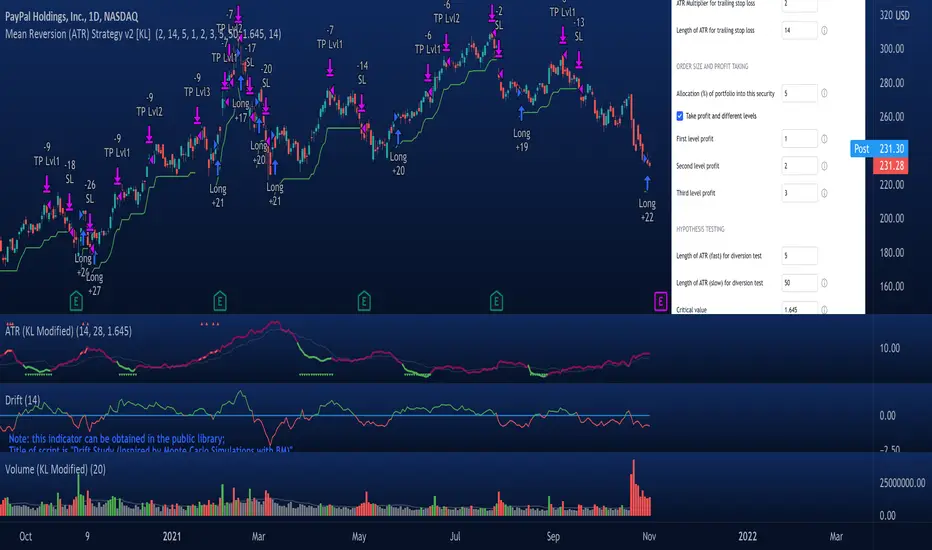
Mean Reversion Strategy v2 [KL]Description :
This strategy will enter a position when the following conditions are met:
a) Main signal: When source data (ATR) diverts from its moving average value, and
b) Confirmation: If predicted direction of trend is favorable.
Assumptions :
During periods of high price volatility, ATR diverts from its moving average value. Eventually, ATR should revert. But since just knowing the magnitude of increase/decrease of ATR does not indicate a trend signal, we need to introduce a model to predict the current trend.
In short:
• Trend Prediction : This strategy calculates the expected logarithmic return of the security (the "Drift") and considers prices to be moving in uptrend if the drift curve is upward sloping.
• Assessment of ATR diversion : To determine "yes/no" regarding whether ATR at a given point in time has diverted, this script conducts a two-tailed hypothesis test at each candlestick period. The null hypothesis (H0) is that the fast moving average value should equal the slow moving average value (say, denoted as H0: atr14 == atr28; it is assumed that atr28 is more meaningful for the purpose of describing the current trend because it has a larger sample size). Investopedia has an article summarizing this topic .
Exit Condition :
When trailing stop loss hits.
Previous version :
This strategy is based on Version 1 published back in September . This older version considers +/- one standard deviation to be the critical values relative to average ATR when testing whether ATR has diverted from the mean. This does not take Standard Error ("SE") into account. As a result, the threshold is often too wide and it generates too many entry signals.
Simple Ema_ATR Strategy HulkTradingSimple EMA strategy, based on ema55+ema21 and ATR(Average True Range) and it enters a deal from ema55 when the other entry conditions are met
Basically long and short conditions
If long:
1) close must be less than open (because we are searching for a pullback)
2) emaFast(21) must be bigger than emaSlow(55) - for a trend detection
3) Difference between emaFast and emaSlow must be greater than ATR(14) - for excluding flat
For short conditions are opposite
Stop levels and take profits, based on ATR multiplier.
You can change it in input field.
I recommended values between 1 and 4, not more.
This strategy was tested on pairs BTCUSDT and ETHUSDT and have a nice results.

TripleEMA + StochasticRSI + ATR Scalping Strategy by TradeSmartCOINBASE:BTCUSD Hello everyone and welcome to our second script release!
This script is one of many upcoming scripts. This one is a test for us, how it works, how you guys like this kind of stuff, and for feedback what we should change/improve at.
So feel free to comment any suggestions you have.
SCRIPT IS OPTIMIZED FOR:
BTC/USD (Coinbase) 15 minute timeframe
(Keep in mind default settings does not include trading fees, you can set it at the properties)
I recommend using this script on a trading exchange where the fees are extremely low or on an exchange where you get paid to place limit orders.
(I am not a financial avdvisor and none of this is financial advice.)
Now you can modify the following:
Stochastic RSI
3 different EMA
Length of ATR (for stop loss and take profit)
Stop Loss and Take Profit Risk to Reward ratio
Choice between Capital Risk on each trade or Risk of % of Capital
Allowing Short/Long entries only
Limit between dates
Trading days 1-7
We will update the script with more and more features taking in consideration your requests.
Hope you like it! Don't forget to let us know what we should change or improve. Thanks, and have a great day!
STRATEGY ENTRY RULES
LONG
When EMAs are lining up (meaning for ex. 400 < 13 < 7), and the Stochastic RSI crosses upwards (meaning blue line crosses orange upwards), then go long.
SHORT
When EMAs are lining down (meaning for ex. 7 < 13 < 400), and the Stochastic RSI crosses downwards (meaning blue line crosses orange downwards), then go short.
TAKE PROFIT
When price hits the exit price (calculated from stop loss with the risk ratio)
STOP LOSS
When price hits stop loss then exit the position.
QUANTITY TO BUY (Risk per Trade % or Capital %)
Risk Per Trade % attribute: we can set how much money we want to risk on one trade. Meaning that if we lose that particular position, then a Risk Per Trade % value of our equity will be lost.
Example: if you set the Risk Per Trade % to 1 % and you have a 100$ account balance, then if you loose the trade you will loose 1$ max.
Capital % we can set with how big % of our capital we want to enter into a position. Meaning that we enter with a set % of our capital.
Example: if you set the Capital % to 1 % and you have a 100$ account balance, then you will enter the position with 1$.
First Release Settings: (2021-10-25) for BTC/USD (Coinbase) 15 minute timeframe
Stochastic RSI settings: (Not displayed in the script. If you want to see it you have to add it separately.)
K: 3
D: 2
RSI Length: 6
Stochastic Length: 16
RSI Source: hlc3
EMA 1: 5
Source One: Close
EMA 2: 12
Source Two: Close
EMA 3: 215
Source Three: Close
Length of ATR: 16
Stop Loss Multiplier (risk): 3.6
Exit Price Multiplier (reward): 1
Risk Percentage: 3
Allow Long Entries: yes
Allow Short Entries: yes
Valid Trading Days: 1234567
The valid trading days of the Limit Trading Time feature. Numbers represent the days: Sunday (1), Monday (2), Tuesday (3), …, Saturday (7)
If you like this one, follow for more scripts! Thank you for your support!

MACD-Extendido-Estrategia por Neil--------------------------------
MACD-Extendida-Estrategia
--------------------------------
DESCRIPTION
Resource that identifies entry and exit operations using the indicator
Average Convergence and Divergence Movements ( MACD ) and 5 strategies
INTERESTING
Novel strategies are implemented such as:
1. Overbought and oversold band to avoid horizontal movements
2. Control inputs and outputs at positions opposite the histogram line
3. Make a profit (take profit) without prior purchase orders
HOW DOES IT WORK (STRATEGIES)
1) Overbought and oversold:
Allows you to define an overbought upper band
Allows you to define an oversold ower band
Operations that occur within the band are ignored
2) Place of next operation (either side):
Indicates that the next operation can occur on either side of the histogram
3) Place of next operation (opposite side):
Indicates that the next operation must occur on the opposite side of the histogram
4) Take profit:
It allows defining the deviation in favor to execute a take profit.
It does not place a buy order at a distant point, instead it looks back and if the shift meets the expected deviation, take profit is executed
5) Loss control (stop loss):
It allows to define the deviation against to execute a stop loss.
It does not place a stop order at a distant point, instead it looks back and if the displacement meets the expected deviation the stop loss is executed
How to use it:
Press the "Indicators" option, go to the "Public Librarian" segment, write the name "MACD-Extended-Strategy by Neil", double-click on the record in question and you will have it added in your work panel, now, just It remains to be used to identify the inputs and outputs and you can do it visually or by defining the automatic notification alerts.
--------------------------------
MACD-Extendida-Estrategia
--------------------------------
DESCRIPCION
Recurso que identifica operaciones de entradas y salida haciendo uso del indicador
Media móvil de Convergencia/Divergencia ( MACD ) y 5 estrategias
NOVEDADES
Se implementan estrategias novedosas como:
1. Banda de sobrecompra y sobreventa para esquivar movimientos horizontales
2. Control de entradas y salidas en posiciones contrarias a la línea del histograma
3. Toma de ganancias (take profit) sin ordenes de compra previa
COMO FUNCIONA (ESTRATEGIAS)
1) Sobrecompra y Sobreventa:
Permite definir una banda superior de sobrecompra
Permite definir una banda inferior de sobreventa
Operaciones que ocurren dentro de la banda son ignoradas
2) Lugar de próxima operación (cualquier lado):
Indica que la próxima operación puede ocurrir en cualquier lado del histograma
3) Lugar de próxima operación (lado opuesto):
Indica que la próxima operación debe ocurrir en el lado opuesto del histograma
4) Toma de ganancias (take profit):
Permite definir la desviación a favor para ejecutar una toma de ganancia.
No coloca una orden de compra en un punto distante, en su lugar mira hacia atrás y si el desplazamiento cumple con la desviación esperada se ejecuta la toma de ganancia
5) Control de pérdida (stop loss):
Permite definir la desviación en contra para ejecutar una parada de pérdida.
No coloca una orden de parada en un punto distante, en su lugar mira hacia atrás y si el desplazamiento cumple con la desviación esperada se ejecuta la parada de la pérdida
Como usarlo:
Presione la opción "Indicadores", ubíquese en el segmento "Libreria Publica", escriba el nombre "MACD-Extendido-Estrategia por Neil", haga doble clic sobre el registro en cuestión y lo tendrá agregado en su panel de trabajo, ahora, solo resta usarlo para identificar las entradas y salidas y puede hacerlo de forma visual o definiendo las alertas de notificación automática.

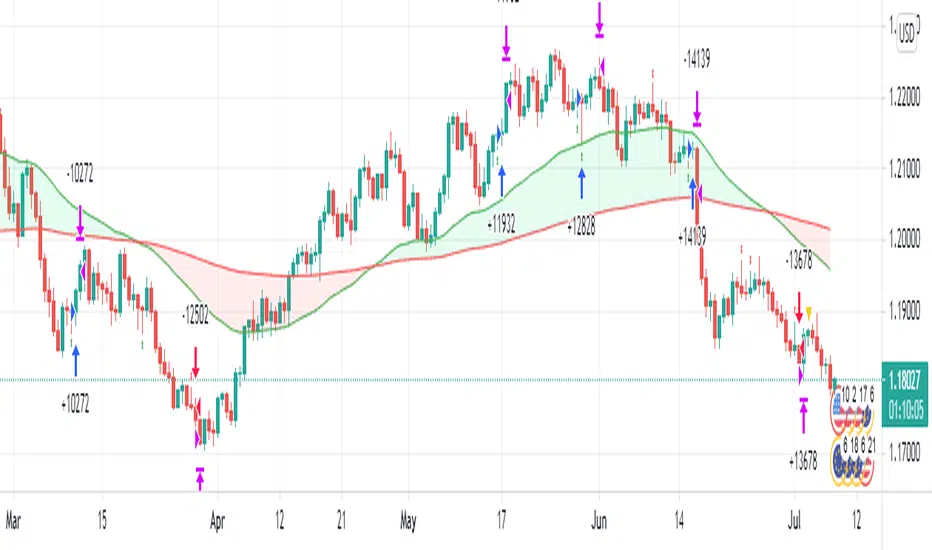
Av3Based on the ANNE EA v3 for MT4. For use on FOREX.
if ATR is greater than ATR average taken from last 5 candles, then market considered as trending, and so Open(0)>Close(1)=buy Open(0)Close(1)=sell Open(0)

Rosebud Trend Backtest [DepthHouse]*Past Performance Does Not Guarantee Future Results*
*Strategy created for backtesting purposes only.
*Backtesting assesses the viability of a trading strategy or pricing model by discovering how it would have played out retrospectively using historical data.
* Please be sure to read all updates below as the information below could change with future updates.
Rosebud Trend Indicator uses complex range calculations to easily detect trend changes, critical support and resistance levels, and even aid in spotting reversals. The Critical Support & Resistance Zones are plotted via the red and green cloud. This cloud not only visually displays the expected trend direction but often acts as major support and resistance zones. The outer band measures the expected range in which the assets trade over longer periods of time.
The Rosebud Trend Backtest combines the calculations of the ATR Auto Oscillator & the Rosebud Trend Indicator to demonstrate backtest performance.
// Settings //
Users can switch the ‘ Trend Sensitivity ’ between ‘ Low ', ' Med ', and ‘ High ’ to increase or decrease the rate at which the cloud changes.
By altering the S/R Band Thickness users can furthermore increase or decrease the rate at which a trend changes by altering the thickness of the cloud. Default is .50 however this can be lowered if needed.
Bar colors are generated by a combination of Rosebuds primary function and our ATR AUTO Oscillator base functions. Users have 3 bar color options to select from: Simple, Complex, and Off.
Simple: Bars colors alternate between shades of red and green based on the trend direction and the ATR Auto strength. The stronger the shade, the stronger the trend.
Complex: This adds a few extra variables to the script which generates a more complex bar color display. Using this option, Rosebud will generate light red bars in a bull trend if downward movement is strong and vice versa in a bear trend. It also will generate a purple bar if the candle successfully closes above or below the Top & Bottom Range Bands; We call this a range break, and it could be an early sign of strong upward or downward movement.
Off: In case you like to keep things even simpler, this option hides all overlay bar colors.
ATR Options: Used for Light & Strong Entries/Exits // Bar Colors also based on these settings
ATR Smoothed Signal Option: Turns advance smoothing on or off. On will reduce signal noise, while Off could land you that perfect bottom signal with a lower success rate.
ATR Candlestick Length: Default factor for bar color and shape generation, the higher the number the fewer signals that will generate.
ATR Candlestick Smoothing: Default smoothing for the Candlestick Length
Signal Lookback: Adjust the factor at which Bull, Bear, Up, and Down. Lower this to 2 for more signals.
// ⇅ BackTest Settings ⇅ //
Short Trading: Option to see backtest results for both long and short positions. Default is Long Only.
Strategy Entry Options:
Trend Only: Positions are entered right as there is a cloud trend change.
Light Entry: This enters a trade as soon as there is a breakout or breakdown signal generated from the ATR settings.
Strong Entry: Multiple conditions must be met; Price action must be near the Trend Base and must receive either a bullish or bearish crossover in the oversold or overbought range of the ATR Settings.
Strategy Exit Options:
Trend Only: Exits all positions after there is a primary trend change.
Light Exit: Exits a user set percentage of open positions when the ATR generates a breakdown or breakout. Will continue to do this at each occurrence. Presets are built in to keep these from triggering too often in volatile conditions.
Strong Exit: Exits a user set percentage of open positions when the ATR generates a bullish or bearish crossover in the overbought or oversold ranges. Will continue to do this with each occurrence. Presets are built in to keep these from triggering too often in volatile conditions.
Profit Points: Exits a set percentage of the position up to 3 times at a user set percentage gap from the entry. Any remaining amount in the position exits upon a trend change.
Profit QTY Percent: Percent of the position to exit when an exit condition triggers. This does not apply to the “Trend Only” exit option.
Profit Percent Gap: Percent gap for Profit Point Exits. Recommend adjusting based on timeframe. See example below.

Kifier's MFI/STOCH Hidden Divergence/Trend BeaterMFI/STOCH Hidden Divergence/Trend Beater
General Idea:
My premise around this strategy was to make a general strategy for crypto that would help out with finding entry positions for when you’re bullish on a crypto and want to hold on for a while, and at the same time avoiding massive drops. Essentially a way to mix long term/ swing trading; I somewhat achieved my goal however it still requires a lot of logic tuning of the trend averages.
I’m a huge proponent of volume indicators and coupled with average closing price, I think this gives a really good idea of what is happening with the market. It gives an idea on the market and retail investor sentiment. This generally gives you logical entry positions (Although I don’t know how amazing that will work with all cryptos, there’s a fine line between a good strategy and one that just rides bubble market conditions, some would argue that’s still a success and others not)
How it works:
There are many components to the strategy that try to do different things:
First of all there are two types of entries, a MFI hidden divergence with a STOCH check, essentially it will only fire when a divergence is detected while STOCH is above 50%, however this might be changed in the future as due to the volatile nature of cryptos, the STOCH is not too effective. The second entry is a simple MFI/STOCH trend, if STOCH is above 50% and the trend is detected to be in a trending long, once a MFI crossover over the 50% line is detected an entry is placed, this is designed to get out profit where the divergence would otherwise be less accurate during strongly trending conditions.
-MFI is a great indicator, as a volume weighted momentum indicator I find it the most accurate of all, the STOCH however is a great indicator to get a general picture of simple market conditions and can filter out the emotional noise of retail investors.
-VWMA and an SMA (The bottom oscillator) gives an idea of the trend tacking into account of the volume, this serves as a more short term filter of the trend for filters.
-OBV checks are done between the OBV and an EMA of the OBV, to get the idea of a volume weighted long trend, which is important for crypto as there are massive rallies to go up due to retail greed, it’s great to jump onto it at the beginning, and get off before the stack of cards fall apart.
-ATR is used to detect when the market is relatively just ranging or moving sideways, which is where the hidden divergence entries are done, during predictable and profitable market conditions.
- Stop loss is based on the closest support of the entry, this is a nice medium of room to breath but also an actual stop loss.
Future plans and improvements:
Currently there’s a lot I want to improve, mostly the divergence detection and the overall sharpe ratio could be much better, but the current value of 0.5 gives me hope that the strategy is onto something. I also want to change TP from a percentage stop to something more dynamic but that might be too optimistic. The current plan is to paper trade test this either by manual or by a python bot, to see how it performs with some user input as well.

hammerCandle & starCandleIn this scrip we have combine Pinbar Candlesticks calculated using Fibonacci, the bullish hammer candlestick and bearish star candlestick with EMAs and ATR.
I have used 12 Hour time frame which works well EUR/USD, this script works well on higher time frames such as Daily, 12 hours etc.
I have used 1.5 times the ATR as the stop loss and 1 times the ATR as the take profit as these risk to reward ratio gives us the best results for the 12 hour time frame for EUR/USD. Past result are not a prove of performance of the future.
I have added 1 for slippage and 1 for commission.
This script contains AutoView syntax and is fully automated if you connect TradingView to AutoView and a broker, prefebly Oanda.
This script uses two exponential moving averages for trend detection and Average True Range , ATR for stop loss and take profit targets. All of these setting are adjustable.
We only trade with the trend if the 50 period exponential moving averages is above the 200 period exponential moving averages, if a hammer candle is formed for entry.
Likewise with sell trade if a star candle is formed for entry and if the 50 period exponential moving averages is below the 200 period exponential moving averages.
This script does not trail your stop loss as I have noticed it does not give me good results. Stop loss is a fix stop loss based on Average True Range and so is the profit target.
This script has risk management, it risk a certain percent of the inputted capital amount in the setting. See settings for more details.
Note: Due to auto risk management this script only works on Forex.
Green line is 50 period exponential moving averages and red line is the the 200 period exponential moving average . Blue line is stop loss for long trade and black line stop loss for short trade.
Please trade at your own risk, all the setting in the script are adjustable for you to test before trading.
Many Thanks,
Honet Trader
RSI Strategy w/ Trailing SL / TP Optimized for Crypto [Strategy]This strategy is designed to use the RSI and EMA filters. A 200 period EMA is used for short / long filters, and the 50 period EMA is used to determine the direction of the short term trend.
In addition, the script uses "rate of change" for the fast EMA (trend), volume , RSI (momentum), and price (volatility) and only takes trades when all are in optimal conditions.
I.E., the EMA is in an uptrend, the volume is increasing, price is in an uptrend, and the RSI is in an uptrend, so we will place a Long trade.
This strategy uses EMAs as a trailing stop loss and take profit. As this is a trend following strategy, the idea is to maximize profits when correct and minimize losses when
wrong.
It was designed specifically using crypto pairs, and was optimized for the 10 minute chart.
My goal was to get the best use out of the RSI indicator. I was originally an MACD fanboy, but have recently converted.
Want to help me improve this code or strategy? Have suggestions for improvement? Leave them in the comments below.
Thanks for using my script! I hope it works well for you and good luck in the markets.
If you have any questions, please leave them in the comments and I'll do my best to respond.
This script does not repaint as it only relies on close data to make a decision to enter a trade.
How to use this strategy:
___________________________
Enable Long Entries? - Used to enable or disable the strategy from executing long entries.
Enable Short Entries? - Used to enable or disable the strategy from executing short entries.
How Many Bars To Look Back for Hi/Lo: - This is used for the Stop Loss and Take Profit targets. An integer of bars is used to look back and calculate the values.
RSI Length (Rec: 8) - The length of the RSI
Source - The RSI Source
Use Slow EMA? - If checked, a 200 period EMA will be used to filter entries long or short (only take shorts when the price is below, long when above). In addition, the script will close any trades that cross the 200 period EMA. By default this is disabled.
EMA Slow - the period of the Slow EMA (200 by default)
EMA Slow Src - what to use to calculate the Slow EMA (high by default)
EMA Fast - The Fast EMA (50 period) is used to calculate the direction of the short term trend. This also factored into the Rates of Change.
EMA Fast Src - what to use to calculate the Fast EMA
ATR Length - If used, the ATR length is used to calculate the Stop Loss and Take Profit targets.
SL Multiplier - The distance away from the initial value to multiply the Stop Loss
TP Multiplier - The distance away from the initial value to multiply the Take Profit.
Use EMA as SL / TP? - If true (default) a 3 period EMA is used to calculate Stop Loss and Take Profit targets. Else, an ATR is used to calculate these values.
Stop Loss / Take Profit Offset - Default: 3 - this is used to shift the EMA / ATR Stop Loss and Take Profit lines to the right X bars. This is to ensure that they are hit properly and not exceeded.
Short Len Vol - Use to calculate the volume of the short length, used in rate of change calculations
Long Len - Use to calculate the volume of the long length, used in rate of change calculations
RSI Long Entry Val - Minimum RSI crossover value to enter a trade Long. If the RSI is below this value, trade entries are not valid.
RSI Long Cutoff Threshold - Long entry RSI value cutoff to no longer enter trades. If the RSI is above this value, trades entries are not valid.
RSI Short Entry Val - Minimum RSI crossover value to enter a trade Short. If the RSI is above this value, trade entries are not valid.
RSI Short Cutoff Threshold - Short entry RSI value cutoff to no longer enter trades. If the RSI is below this value, trades entries are not valid.
ROC Fast EMA - Calculates the rate of change between the Fast Ema now and 'X' bars ago. For a long entry, a positive value is needed, and for a short entry, a negative value is needed.
ROC Price - Calculates the rate of change between the most recent price close and 'X' bars ago. For a long entry, a positive value is needed, and for a short entry, a negative value is needed.
ROC RSI - Calculates the rate of change between the RSI now and 'X' bars ago. For a long entry, a positive value is needed, and for a short entry, a negative value is needed.
Use Close for SL - Default = Off - If checked, when a candle hits the stop loss, the trade will close on the next candle. If unchecked, the trade will remain open until the candle closes at or beyond the stop loss lines.
Custom Message Boxes - Primarily used for bots, but can be used to also insert your own messages for your trading alerts.

PMax on Rsi w/T3 *Strategy*Profit Maximizer Indicator on RSI with Tillson T3 Moving Average:
PMax uses ATR calculation inside, for this reason users couldn't manage to use PMax on RSI because RSI indicator doesn't have High and Low values in bars, but ATR needs that values. So I personally calculate RSI in a different way to have High and Low values of RSI wrt price bars.
IMPORTANT:
Because of the sudden movements and divergences on RSI , this indicator must firstly optimized for the charts before using. Optimization can be held by users for the meaningful parameters for each chart.
3 parameters are critical when optimizing:
First: Multiplier
Second: Tillson T3 Length
Third: T3 Volume Factor
Says, Kıvanç Özbilgiç. Here's the strategy version for you to backtest & optimize properly.
Enjoy.

StocasticRSI EMAs ATR StrategyA scalping based strategy thats works well with EUR/USD 30 minute time frame.
This strategy uses stochasticRSI for trade entry. Uses two exponential moving averages for trend detection. The strategy uses Average True Range for stop loss and for two profit targets.
We only trade with the trend if the 50 period exponential moving averages is above the 200 period exponential moving averages. StocasticRSI must cross below 30 level by default for a long entry if the rend is up. Likewise with a short entry the stochasticRSI must crossover above 70 level and if the trend is down.
This script does not trail your stop loss as I have noticed it does not give me good results. Stop loss is a fix stoploss based on Average True Range and so are the profit targets.
This script has risk management, it risk a certain percent of the inputed capital amount in the setting. See settings for more details.
Green line is 50 period exponential moving averages and red line is the the 200 period exponential moving average. Blue line is stoploss for short trade and black line stop loss for buy trade.
Since this is a scalping strategy be caution with the commission and slippage. I have inputed 1 for commission and 1 for sllipage.
Many Thanks,
Honest Trader

HMA_ATR StrategyATR with HMA experimental minimalist bot for ETHBTC .
A strategy for use by Automated Algorithm systems.
Different from normal ATR as it uses HMA for smoothing.
Example settings result shown here on chart include commission 0.5%

SMT V11 BY Stock_InshotsHello , i Combined 3 Indicators to generate buy /sell signal
1) Super Trend
2) Simple Moving Average
3) Williams Fractal Indicator.
I thank Trading View to keep all these indicators source code open so i was able to combine and customized as per requirement.
In settings one may change use different period of super trend as well Sma
This works best on 10 min chart.
Buy Setup : after buy signal one can wait for fractal confirmation below the candle and place order above High of that candle with buffer of 0.01% in LTP
or one can place order near to Sma 50 as after Signal as it will come to retest . Reversal Strategy for good Risk Reward Ratio
Sell Setup : After Sell Signal one can wait for fractal Confirmation below the candle and place the order below the low of the candle with buffer of 0.01% in LTP
Note : It may not give good results on Forex better do your on research with different Periods on different time frames
I am not SEBi Registered to advice on your investment. Consult your Financial Advisor before investing on any idea
Please give feedback for Modification/ Suggestions are most welcome.
Thank you trading view a great platform. i am publishing this in protected mode as some ,copy and start selling these type of indicator by invite-only links. i wish to help retailers.
Refer chart for understanding of buy/sell setup
ATR with EOM and VORTEXThis is a strategy, designed for long trends for stock and crypto market.
Its made of ATR for volatility, EOM for volume and VORTEX for the trend direction.
In this case on the ATR, I applied an EMA to check if current position is above the EMA -> bull trend, below ema -> bear trend
For EOM I am using the positive and negative value scale, if its positive we are in a bull movement, otherwise a bear movement.
Lastly for VORTEX, I took the min and max, and made an average, after that I am using the average and compare it with 1 value. Above 1 -> bull, belowe 1-> bear.
This strategy only goes long.
If you have any questions, let me know.
