Average True Range Percentage (ATRP)ATR measures volatility, but you can't compare one instrument vs. another with it because the ATR value will be different depending on the price of the instrument. I went searching for something like ATR but with percentages, so you could compare one stock vs. another to find who is more volatile and found this .
It was exactly what I was looking for, so decided to re-create it in TradingView. Enjoy!
Description
Average True Range Percent (ATRP) expresses the Average True Range (ATR) indicator as a percentage of a bar’s closing price.
How this indicator works
ATRP is used to measure volatility just as the Average True Range (ATR) indicator is. ATRP allows securities to be compared, where ATR does not.
ATR measures volatility at an absolute level, meaning lower priced stock will have lower ATR values than higher price stocks. ATRP displays the indicator as a percentage, to allow for securities trading at different prices per share to be compared.
Calculation
ATRP = (Average True Range / Close) * 100
ATR

Uber Baseline [UTS]Uber Baseline is a highly customizable Baseline component for any trading system. Different strategies can be applied making it a powerful tool for every trader.
General Usage
The Baseline is used as an indication of the prevailing trend and helps keeping the trader out of bad trades.
Price above the Baseline only allows for LONG trades and below Baseline only allows for SHORT trades.
On price cross upwards from below Baseline and and candle close above Baseline the movement can be considered as bullish. Controversy if price crosses Baseline downwards from above and and candle closes below the baseline the movement can be considered as bearish.
Hence, ENTRY Signals for LONG or SHORT can be derived from those Baseline crosses.
Furthermore, any Baseline cross can also be treated as valid EXIT signal for an open position as the movement indicates a possible shift in trend.
Price that moves with unusual high volatility into one direction often tends to not trend but instead pulls back. Overshoot of the base line (default setting: 1x ATR) is recognized but does not produce an ENRTY signal, only an EXIT signal.
Advanced techniques can incorporate the one-candle-rule waiting for pullbacks after Baseline overshot following a possible ENTRY in direction of the new trend.
Trend traders can also look for Baseline bounces after an ENTRY signal for confirmation and better trade entries.
Moving Averages
16 different Moving Averages are available:
ALMA (Arnaud Legoux Moving Average)
DEMA (Double Exponential Moving Average)
EMA (Exponential Moving Average)
FRAMA (Fractal Adaptive Moving Average)
HMA (Hull Moving Average)
JURIK (Jurik Moving Average)
KAMA (Kaufman Adaptive Moving Average)
Kijun (Kijun-sen / Tenkan-sen of Ichimoku)
LSMA (Least Square Moving Average)
RMA (Running Moving Average)
SMA (Simple Moving Average)
SuperSmoothed (Super Smoothed Moving Average)
TEMA (Triple Exponential Moving Average)
VWMA (Volume Weighted Moving Average)
WMA (Weighted Moving Average)
ZLEMA (Zero Lag Moving Average)
A freely determinable length allows for sensitivity adjustments that fits your own requirements.
Trend Visualization
If the predominant trend direction is DOWN the moving average is painted red. If the trend direction is UP the moving average is painted in green.
If the movement is FLAT then the color is gray.
Alerts
Traders can utilize the following signals to trigger alerts from:
Bull Cross
Bear Cross
Overshoot Up
Overshoot Down
Those values are > zero if a condition is triggered.
Alert condition example: "Bear Cross" - "GreaterThan" - "0"

Uber ATR [UTS]Uber ATR is a customizable ATR indicator that measures volatility within a given time frame.
The indicator tells about how much price fluctuates but does not say anything about how much it actually moves into one direction. Use trend following indicators for that purpose.
Option: Exclude Unfinished Candle
Option to exclude the current unfinished candle from price calculation to ignore sudden spikes in price action.
Default caluclation based on candle close:
Exclude unclosed candle option:
Option: Display "Old" Values
Option to step back by candle and display old ATR values in a human readable fashion.
Option: Smoothing Types
NONE (Raw ATR value, no smoothing is applied)
ALMA (Arnaud Legoux Moving Average)
DEMA (Double Exponential Moving Average)
EMA (Exponential Moving Average)
FRAMA (Fractal Adaptive Moving Average)
HMA (Hull Moving Average)
JURIK (Jurik Moving Average)
KAMA (Kaufman Adaptive Moving Average)
Kijun (Kijun-sen / Tenkan-sen of Ichimoku)
LSMA (Least Square Moving Average)
RMA (Running Moving Average)
SMA (Simple Moving Average)
SuperSmoothed (Super Smoothed Moving Average)
TEMA (Triple Exponential Moving Average)
VWMA (Volume Weighted Moving Average)
WMA (Weighted Moving Average)
ZLEMA (Zero Lag Moving Average)

ATR CHANNEL .2Channel based on 100MA & daily ATR / volatility - whole point is to warn and show you where not to participate. Signals can be considered as higher probability trades, short term reversal type scalps - especially effective at FX and stock trading

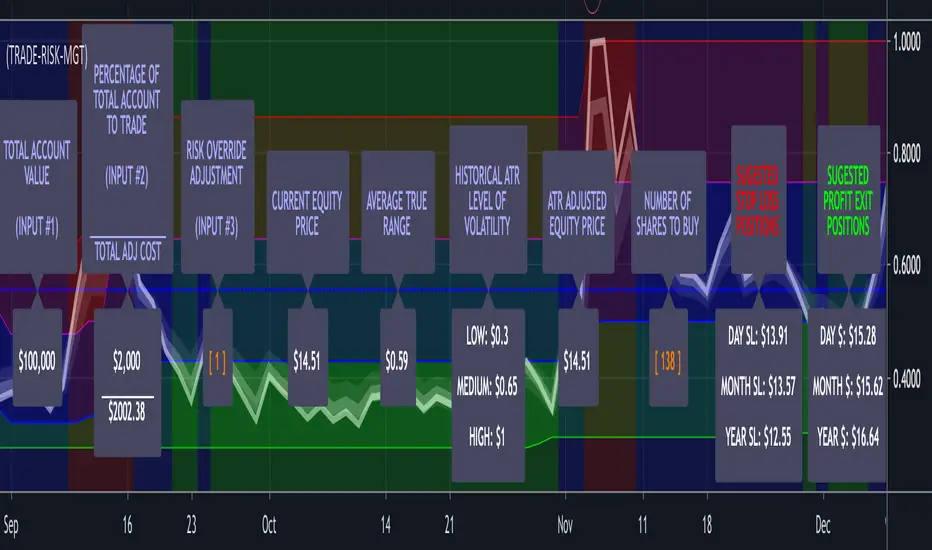
(17) Trade Risk Management VS-427)Trade Risk Management is an Average True Range (ATR) indicator and a Risk Management Worksheet combined. Think widget, spreadsheet or worksheet that calculates how much you should invest in any equity. This enables the trader to very quickly determine the level of volatility of any equity, allowing them to adjust their entry position size based on current and historical volatility . This is a simple and effective risk management tool. The trader only needs to enter the first three label values through the input/styles panel. Historical Volatility is determined via a 60 day/bar look-back for the highest high and the lowest low of the ATR. These two figures are utilized to stratify three background bands (Red = High Volatility; Blue = Median Volatility; and Green = Low Volatility.) The labels are then plotted on the center-line value representing the historical volatility of the equity in question. The label color represents the current volatility of the equity. This indicator is free to any subscriber of any Genie indicator package.
Enter the total value of all of your investments (stocks, cryptos, cash) in input #1 which will then be displayed in Label #1.
You enter the percentage of your account value you are willing to risk on any trade in input #2 which is then displayed in Label #2.
Input #3 allows you to override the built-in risk evaluation based on ATR. Label #3.
Label #4 shows the current equity trading price.
Label #5 shows the current ATR of the equity.
Label #6 shows three levels of historical volatility reflected in the three bands (RED, BLUE, GREEN) shown on the chart.
Label #7 shows the adjusted equity price based on current ATR. If the current ATR is High; Top Red Band, the amount is increased by the (ATR * Risk Factor) Adjustment. Because this increases you're calculated cost basis the number of shares you are indicated to buy is decreased, reducing your exposure to risk in a high volatility/risk environment. If the ATR is Low: Bottom Green Band, the amount is decreased by the (ATR * Risk Factor) Adjustment. Because this decreases your calculated cost basis the number of shares you are indicated to buy is increased because you are in a low volatility/risk environment. If the ATR is neutral: Middle Blue Band, the actual equity cost is utilized and no risk weighting based on ATR is incorporated.
Label #8 shows the resulting change in the price that the risk weighting calculation above had on current price.
Label #9 indicates the recommended number of Risk-Managed-Shares the trader should purchase.
Label #10 indicates the suggested Stop Loss levels and Label #11 shows the suggested Profit Exits Levels.
To further emphasize that the Labels are the Indicator, they get plotted on a line that plots at the center of the current volatility level. If you bring up this indicator and run through one of your trading symbol list, it will enable you to immediately determine exactly what the level of current and historical volatility each of the equities in your list is experiencing.
Additionally, the color of the text on all of the descriptive labels plotted above the center line change color based on the current level of volatility.
Access this Genie indicator for your Tradingview account, through our web site. (Links Below) This will provide you with additional educational information and reference articles, videos, input and setting options and trading strategies this indicator excels in.
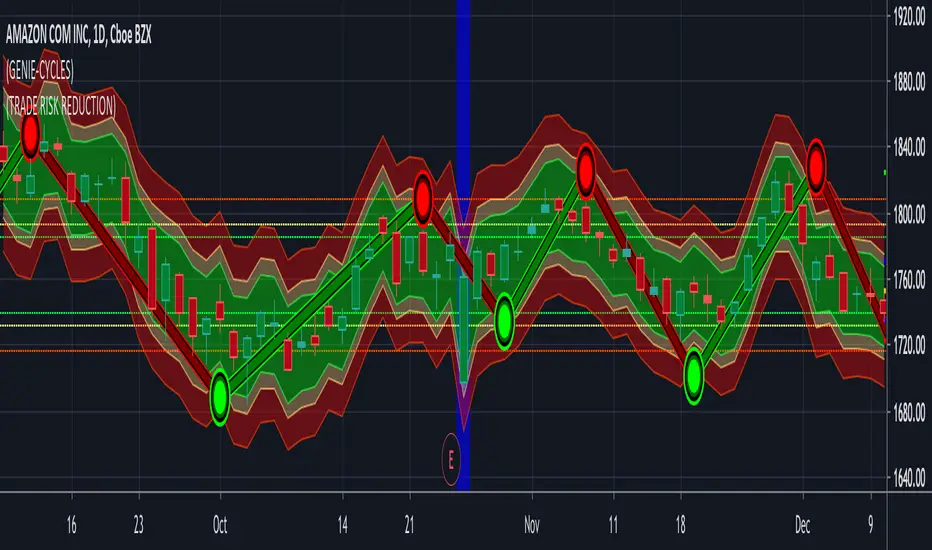
(15) Trade Risk Reduction VS-132TRR calculates the volatility of your stock. This is just the magnitude of each days price fluctuations, or what technicians refer to as the True Range. TRR averages the True Range (ATR) over three different time periods.
Why three? You want a sensitive indicator that reflect both the long term historical volatility of the equity as well as what that volatility is right now. Obviously the most recent trading days are the most important. The three ATR periods and their weighting factors are:
1) We use a 251 day period which equates to 1 trading year because we want to know what the historical volatility is. This one year period is not weighted.
2) We utilize a 21 day period because the most recent weeks tells us what the stock volatility has been over the previous calendar month. This is weighted by a factor of 2.
3) Finally, we utilize the last weeks data, Last 5 days, (L5D) to provide us with the stocks movement in the most recent trading days. This is weighted by a factor of 4.
The total of ATR251*(1) + ATR21*(2) + ATR5*(4) is then divided by the total of all factors (7).
This results in the Weighted Average True Range that the Trade Risk Reduction utilizes to produce the dynamic bands on your charts as well as power the Risk and Stop loss calculators. These indicate where this indicator is currently recommending you place stops. In the Format options of the application you are provided with the ability to adjust these band. Keep in mind that each stock will act in it's own unique and characteristic way. Looking closely at the stock's historical data, both in longer and shorter time periods should provide you with some insight into the normal variations and fluctuations of this particular equity. Below EBAY provides an example of this.
Access this Genie indicator for your Tradingview account, through our web site. (Links Below) This will provide you with additional educational information and reference articles, videos, input and setting options and trading strategies this indicator excels in.
High and Lows + ATRScript is showing previous year, month and day high and low, plus ATR range from the open price on the current day.


Maximum True RamgePlots the the highest true range for the entire dataset.
Beneficial for determine an emergency stopp loss.

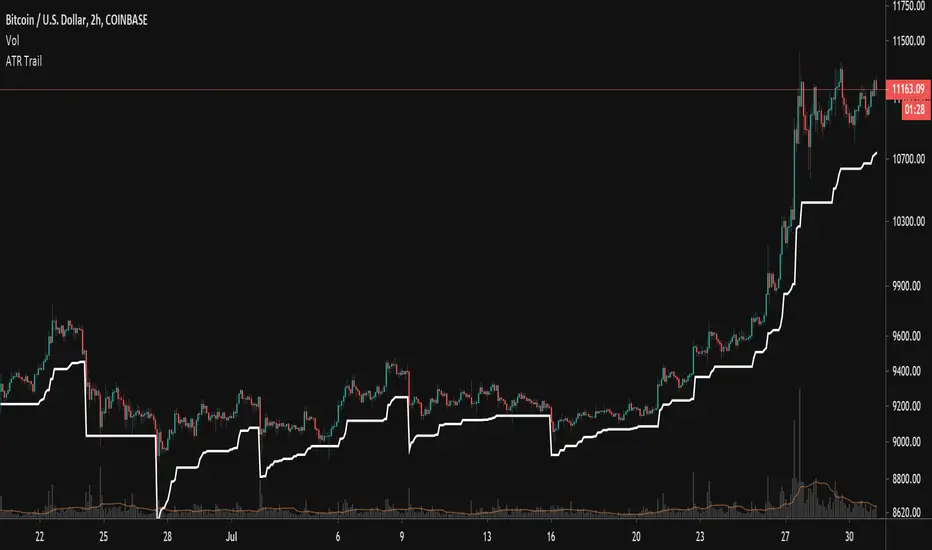
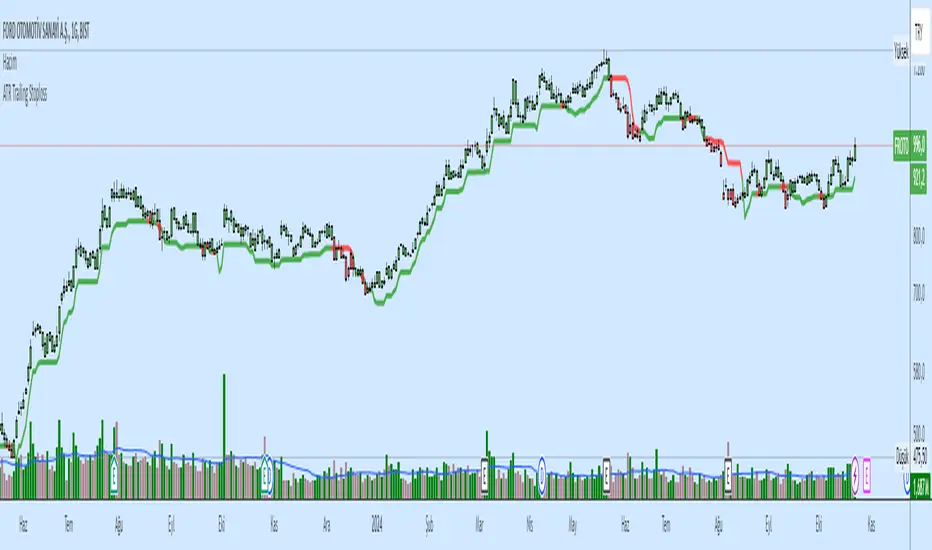
Trailing ATR StopsThis script plots a trailing stop of the ATR multiplied by a user-defined number. Since it is meant to be used as a trailing stop, the value doesn't fluctuate with the price as a normal ATR indicator does, but stays fixed unless price moves away from it. In that case it follows the price. If price crosses the stop level, it resets itself based on current price and starts trailing all over again.
User Settings:
Support - Use for a trailing stop while long
Resistance - Use for a trailing stop while short
Both - Acts like a channel and can spot periods of lower volatility
Fibonacci BandsFibonacci Bands are derived from Fibonacci ratios expansion from a fixed moving average.
These bands help traders find key areas of support and resistance . "Fibonacci bands" are
computed by adding a Fibonacci ratio distance (Up and Down) from a "key moving" average
(21, 34, 89 periods). An 8 period average of "True range" is computed. The multiples of
Fibonacci ratios of this range are added to the fixed moving average to compute Fibonacci
Bands
One of the best ways to find trend reversals is to watch the price action near the extreme bands
(both lower and higher). Markets tend to reverse when prices trade outside of the band for a
few bars and again trade inside the bands. After reversals, markets also tend to trade from one
extreme band to the other end (opposite) of the extreme bands.

Premarket High/LowThe script draws the high and low of the premarket session and based on these levels the ATR is added and also displayed on the chart as lines.
You can change:
- The Session Timeframe
- The ATR Multiple
- If the Aftermarket Session should be included

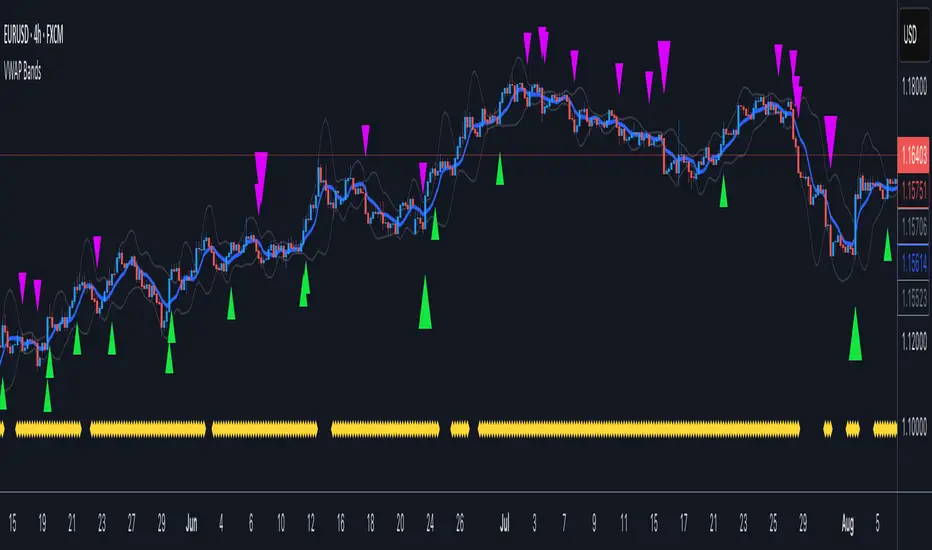
VWAP BandsOrginal VWAP script is from neolao, so big thanks to him.
Took the VWAP, added the Bollinger and Keltner channel squeeze. Also there is a criteria of Bands width.
Great tool to predict fast large moves within short periods of time.
Tried to keep the charts as clean as possible and easy to read.
If there are any questions Ill be happy to help or answer them.
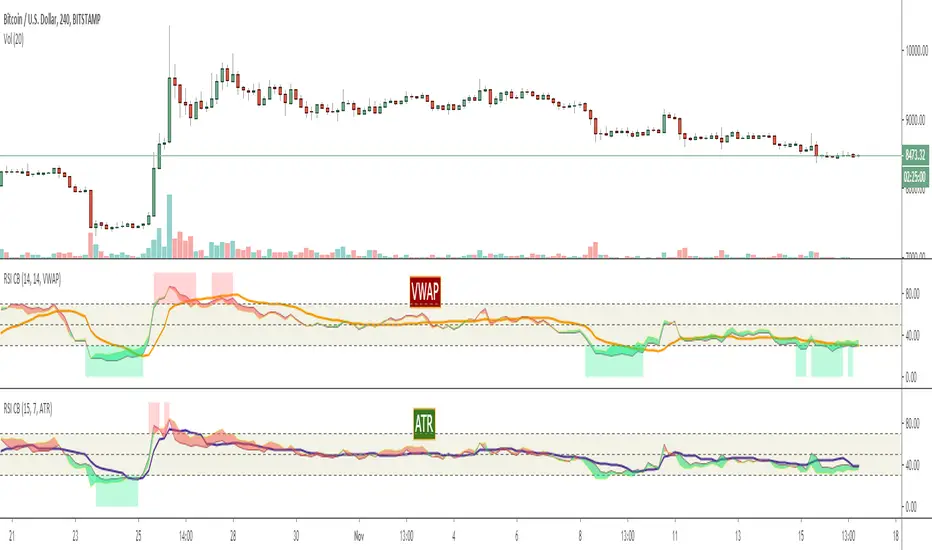
Relative Strength Index With Signals [ChuckBanger]Every developer should have there own Relative Strength Index indicator. This is my version. Relative Strength Index or RSI is the most used indicator. It is an momentum based oscillator which is used to measure the velocity as well as the change of direction of price action. Essentially RSI provides a visual mean to monitor both the current, as well as historical, strength and weakness of the market you trade. RSI is calculated as folowing: RSI = 100 – 100/ (1 + RS) where RS = Average Gain of n days UP / Average Loss of n days DOWN.
In this study RSI is weighted with ether VWAP (volume-weighted average price) or ATR (Average True Range) . The user can select that through the menu. RSI can have a reading from 0 to 100. The values of 70 or above indicate that an instrument is becoming overbought or overvalued and may be primed for a trend reversal or corrective pullback in price. The values of 30 or below indicates an oversold or undervalued condition.
The other significant signals are divergences with price and middle line crossovers. This version also has a signal line witch can be used as a signal when RSI crossover
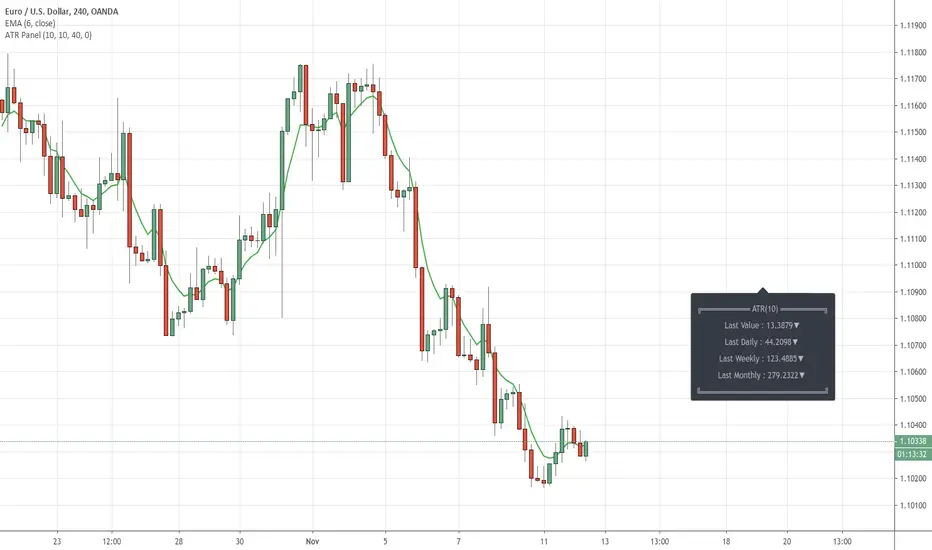
ATR Info Panel by JustUncleLDescription:
Display Last completed ATR values in a text information panel on the chart. These values are handy for calculating Stop Loss.
This script includes input offsets to optionally position the Panel, these can be Positive or Negative offsets.
References:
Thanks go to RicardoSantos for showing us the way to create a Panel with his Function - InfoPanel
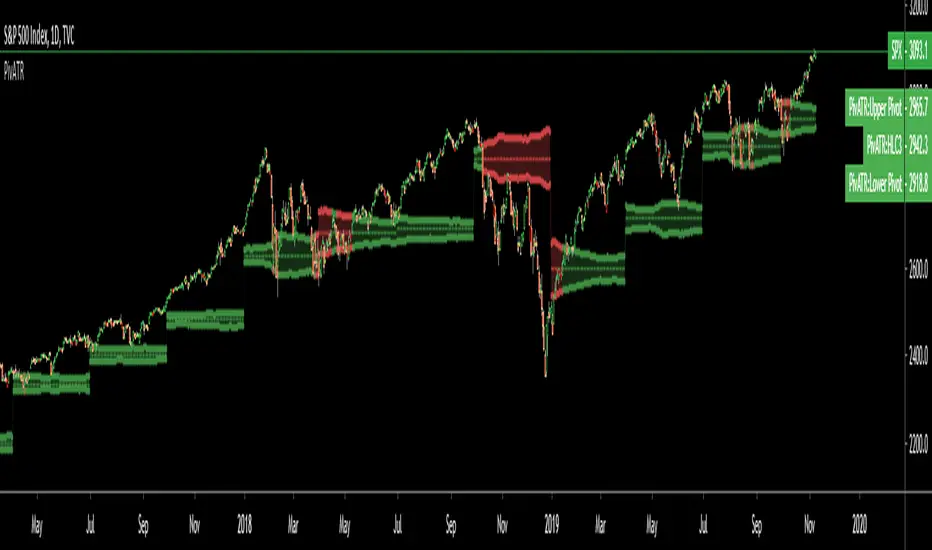
Adaptive Pivot (HLC3)SUMMARY:
Standard Pivot (HLC3) with ATR leeway added to make it adaptive to market volatility.
DESCRIPTION:
Adaptive Pivot is an indicator utilizing the simplicity of HLC3 Pivots as a turning point (and sometimes a trend indicator) while addressing it's fixed and inflexible nature.
Because the indicator is just a single line in the chart, the price may go near it but never touch it. Or it can go pass through it and never retest it again. In an attempt to lessen these from occurring, we can combine pivots with average true range (ATR). This is the specific formula I applied in this indicator:
>Upper Pivot = HLC3 + ATR
>Lower Pivot = HLC3 - ATR
This creates a kind of a range or cloud around the Pivot, making it possibly a more accurate indicator for market turning points.
ADJUSTABLE PARAMETERS:
The usual ATR parameters are included in this indicator:
>ATR_Length = input(14, title="ATR Length", minval=1)
>ATR_Smoothing = input(title="ATR Smoothing", defval="RMA", options="RMA", "SMA", "EMA", "WMA")
Added to the usual ones is this:
>ATR_Multiplier = input(1, title="ATR Multiplier", minval=0.1)
which modifies the extent of the ATR (similar to Chandelier Exit) as it is added/subtracted from the pivot values.
Pivot’s timeframe is also adjustable:
>Pivot_Timeframe = input("3M", title='Pivot Resolution')
Note: I did not lock the type to input.resolution to allow for more possible timeframes.
OTHER PARAMETERS
Indicator color will change to green when the open is above the HLC3 Pivot and change to red when the reverse is true.
Baseline-C [ID: AC-P]The "AC-P" version of jiehonglim's NNFX Baseline script is my personal customized version of the NNFX Baseline concept as part of the NNFX Algorithm stack/structure for 1D Trend Trading for Forex. Everget's JMA implementation is used for the baseline smoothing method, with optional ATR bands at 1.0x and 1.5x from the baseline.
NNFX = No Nonsense Forex
Baseline = Component of the NNFX Algorithm that consists of a single moving average
Baseline ---> Meant to be used in conjunction with ATR/C1/C2/Vol Indicator/Exit Indicator as per NNFX Algorithm setup/structure. C1 is 1st Confirmation Indicator, C2 is 2nd Confirmation Indicator.
JMA (Jurik Moving Average) is used for the baseline and slow baseline.
A slow baseline option is included, but disabled by default.
The faint orange/purple lines are 1.0x/1.5x ATR from the Baseline, and are what I use as potential TP/SL targets or to evaluate when to stay out of a trade (chop/missed entry/exit/other/ATR breach), depending on the trade setup (in conjunction with C1/C2/Vol Indicator/Exit Indicator)
This script is heavily based upon jiehonglim's NNFX Baseline script for signaling, barcoloring, and ATR.
SSL Channel option included but disabled by default (Erwinbeckers SSL component)
POC (Point of Control) from Volume Profile is included/enabled by default for both the current timeframe and 12HR timeframe
03.freeman's InfoPanel Divergence Indicator was used a reference to replace the current/previous ATR information infopanel/info draw from jiehonglim's script. I'm not sure whether I like the previous way ATR info was displayed vs how I have it currently, but it's something that is completely optional:
Specifically: I am tuning this baseline/indicator for 1D trading as part of the NNFX system, for Forex.
DO NOT USE THIS INDICATOR WITHOUT PROPER TUNING/ADJUSTMENT for your timeframe and asset class.
Note about lack of alerts:
Alerts for baseline crosses (and other crosses) have been purposefully omitted for this version upon initial publication. While getting alerts for baseline crosses under certain conditions/filtered conditions that eliminate low-importance signals and crossover whipsaw would be great, it's something I'm still looking into.
SPECIFICALLY: There are entry, exit, take profit, and continuation signal components in relation to the Baseline to the rest of the NNFX Algorithm stack (ATR/C1/C2/Vol Indicator/Exit Indicator), including but limited to the "1 candle rule" and the "7 candle rule" as per NNFX.
Implementing alerts that are significant that also factor in these rules while reducing alert spam/false signals would be ideal, but it's also the HTF/Daily chart - visually, entry/exit/continuation signal alignment is easy to spot when trading 1D - alerts may be redundant/a pursuit in diminishing returns (for now).
//-------------------------------------------------------------------
// Acknowledgements/Reference:
// jiehonglim, NNFX Baseline Script - Moving Averages
//
// Fractured, Many Moving Averages
//
// everget, Jurik Moving Average/JMA
//
// 03.freeman, InfoPanel Divergence Indicator
//
// Ggqmna Volume stops
//
// Libertus RSI Divs
//
// ChrisMoody, CM_Price-Action-Bars-Price Patterns That Work
//
// Erwinbeckers SSL Channel
//

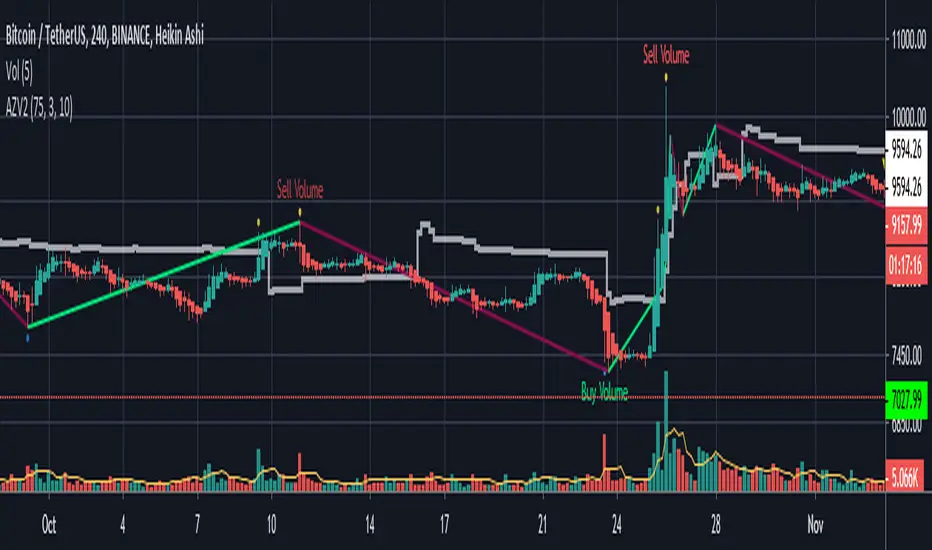
AZV Indicator
AVZ
Market is changing by 4 Factors which are (PVTTI - Price - Volume - Trades - Time
This indicator is a hybrid, with a combination of leading indicators and lagging trending indicators combined into one,and it's using mostly the 3 factors_ PVT which will help you getting good trades .
Volume :-
Leading indicators such as Volume Spikes , Average Volume Spikes (VolMA) ,and a special Spike calculation using RSI as a function with volume as a source .
Price:-
SemiLead indicators such as Aroon Indicator , RSI .
Time and Price Combination :-
Trend Recognition using Harmonic and Zigzag implementation from 'RicardoSantos' .
.
www.investopedia.com
Volatility Recognition : Using a special calculation to get the average called ( ZScore ) with Vwap implementation .
en.wikipedia.org
www.investopedia.com
How to use ?
This indicator is using number of bars of the last wave whatever if it's UP wave or Down wave .
Type number of bars on the specified area of the wave ( Bars Of Wave )
How many NO. Bar s to get accurate levels ?
1- If you are searching for a Support level , you have to count the number of bars of last UP wave from its low to it's high .
2- If you are searching for a Resistant level , you have to count the number of bars of last Down wave from its high to its low .
Buying Signal and Selling Signal ?
The indicator tries to identify levels that Buying Volume enter in the same way for Selling Volume .
ScalpSnakeA simple Scalping tool, based off of ATR multiples. Long above the line...Short below it. Adjust the length of signal calculation, and the Multiple of the Asset's ATR to loosen/tighten signals as desired...
Average True Range Multiplied (Volatility Stop)Plots crosses above and below the current price giving you the ability to quickly set your stop loss (or the 1st profit target) depending on a custom variable by which the average true range is multiplied with the option to specify the length as well as the type of the moving average (RMA, SMA, EMA or WMA) that are taking into account.
Optionally, you can disable showing of the crosses on the chart and just let the indicator display the calculated value by itself.

Range Force Impulse The "Range Force Impulse" indicator combines 4 useful indicators into one, freeing up chart real-estate and giving the trader insight into trend health, bull/bear commitment, range and volatility all at a glance.
The indicator consists of the following:
Direction - True Range and Average True Range columns shown above and below 0 depending on direction of the period's price
-- TR (gray) shows the current period's trading volatility
-- ATR (Impulse colors, see below) shows an EMA of TR over a specified length
-- Can be used to determine stops and targets (Example: Stop loss at prev close - ATR, Target at 2x ATR)
Index - Alexander Elder's EMA of (change(close) * volume), shows crosses above 0 (green) and below 0 (red), and intermediate signals
-- Shows bull vs. bear interest/commitment/dominance
-- Elder recommends EMA length of 2 for daily chart buy/sell signals, and 13 for weekly chart bull/bear dominance & trend direction signals
-- Intermediate signals are shown above 0 when falling (salmon), or below 0 when rising (pale yellow)
System - Range columns are colored using Alexander Elder's censorship system (green: do not short, red: do not long, blue: is up to you)
-- Shows overall trend health (Macd histogram and EMA up/down changes)

