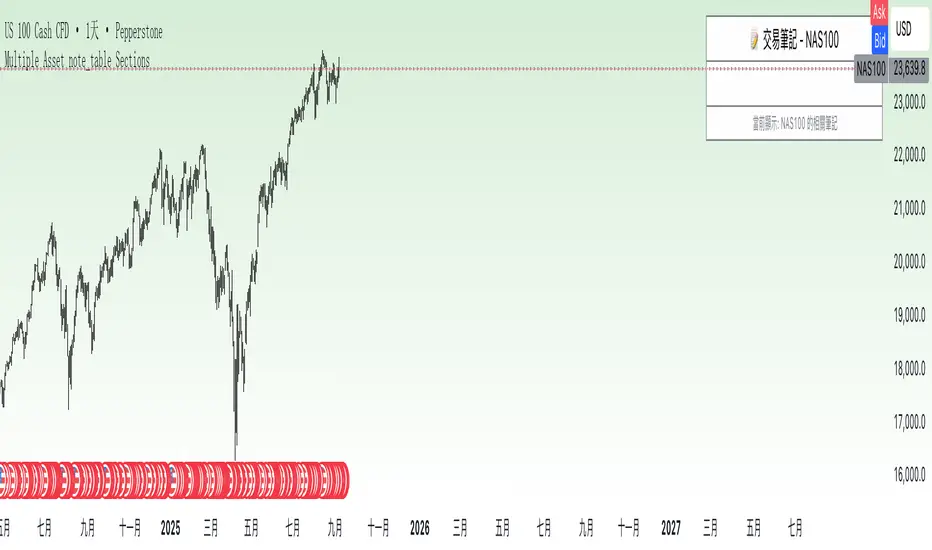
Multiple Asset note_table Sections### Features
- **Expanded to 10 independent Sections**: Each Section has a title, content, and associated asset
- **Asset-based filtering**: Section only displays when the Section's asset name is empty or matches the current chart asset
- **Empty asset setting retained**: If Section asset name is left blank, that Section will display across all assets
- **Automatic display of current asset**: Current asset name is automatically shown in the header and footer
### Usage Instructions
1. Each Section can be assigned a specific asset name, such as "BTCUSDT", "ETHUSDT", etc.
2. A Section will only display when the current chart asset matches the asset specified for that Section
3. If you want a Section to display across all assets, simply leave the asset name blank for that Section
4. Each Section has independent title and content that can be customized as needed
5. When switching to different trading instruments, the indicator automatically displays notes relevant to the current instrument
Asset
Elite Display# 😎 Elite Display - Simple Chart Info with Style
**Never lose track of what you're looking at!**
A clean, fun way to display your asset name, timeframe, and daily performance directly on your chart. Created by ** ** for traders who like their charts both informative and stylish.
## 📊 **What it shows:**
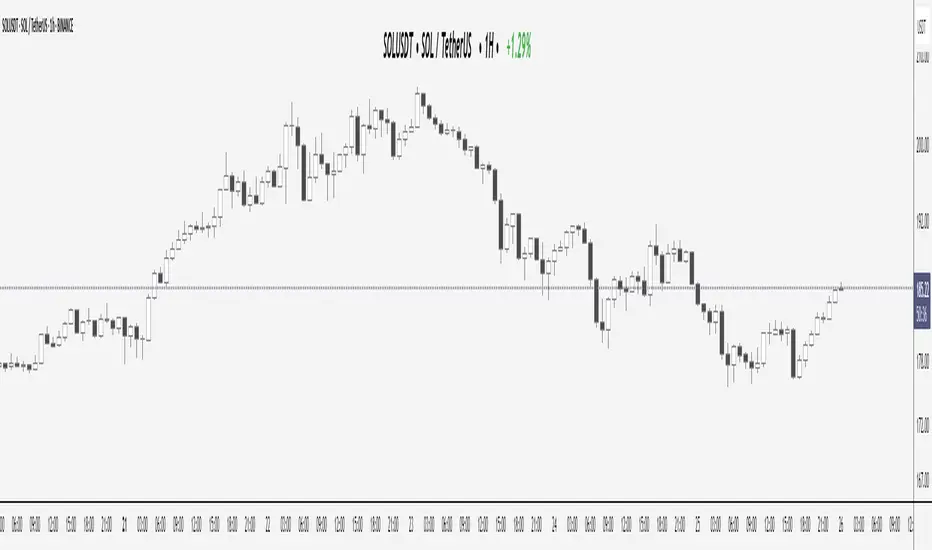
- Asset name (BTCUSDT) or description (Bitcoin/TetherUS)
- Current timeframe (1H, 4H, 1D, etc.)
- Daily % change with green/red colors
**Example:** `BTCUSDT | 1H | +2.45%`
## 🎨 **Make it yours:**
- **60+ separator styles** - From classic `|` to fun emojis 🚀💎⚡
- **Mood mode** - Separators react to your performance (😄 for gains, 😢 for losses)
- **Position anywhere** - 9 spots on your chart
- **Custom styling** - Colors, fonts, sizes, bold/italic
## 🎯 **Perfect for:**
- Multi-timeframe analysis (never forget which TF you're on!)
- Taking clean screenshots for social media
- Avoiding "wait, what symbol is this?" moments
- Adding a bit of personality to your workspace
## ⚙️ **Super simple setup:**
1. Add to chart
2. Pick what to show (asset/timeframe/both)
3. Choose your style (classic, fun, or reactive mood)
4. Position it wherever you want
5. Done!
**It's just chart info... but way more fun!** 😊
*Works on all markets: Stocks, Crypto, Forex, Commodities*# 📊 TradingHUD - Your Smart Chart Companion
**Transform your charts with the ultimate context display!** Never lose track of your symbol, timeframe, and performance again. This highly customizable indicator brings personality and clarity to your trading workspace.
## 🚀 **Key Features:**
✅ **5 Display Modes:**
- Asset Name (ticker only)
- Full Description (complete name)
- Both combined
- Timeframe Only
- Daily Variation Only
✅ **60+ Separator Styles in 3 Categories:**
- 🎨 **Classic** (15): Professional symbols (|, •, →, ★, etc.)
- 🎉 **Fun** (20): Colorful objects (🚀, 💎, ⚡, 🎯, 💰, etc.)
- 🎭 **Mood** (40+): Reactive yellow faces!
- 😄 **Happy** (21): 😀😊🥰😎🥳 (for green gains)
- 😢 **Sad** (23): 😢😭🥺😞😩 (for red losses)
✅ **Intelligent Variation Display:**
- Daily % change with smart color coding
- Green/red performance tracking
- Only appears on relevant timeframes (intraday + daily)
- Automatically hidden on weekly/monthly
✅ **Ultimate Customization:**
- 9 positioning options anywhere on chart
- Font families: Default or Monospace
- Bold/italic text formatting
- Custom colors and sizes
- Flexible element ordering
## 🎭 **Mood Mode Magic:**
Watch your separators celebrate wins with 😄🤑🚀 or empathize with losses using 😢😭💸. Toggle this emotional feature on/off anytime!
## 💡 **Perfect For:**
- Multi-timeframe analysis
- Screenshot documentation with context
- Avoiding symbol confusion
- Real-time performance tracking
- Adding personality to professional charts
- Social media trading posts
## ⚙️ **Quick Setup:**
1. Add TradingHUD to your chart
2. Select display mode (Asset/Description/Both/etc.)
3. Choose separator style (Classic/Fun/Mood)
4. Position anywhere you want
5. Customize colors, fonts, and formatting
6. Trade with confidence and style!
## 🎯 **Live Examples:**
- **Classic**: `BTCUSDT | 1H | +2.45%`
- **Fun**: `AAPL 🚀 4H 🚀 -1.23%`
- **Happy Mood**: `Gold 😄 1D 😄 +3.67%`
- **Sad Mood**: `BTC 😢 15min 😢 -5.12%`
**Professional meets personality. Context meets creativity. This is TradingHUD.** 📈✨
*Compatible with all markets: Stocks, Crypto, Forex, Commodities, Indices*
Assets Correlation by GDM📊 Correlation Matrix Table between Two Assets
This indicator calculates and displays the rolling correlation between the asset on your chart and a second asset of your choice. The correlation is computed based on log returns over a user-defined lookback period. A live summary table appears in the bottom left corner, providing a real-time snapshot of the current correlation and its context.
How it works:
Comparison Asset:
Select any symbol to compare with the chart asset (e.g., compare BTCUSD to ETHUSD).
Lookback Period:
Choose the rolling window (in bars) used to calculate the Pearson correlation coefficient.
Dynamic Table:
A table in the lower left corner summarizes:
Main asset symbol
Comparison symbol
Analysis period (bars)
Current correlation value (rounded to 2 decimals)
Correlation strength & direction (Strong, Moderate, Weak | Positive/Negative)
Visual Plot:
The indicator plots the correlation value over time so you can observe changes and trends.
Table Positioning:
Table location can be adjusted from settings (bottom left/right, top left/right).
How to use:
Risk Management & Diversification:
Quickly assess if two assets move together (positive correlation), in opposite directions (negative correlation), or independently.
Pairs Trading:
Identify opportunities when correlation diverges from historical norms.
Portfolio Construction:
Avoid overexposure to highly correlated assets, or use negative correlation for hedging.
Limitations & Tips:
Correlation values are based on historical returns and may change during periods of market stress or volatility.
Use multiple lookback periods (short, medium, long) for a more robust view.
Correlation does not imply causation—always complement with additional analysis.
Script Features:
User-selectable comparison asset and lookback window.
Real-time correlation calculation.
Clean summary table with correlation stats.
Optional alert logic and correlation plot for more advanced usage.
If you find this indicator useful, please leave a like and let me know your suggestions for improvements!

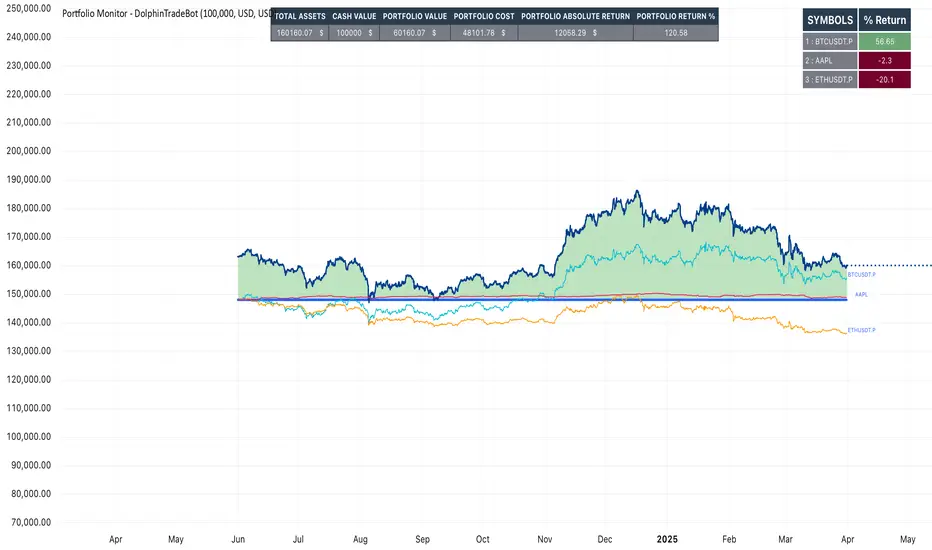
Portfolio Monitor - DolphinTradeBot1️⃣ Overview
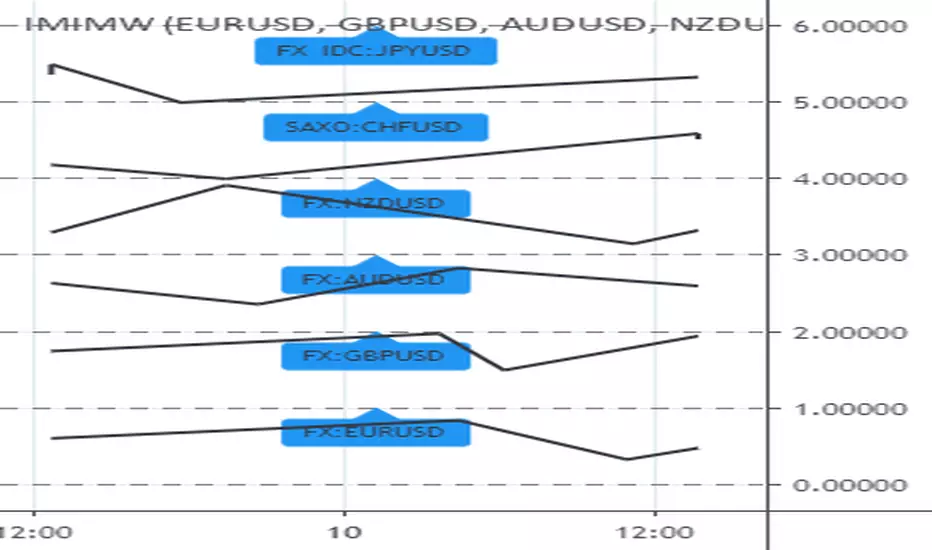
▪️This indicator unifies the value of all your investments—whether stocks, currencies, or cryptocurrencies—in your chosen currency. This tool not only provides a clear snapshot of your overall portfolio performance but also highlights the individual growth of each asset with intuitive visualizations and an easy-to-understand performance report.
2️⃣ What sets this indicator apart
▪️is its ability to convert values from various currency pairs into any currency you choose. This means you can monitor your portfolio's performance against any currency pair you prefer, offering a flexible and comprehensive view of your investments.
3️⃣ How Is It Work ?
🔍The indicator can be analyzed under two main categories: visual representations and tables.
1- Visual representations ;
The indicator includes three different types of lines:
1. 1 - Reference Line → This represents the cost of all assets we hold, based on the selected date.
1. 2 - Total Assets Line → Displays the real-time value of all assets in our possession, including cash value, in the selected trading pair.
The area between the reference line is filled with green and red. The section above the reference line is represented in green, while the section below is shown in red.
1. 3 - Performance Lines → These visualize the performance of the assets, starting from the reference line and taking into account their weights in the portfolio. (Note: The lines are scaled for visualization purposes, so their absolute values should not be considered.)
"The names of the lines are shown in the image below."⤵️
2- Tables
The indicator includes three different types of tables:
2. 1 - Analysis Table : It provides a superficial overview of wallet statistics and values.
▪️TOTAL ASSETS → The current equivalent of all assets in the target currency
▪️CASH VALUE → The current value of the amount "Cash Value", in the target currency.
▪️PORTFOLIO VALUE → The total value of assets excluding Cash, in the target currency.
▪️POSTFOLIO COST → The cost of assets excluding Cash, in the target currency.
▪️PORTFOLIO ABSOLUTE RETURN → It shows the profit or loss relative to the cost of assets
▪️PORTFOLIO RETURN % →It shows the profit or loss relative to the cost of assets on a percentage basis
2. 2 - Performance Table : It displays the names of assets excluding Cash and their profit amounts, sorted from highest to lowest profit. If "Show as Percentage" is selected in the settings, it shows the percentage profit or loss relative to the cost. Profits are represented in green, while losses are represented in red.
"You can see the visual showing the tables below"⤵️
4️⃣How to Use ?
1- Choose the date on which the visualization will begin (📌The start date only affects the exchange rate used for calculating the reference line in the target currency.)
2- If you have cash holdings, enter the amount and specify the currency.
3- Select the currency in which your portfolio value will be displayed.(Default value is USD)
4- To set up your portfolio;
SYMBOLS - QUANTITY - PURCHASE PRICE
Enter the symbols of your assets - the number of units you hold - and their cost levels.
5- If you have cash, be sure to include your cash balance. If you also hold other currencies, enter them as separate assets with their corresponding quantities and purchase prices.
6- If you want to see the percentage returns of the assets in the performance table relative to their cost, select the "Show as Percent" option.
7- If you want to see the performance visuals of the assets, click on the "Show Asset Performance" option.
You can find an image of the settings section where the numbers above are used as references below.⤵️
📌 NOTE → By default, a few assets and their values have been pre-added in the initial settings. This is to ensure that you don’t see an empty screen when adding the indicator to the chart. Please remember to enter your own assets and values. The default settings are only provided as an example.
Democratic MultiAsset Strategy [BerlinCode42]Happy Trade,
Intro
Included Trade Concept
Included Indicators and Compare-Functions
Usage and Example
Settings Menu
Declaration for Tradingview House Rules on Script Publishing
Disclaimer
Conclusion
1. Intro
This is the first multi-asset strategy available on TradingView—a market breadth multi-asset trading strategy with integrated webhooks, backtesting capabilities, and essential strategy components like Take Profit, Stop Loss, Trailing, Hedging, Time & Session Filters, and Alerts.
How It Trades? At the start of each new bar, one asset from a set of eight is selected to go long or short. As long there is available cash and the selected asset meets the minimum criteria.
The selection process works through a voting system, similar to a democracy. Each asset is evaluated using up to five indicators that the user can choose. The asset with the highest overall voting score is picked for the trade. If no asset meets all criteria, no trade is executed, and the cash reserve remains untouched for future opportunities.
How to Set Up This Market Breadth Strategy:
Choose eight assets from the same market (e.g., cryptos or big tech stocks).
Select one to five indicators for the voting system.
Refine the strategy by adjusting Take Profit, Stop Loss, Hedging, Trailing, and Filters.
2. Voting as the included Trade Concept
The world of financial trading is filled with both risks and opportunities, and the key challenge is to identify the right opportunities, manage risks, and do both right on time.
There are countless indicators designed to spot opportunities and filter out risks, but no indicator is perfect—they only work statistically, hitting the right signals more often than the wrong ones.
The goal of this strategy is to increase the accuracy of these Indicators by:
Supervising a larger number of assets
Filtering out less promising opportunities
This is achieved through a voting system that compares indicator values across eight different assets. It doesn't just compare long trades—it also evaluates long vs. short positions to identify the most promising trade.
Why focus on one asset class? While you can randomly select assets from different asset classes, doing so prevents the algorithm from identifying the strongest asset within a single class. Think about, within one asset class there is often a major trend whereby different asset classes has not really such behavior.
And, you don’t necessarily need trading in multiple classes—this algorithm is designed to generate profits in both bullish and bearish markets. So when ever an asset class rise or fall the voting system ensure to jump on the strongest asset. So this focusing on one asset class is an integral part of this strategy. This all leads to more stable and robust trading results compared to handling each asset separately.
3. Included Indicators and Compare-Functions
You can choose from 17 different indicators, each offering different types of signals:
Some provide a directional signal
Some offer a simple on/off signal
Some provide both
Available Indicators: RSI, Stochastic RSI, MFI, Price, Volume, Volume Oscillator, Pressure, Bilson Gann Trend, Confluence, TDI, SMA, EMA, WMA, HMA, VWAP, ZLMA, T3MA
However, these indicators alone do not generate trade signals. To do so, they must be compared with thresholds or other indicators using specific comparison functions.
Example – RSI as a Trade Signal. The RSI provides a value between 0 and 100. A common interpretation is:
RSI over 80 → Signal to go short or exit a long trade
RSI under 20 → Signal to go long or exit a short trade
Here, two comparison functions and two thresholds are used to determine trade signals.
Below is the full set of available comparison functions, where: I represents the indicator’s value and A represents the comparator’s value.
I < A if I smaller A then trade signal
I > A if I bigger A then trade signal
I = A if I equal to A then trade signal
I != A if I not equal to A then trade signal
A <> B if I bigger A and I smaller B then trade signal
A >< B if I smaller A then long trade signal or if I bigger B then short trade signal
Image 1
In Image 1, you can see one of five input sections, where you define an indicator along with its function, comparator, and constants. For our RSI example, we select:
Indicator: RSI
Function: >< (greater/less than)
Comparator: Constant
Constants: A = 20, B = 80
With these settings a go short signal is triggered when RSI crosses above 80. And a go long signal is triggered when RSI crosses below 20.
Relative Strength Indicator: The RSI from the public TradingView library provides a directional trade signal. You can adjust the price source and period length in the indicator settings.
Stochastic Relative Strength Indicator: As above the Stoch RSI offers a trade signal with direction. It is calculated out of the RSI, the stochastic derivation and the SMA from the Tradingview library. You can set the in-going price source and the period length for the RSI, for the Stochastic Derivation and for the SMA as blurring in the Indicator settings section.
Money Flow Indicator: As above the MFI from the public Tradingview library offers a trade signal with direction. You can set the in-going price source and the period length in the Indicator settings section.
Price: The Price as Indicator is as simple as it can be. You can chose Open, High, Low or Close or combinations of them like HLC3 or even you can import an external Indicator. The absolute price or value can later be used to generate a trade signals when certain constant thresholds or other indicators signals are crossed.
Volume: Similar as above the Volume as Indicator offers the average volume as absolute value. You can set the period length for the smoothing and you can chose where it is presented in the base currency $ or is the other. For example the trade pair BTCUSD you can chose to present the value in $ or in BTC.
Volume Oscillator: The Volume Oscillator Indicator offers a value in the range of . Whereby a value close to 0 means that the volume is very low. A value around 1 means the volume is same high as before and Values higher as 1 means the volume is bigger then before. You can set the period length for the smoothing and you can chose where it is presented in the base currency $ or is the other. For example the trade pair BTCUSD you can chose to present the value in $ or in BTC.
Pressure Indicator: The Pressure is an adapted version of LazyBear's script (Squeeze Momentum Indicator) Pressure is a Filter that highlight bars before a bigger price move in any direction. The result are integer numbers between 0 and 4 whereby 0 means no bigger price move excepted, while 4 means huge price move expected. You can set the in-going price source and the period length in the Indicator settings section.
Bilson Gann Trend: The Bilson Gann Trend Indicator is a specific re-implementation of the widely known Bilson Gann Count Algorithm to detect Highs and Lows. On base of the last four Highs and Lows a trend direction can be calculated. It is based on 2 rules to confirm a local pivot candidate. When a local pivot candidate is confirmed, let it be a High then it looks for Lows to confirm. The result range is whereby -1 means down trend, 1 means uptrend and 0 sideways.
Confluence: The Confluence Indicator is a simplified version of Dale Legan's "Confluence" indicator written by Gary Fritz. It uses five SMAs with different periods lengths. Whereby the faster SMA get compared with the (slower) SMA with the next higher period lengths. Is the faster SMA smaller then the slower SMA then -1, otherwise +1. This is done with all SMAs and the final sum range between . Whereby values around 0 means price is going side way, Crossing under 0 means trend change from bull to bear. Is the value>2 means a strong bull trend and <-2 a strong bear trend.
Trades Dynamic Index: The TDI is an adapted version from the "Traders Dynamic Index" of LazyBear. The range of the result is whereby 2 means Top goShort, -2 means Bottom goLong, 0 is neutral, 1 is up trend, -1 is down trend.
Simple Moving Average: The SMA is the one from the Tradingview library. You can compare it with the last close price or any other moving average indicator to indicate up and down trends. You can set the in-going price source and the period length in the Indicator settings section.
Exponential Moving Average: The EMA as above is the one from the Tradingview library. You can compare it with the last close price or any other moving average indicator to indicate up and down trends. You can set the in-going price source and the period length in the Indicator settings section.
Weighted Moving Average: The WMA as above is the one from the Tradingview library. You can compare it with the last close price or any other moving average indicator to indicate up and down trends. You can set the in-going price source and the period length in the Indicator settings section.
Hull Moving Average: HMA as above is the one from the Tradingview library. You can compare it with the last close price or any other moving average indicator to indicate up and down trends. You can set the in-going price source and the period length in the Indicator settings section.
Volume Weighted Average Price: The VWAP as above is the one from the Tradingview library. You can compare it with the last close price or any other moving average indicator to indicate up and down trends. You can set the in-going price source in the Indicator settings section.
Zero Lag Moving Average: The ZLMA by John Ehlers and Ric Way describe in their paper: www.mesasoftware.com
As the other moving averages you can compare it with the last close price or any other moving average indicator to indicate up and down trends. You can set the in-going price source and the period length in the Indicator settings section.
T3 Moving Average: The T3MA is the one from the Tradingview library. You can compare it with the last close price or any other moving average indicator to indicate up and down trends. You can set the in-going price source, the period length and a factor in the Indicator settings section. Keep this factor at 1 and the T3MA swing in the same range as the input. Bigger 1 and it swings over. Factors close to 0 and the T3MA becomes a center line.
All MA's following the price. The function to compare any MA Indicators would be < or > to generate a trade direction. An example follows in the next section.
4. Example and Usage
In this section, you see how to set up the strategy using a simple example. This example was intentionally chosen at random and has not undergone any iterations to refine the trade results.
We use the RSI as the trade signal indicator and apply a filter using a combination of two moving averages (MAs). The faster MA is an EMA, while the slower MA is an SMA. By comparing these two MAs, we determine a trend direction. If the faster MA is above the slower MA the trend is upwards etc. This trend direction can then be used for filtering trades.
The strategy follows these rules:
If the RSI is below 20, a buy signal is generated.
If the RSI is above 80, a sell signal is generated.
However, this RSI trade signal is filtered so that a trade is only given the maximum voting weight if the RSI trade direction aligns with the trend direction determined by the MA filter.
So first, you need to add your chosen assets or simply keep the default ones. In Image 2, you can see one of the eight asset input sections.
Image 2
This strategy offers some general trade settings that apply equally to all assets and some asset-specific settings. This distinction is necessary because some assets have higher volatility than others, requiring asset-specific Take Profit and Stop Loss levels.
Once you have made your selections, proceed to the Indicators and Compare Functions for the voting. Image 3 shows an example of this setup.
Image 3
Later on go to the Indicator specific settings shown in Image 4 to refine the trade results.
Image 4
For refine the trade results take also a look on the result summary table, development of capital plot, on the list of closed and open trades and screener table shown in Image 5.
Image 5
To locate any trade for any asset in the chronological and scroll-able trade list, each trade is marked with a label:
An opening label displaying the trade direction, ticker ID, trade number, invested amount, and remaining cash reserves.
A closing label showing the closing reason, ticker ID, trade number, trade profit (%), trade revenue ($), and updated cash reserves.
Additionally: a green line marks each Take Profit level. An orange line indicates the (trailing) Stop Loss.
The summary table in the bottom-left corner provides insights into how effective the trade strategy is. By analyzing the trade list, you can identify trades that should be avoided.
To find those bad trades on the chart, use the trade number or timestamp. With replay mode, you can go back in time to review a specific trade in detail.
Image 6
In Image 6, you can see an example where replay mode and the start time filter are used to display specific trades within a narrow time range. By identifying a large number of bad trades, you may recognize patterns and formulate conditions to avoid them in the future.
This is the backtesting tool that allows you to develop and refine your trading strategy continuously. With each iteration—from general adjustments to detailed optimizations—you can use these tools to improve your strategy. You can:
Add other indicators with trade signals and direction
Add more indicators signals as filter
Adjust the settings of your indicators to optimize results
Configure key strategy settings, such as Time and Session Filters, Stop Loss, Take Profit, and more
By doing so, you can identify a profitable strategy and its optimal settings.
5. Settings Menu
In the settings menu you will find the following high-lighted sections. Most of the settings have a i mark on their right side. Move over it with the cursor to read specific explanation.
Backtest Results: Here you can decide about visibility of the trade list, of the Screener Table and of the Results Summary. And the colors for bullish, side ways, bearish and no signal. Go above and see Image 5.
Time Filter: You can set a Start time or deactivate it by leave it unhooked. The same with End Time and Duration Days . Duration Days can also count from End time in case you deactivate Start time.
Session Filter: Here, you can chose to activate trading on a weekly basis, specifying which days of the week trading is allowed and which are excluded. Additionally, you can configure trading on a daily basis, setting the start and end times for when trades are permitted. If activated, no new trades will be initiated outside the defined times and sessions.
Trade Logic: Here you can set an extra time frame for all indicators. You can enable Longs or Shorts or both trades.
The min Criteria percentage setting defines the minimum number of voices an asset has to get to be traded. So if you set this to 50% or less also weak winners of the voting get traded while 100% means that the winner of the voting has to get all possible voices.
Additionally, you have the option to delay entry signals. This feature is particularly useful when trade signals exhibit noise and require smoothing.
Enable Trailing Stop and force the strategy to trade only at bar closing. Other-ways the strategy trade intrabar, so when ever a voting present an asset to trade, it will send the alert and the webhooks.
The Hedging is basic as shown in the following Image 7 and serves as a catch if price moves fast in the wrong direction. You can activate a hedging mechanism, which opens a trade in the opposite direction if the price moves x% against the entry price. If both the Stop Loss and Hedging are triggered within the same bar, the hedging action will always take precedence.
Image 6
Indicators to use for Trade Signal Generating: Here you chose the Indicators and their Compare Function for the Voting . Any activated asset will get their indicator valuation which get compared over all assets. The asset with the highest valuation is elected for the trade as long free cash is present and as long the minimum criteria are met.
The Screener Table will show all indicators results of the last bar of all assets. Those indicator values which met the threshold get a background color to high light it. Green for bullish, red for bearish and orange for trade signals without direction. If you chose an Indicator here but without any compare function it will show also their results but with just gray background.
Indicator Settings: here you can setup the indicator specific settings. for deeper insights see 3. Included Indicators and Compare-Functions .
Assets, TP & SL Settings: Asset specific settings. Chose here the TickerID of all Assets you wanna trade. Take Profit 1&2 set the target prices of any trade in relation to the entry price. The Take Profit 1 exit a part of the position defined by the quantity value. Stop Loss set the price to step out when a trade goes the wrong direction.
Invest Settings: Here, you can set the initial amount of cash to start with. The Quantity Percentage determines how much of the available cash is allocated to each trade, while the Fee percentage specifies the trading fee applied to both opening and closing positions.
Webhooks: Here, you configure the License ID and the Comment . This is particularly useful if you plan to use multiple instances of the script, ensuring the webhooks target the correct positions. The Take Profit and Stop Loss values are displayed as prices.
6. Declaration for Tradingview House Rules on Script Publishing
The unique feature of this Democratic Multi-Asset Strategy is its ability to trade multiple assets simultaneously. Equipped with a set of different standard Indicators, it's new democratic Voting System does more robust trading decisions compared to single-asset. Interchangeable Indicators and customizable strategy settings allowing for a wide range of trading strategies.
This script is closed-source and invite-only to support and compensate for over a year of development work. Unlike other single asset strategies, this one cannot use TradingView's strategy functions. Instead, it is designed as an indicator.
7. Disclaimer
Trading is risky, and traders do lose money, eventually all. This script is for informational and educational purposes only. All content should be considered hypothetical, selected post-factum and is not to be construed as financial advice. Decisions to buy, sell, hold, or trade in securities, commodities, and other investments involve risk and are best made based on the advice of qualified financial professionals. Past performance does not guarantee future results. Using this script on your own risk. This script may have bugs and I declare don't be responsible for any losses.
8. Conclusion
Now it’s your turn! Chose an asset class and pick 8 of them and chose some indicators to see the trading results of this democratic voting system. Refine your multi-asset strategy to favorable settings. Once you find a promising configuration, you can set up alerts to send webhooks directly. Configure all parameters, test and validate them in paper trading, and if results align with your expectations, you even can deploy this script as your trading bit.
Cheers

Asset Allocation CalculatorOverview
This script is a tool that automatically calculates asset allocation for your investment portfolio. Users can set the weight of multiple assets and monitor the portfolio value in real time based on price fluctuations.
Key Features
Supports input of asset allocation percentages
Dynamic allocation calculation based on real-time price data
Automatically calculates allocated amounts for each asset based on the total investment amount
User-friendly interface with intuitive visual feedback
Settings
Total Capital : Enter the total capital, including the value of assets.
Quantity rounding : Using the rounding function may cause the target allocation to exceed 100%.
Tickers, Weight, Holdings :
To retrieve accurate asset prices, specify both the exchange and the ticker.
If you want to include cash in your portfolio, use $.
Ensure that the total allocation sums to 100%.
Refer to the pre-filled example for the correct format.
Table Settings : You can adjust the table's position, height, font size, and background color.
How to Use
By buying or selling the quantity shown in the Buy column, you can continuously maintain your target allocation.
Hold - Current holdings
Buy - Quantity to buy or sell to reach the target allocation
Target - Quantity aimed for after buying or selling
Caution
It can only calculate for a single currency, so do not mix multiple currency markets.
자산 배분 계산기
소개
이 스크립트는 투자 포트폴리오의 자산 배분을 자동으로 계산해주는 도구입니다. 사용자는 여러 자산의 비중을 설정할 수 있으며, 가격 변동에 따라 포트폴리오 가치를 실시간으로 모니터링할 수 있습니다.
주요 기능
자산 배분 비율 입력 지원
실시간 가격 데이터를 기반으로 한 동적 배분 계산
총 투자 금액을 기준으로 각 자산에 할당된 금액 자동 계산
직관적인 시각적 피드백을 제공하는 사용자 친화적인 인터페이스
설정
Total Capital : 자산 가치를 포함한 총 자본금을 입력하세요.
Quantity rounding : 반올림 기능을 사용하면 목표 비중이 100%를 초과할 수 있습니다.
Tickers, Weight, Holdings :
정확한 자산 가격을 불러오기 위해 거래소와 티커를 함께 입력하세요.
포트폴리오에 현금을 포함하려면 '$'를 사용하세요.
비중 합계가 반드시 100%가 되도록 설정하세요.
예제 형식을 참고하여 올바르게 입력하세요.
한국(원화) 시장을 위한 입력 예시입니다.
KRX:360750, 17.5, 100
KRX:310960, 17.5, 120
KRX:148070, 25, 20
KRX:305080, 25, 10
KRX:139320, 10, 150
UPBIT:BTCKRW, 5, 0.002
$,0,5000000
Table Settings : 테이블의 위치, 높이, 글자 크기 및 배경색을 조정할 수 있습니다.
사용 방법
Buy 열에 표시된 수량만큼 매수 또는 매도하면 목표 비중을 지속적으로 유지할 수 있습니다.
Hold - 현재 보유 수량
Buy - 목표 비중을 맞추기 위해 매수 또는 매도해야 하는 수량
Target - 매수, 매도 후 목표로 하는 수량
주의
한 가지 통화로만 계산할 수 있으니 여러 통화 시장을 혼용하지 마세요.

Multi-Asset & TF RSI
Multi-Asset & TF RSI
This indicator allows you to compare the Relative Strength Index (RSI) values of two different assets across multiple timeframes in a single pane. It’s ideal for traders who wish to monitor momentum across different markets or instruments simultaneously.
Key Features:
Primary Asset RSI:
The indicator automatically calculates the RSI for the chart’s asset. You can adjust the timeframe for this asset using a dropdown that offers standard TradingView timeframes, a "Chart" option (which syncs with your current chart timeframe), or a "Custom" option where you can enter any timeframe.
Optional Second Asset RSI:
Enable the “Display Second Asset” option to compare another asset’s RSI. Simply select the symbol (default is “DXY”) and choose its timeframe from an identical dropdown. When enabled, the second asset’s RSI is computed and plotted for easy comparison.
RSI Settings:
Customize the RSI length and choose the data source (e.g., close price) to suit your trading strategy.
Visual Aids:
Overbought (70) and oversold (30) levels are clearly marked, along with a midline at 50. These visual cues help you quickly assess market conditions.
Asset Information Table:
A dynamic table at the top of the pane displays the symbols being analysed – the chart’s asset as the “1st” asset and, if enabled, the second asset as the “2nd.”
How to Use:
Apply the Indicator:
Add the indicator to your chart. By default, it will calculate the RSI for the chart’s current asset using your chart’s timeframe.
Adjust Primary Asset Settings:
Use the “Main Asset Timeframe” dropdown to choose the timeframe for the RSI calculation on the chart asset. Select “Chart” to automatically match your current chart’s timeframe or choose a preset/custom timeframe.
Enable and Configure the Second Asset:
Toggle the “Display Second Asset” option to enable the second asset’s RSI. Select the asset symbol and its desired timeframe using the provided dropdown. The RSI for the second asset will be plotted if enabled.
Monitor the RSI Values:
Observe the plotted RSI lines along with the overbought/oversold levels. Use the table at the top-centre of the pane to verify which asset symbols are being displayed.
This versatile tool is designed to support multi-asset analysis and can be a valuable addition to your technical analysis toolkit. Enjoy enhanced RSI comparison across markets and timeframes!
Happy Trading!

Multi Asset & TF Stochastic
Multi Asset & TF Stochastic
This indicator allows you to compare the stochastic oscillator values of two different assets across multiple timeframes in a single pane. It’s designed for traders who want to analyse the momentum of one asset (by default, the chart’s asset) alongside a second asset of your choice (e.g., comparing EURUSD to the USD Index).
How It Works:
Main Asset:
The indicator automatically uses the chart’s asset for the primary stochastic calculation. You have the option to adjust the timeframe for this asset using a dropdown that includes TradingView’s standard timeframes, a "Chart" option (which automatically uses your chart’s timeframe), or a "Custom" option where you can type in any timeframe.
Second Asset:
You can enable the display of a second asset by toggling the “Display Second Asset” option. Choose the asset symbol (default is “DXY”) and select its timeframe from an identical dropdown. When enabled, the script calculates the stochastic oscillator for the second asset, allowing you to compare its momentum (%K and %D lines) with that of the main asset.
Stochastic Oscillator Settings:
Customize the %K length, the smoothing period for %K, and the smoothing period for %D. Both assets’ stochastic values are calculated using these parameters.
Visual Display:
The indicator plots the %K and %D lines for the main asset in prominent colours. If the second asset is enabled, its %K and %D lines are also plotted in different colours. Additionally, overbought (80) and oversold (20) levels are marked, with a midline at 50, making it easier to gauge market conditions at a glance.
%D line can be toggled off for a cleaner view if required:
Asset Information Table:
A table at the top-centre of the pane displays the active asset symbols—ensuring you always know which assets are being analysed.
How to Use:
Apply the Indicator:
Add the script to your chart. By default, it will use the chart’s current asset and timeframe for the primary stochastic oscillator.
Adjust the Main Asset Settings:
Use the “Main Asset Timeframe” dropdown to select a specific timeframe for the main asset or stick with the “Chart” option for automatic syncing with your current chart.
Enable and Configure the Second Asset (Optional):
Toggle on “Display Second Asset” if you wish to compare another asset. Select the desired symbol and adjust its timeframe using the provided dropdown. Choose “Custom” if you need a timeframe not listed by default.
Review the Plots and Table:
Observe the stochastic %K and %D lines for each asset. The overbought/oversold levels help indicate potential market turning points. Check the table at the top-centre to confirm the asset symbols being displayed.
This versatile tool is ideal for traders who rely on momentum analysis and need to quickly compare the stochastic signals of different markets or instruments. Enjoy seamless multi-asset analysis with complete control over your timeframe settings!

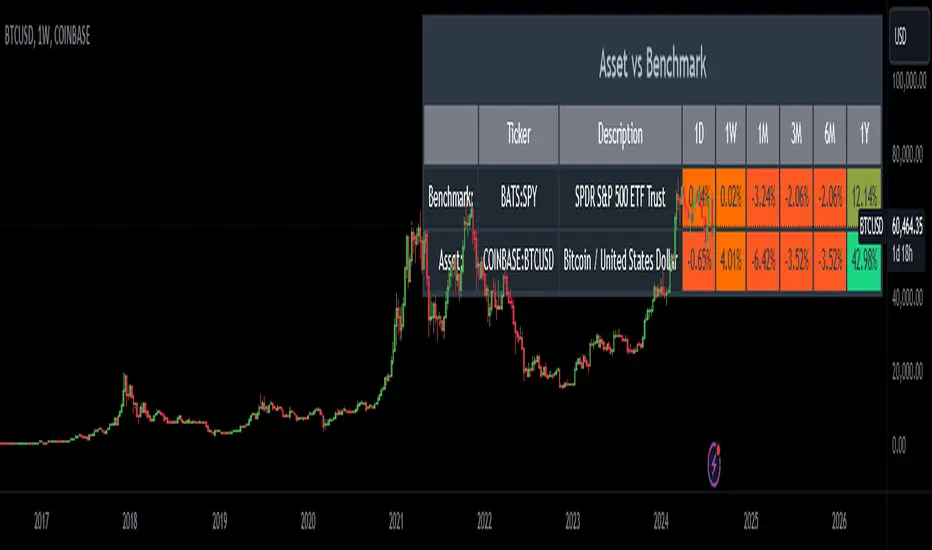
Relative Performance AnalysisRelative Performance Analysis Script
This Pine Script creates a detailed table on your TradingView chart to compare the performance of a specified asset against a benchmark over multiple time frames. The table is fully customizable, allowing you to select its location on the chart and display performance metrics for different periods.
Features:
Customizable Table Location: Choose where the table appears on your chart from a range of predefined positions (e.g., bottom left, top center).
Dynamic Column Headers: The table includes columns for the ticker, description, and performance metrics for various time periods (1 day, 1 week, 1 month, 3 months, 6 months, and 1 year).
Performance Calculation: Calculates the percentage change in performance between the current close price and the previous close price for each time frame.
Color-Coded Performance: Uses a color scheme to highlight performance levels, with specific colors for positive and negative changes to easily visualize performance trends.
Benchmark and Asset Comparison: Displays performance metrics for both a benchmark (e.g., SPY) and the asset currently viewed on the chart, providing a clear comparison.
Inputs:
Benchmark Symbol: Specify the symbol of the benchmark asset (e.g., SPY).
Benchmark Description: Provide a description for the benchmark asset.
Chart Symbol: Automatically uses the symbol of the chart for comparison.
Usage:
Add the script to your TradingView chart.
Configure the benchmark symbol and description as needed.
The table will automatically populate with performance data and be positioned according to your selection.
Disclaimer:
This script is for informational and educational purposes only and is not intended as financial advice. The performance data displayed in the table is based on historical prices and is not indicative of future performance. Trading involves risk, and you should always do your own research and consult with a qualified financial advisor before making any investment decisions. The creator of this script assumes no responsibility for any losses or damages incurred as a result of using this tool.
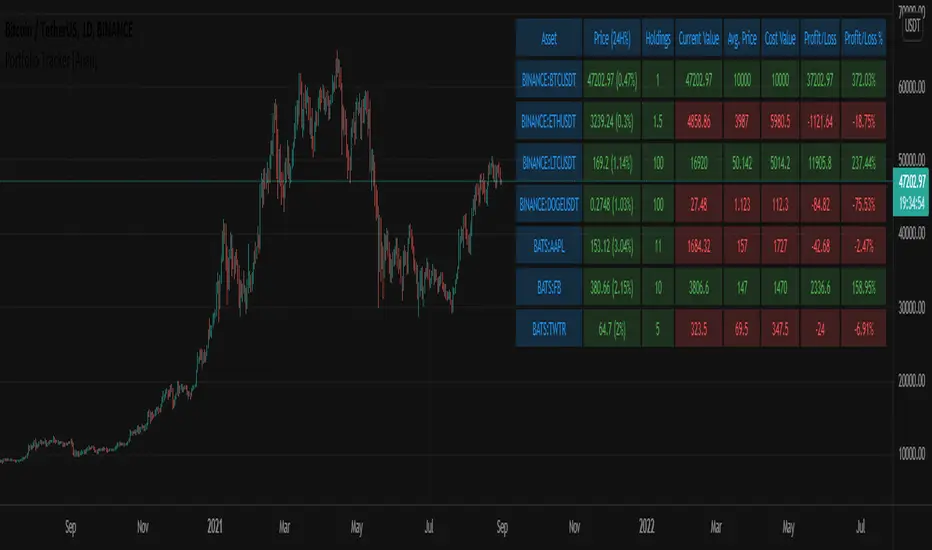
Portfolio Tracker [Anan]█ OVERVIEW
A simple Portfolio Tracker to track your Profit/Loss for any ticker in any market (stock, futures, index, forex, crypto, fund, dr.).
You just need to input (Asset / Quantity / Avg. Buy/Sell Price) and the script will calculate everything.
Also, you can use it for paper trading, or even what-if cases..
█ FEATURES
- Up to 10 positions
- Track your position real-time price and 24H change %
- Calculate your position current value
- Calculate your position cost value
- Calculate Profit/Loss
- Calculate Profit/Loss %
- Change every color in the table as you like.
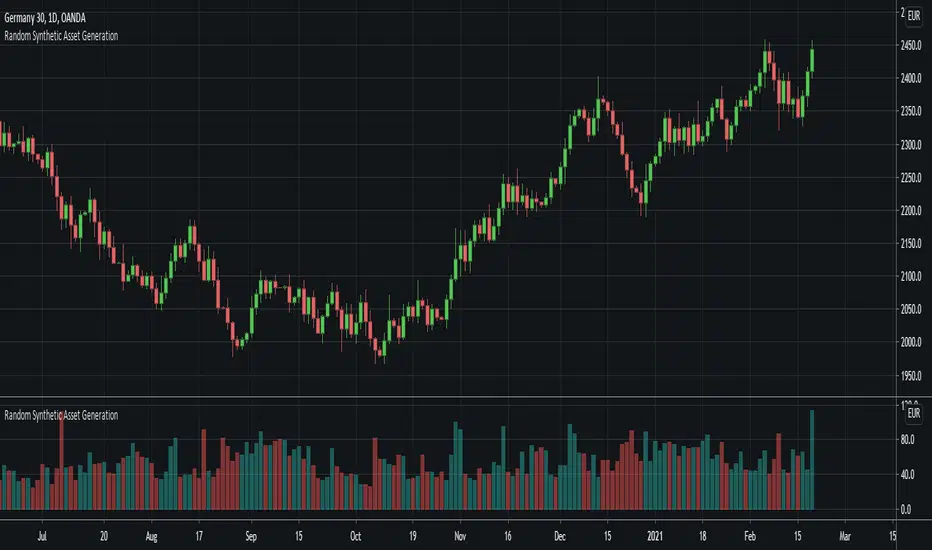
Random Synthetic Asset GenerationThis script generates pseudo-random asset data . Due to the nature of the random generator, it is impossible to use this indicator as input for other indicators because the instance of the script that the indicator is applied to will automatically be different from the instance that is plotted on the chart. Therefore, the idea is to use this script in other scripts (to make it possible to backtest on random data, for example).
The script has four main input parameters.
Random Number Generator Method: It supports two methods for generating the pseudo-random numbers (one by Ricardo Santos and one by Wichmann-Hill).
Seed: You can specify the seed to use. Each unique seed will generate a unique set of pseudo-random data.
Intrabar Volatility: This basically sets how volatile the generated wicks will be (0 = no wicks).
Price Multiplier: This is just a multiplier for the generated price data, so that you can scale up or down the generated price data.
You can also change the colors of the bars.
In addition to this, the indicator also generates random volume. In order to make it possible to show both volume and price, you need to have two identical instances of the indicator. One on the chart, and one in its own panel. Then, go into the Style tab in the indicator settings on the instance in the panel. Untick Up-Candles and Down-Candles boxes, and tick the Volume box.
In a similar manner, you can also plot the true range data and the candle change data as well, by ticking one of those boxes instead.