Absolute Strength Index [ASI] (Zeiierman)█ Overview
The Absolute Strength Index (ASI) is a next-generation oscillator designed to measure the strength and direction of price movements by leveraging percentile-based normalization of historical returns. Developed by Zeiierman, this indicator offers a highly visual and intuitive approach to identifying market conditions, trend strength, and divergence opportunities.
By dynamically scaling price returns into a bounded oscillator (-10 to +10), the ASI helps traders spot overbought/oversold conditions, trend reversals, and momentum changes with enhanced precision. It also incorporates advanced features like divergence detection and adaptive signal smoothing for versatile trading applications.
█ How It Works
The ASI's core calculation methodology revolves around analyzing historical price returns, classifying them into top and bottom percentiles, and normalizing the current price movement within this framework. Here's a breakdown of its key components:
⚪ Returns Lookback
The ASI evaluates historical price returns over a user-defined period (Returns Lookback) to measure recent price behavior. This lookback window determines the sensitivity of the oscillator:
Shorter Lookback: Higher responsiveness to recent price movements, suitable for scalping or high-volatility assets.
Longer Lookback: Smoother oscillator behavior is ideal for identifying larger trends and avoiding false signals.
⚪ Percentile-Based Thresholds
The ASI categorizes returns into two groups:
Top Percentile (Winners): The upper X% of returns, representing the strongest upward price moves.
Bottom Percentile (Losers): The lower X% of returns, capturing the sharpest downward movements.
This percentile-based normalization ensures the ASI adapts to market conditions, filtering noise and emphasizing significant price changes.
⚪ Oscillator Normalization
The ASI normalizes current returns relative to the top and bottom thresholds:
Values range from -10 to +10, where:
+10 represents extreme bullish strength (above the top percentile threshold).
-10 indicates extreme bearish weakness (below the bottom percentile threshold).
⚪ Signal Line Smoothing
A signal line is optionally applied to the ASI using a variety of moving averages:
Options: SMA, EMA, WMA, RMA, or HMA.
Effect: Smooths the ASI to filter out noise, with shorter lengths offering higher responsiveness and longer lengths providing stability.
⚪ Divergence Detection
One of ASI's standout features is its ability to detect and highlight bullish and bearish divergences:
Bullish Divergence: The ASI forms higher lows while the price forms lower lows, signaling potential upward reversals.
Bearish Divergence: The ASI forms lower highs while the price forms higher highs, indicating potential downward reversals.
█ Key Differences from RSI
Dynamic Adaptability: ASI adjusts to market conditions through percentile-based scaling, while RSI uses static thresholds.
█ How to Use ASI
⚪ Trend Identification
Bullish Strength: ASI above zero suggests upward momentum, suitable for trend-following trades.
Bearish Weakness: ASI below zero signals downward momentum, ideal for short trades or exits from long positions.
⚪ Overbought/Oversold Levels
Overbought Zone: ASI in the +8 to +10 range indicates potential exhaustion of bullish momentum.
Oversold Zone: ASI in the -8 to -10 range points to potential reversal opportunities.
⚪ Divergence Signals
Look for bullish or bearish divergence labels to anticipate trend reversals before they occur.
⚪ Signal Line Crossovers
A crossover between the ASI and its signal line (e.g., EMA or SMA) can indicate a shift in momentum:
Bullish Crossover: ASI crosses above the signal line, signaling potential upside.
Bearish Crossover: ASI crosses below the signal line, suggesting downside momentum.
█ Settings Explained
⚪ Absolute Strength Index
Returns Lookback: Sets the sensitivity of the oscillator. Shorter periods detect short-term changes, while longer periods focus on broader trends.
Top/Bottom Percentiles: Adjust thresholds for defining winners and losers. Narrower percentiles increase sensitivity to outliers.
Signal Line Type: Choose from SMA, EMA, WMA, RMA, or HMA for smoothing.
Signal Line Length: Fine-tune the responsiveness of the signal line.
⚪ Divergence
Divergence Lookback: Adjusts the period for detecting divergence. Use longer lookbacks to reduce noise.
-----------------
Disclaimer
The information contained in my Scripts/Indicators/Ideas/Algos/Systems does not constitute financial advice or a solicitation to buy or sell any securities of any type. I will not accept liability for any loss or damage, including without limitation any loss of profit, which may arise directly or indirectly from the use of or reliance on such information.
All investments involve risk, and the past performance of a security, industry, sector, market, financial product, trading strategy, backtest, or individual's trading does not guarantee future results or returns. Investors are fully responsible for any investment decisions they make. Such decisions should be based solely on an evaluation of their financial circumstances, investment objectives, risk tolerance, and liquidity needs.
My Scripts/Indicators/Ideas/Algos/Systems are only for educational purposes!
Asi


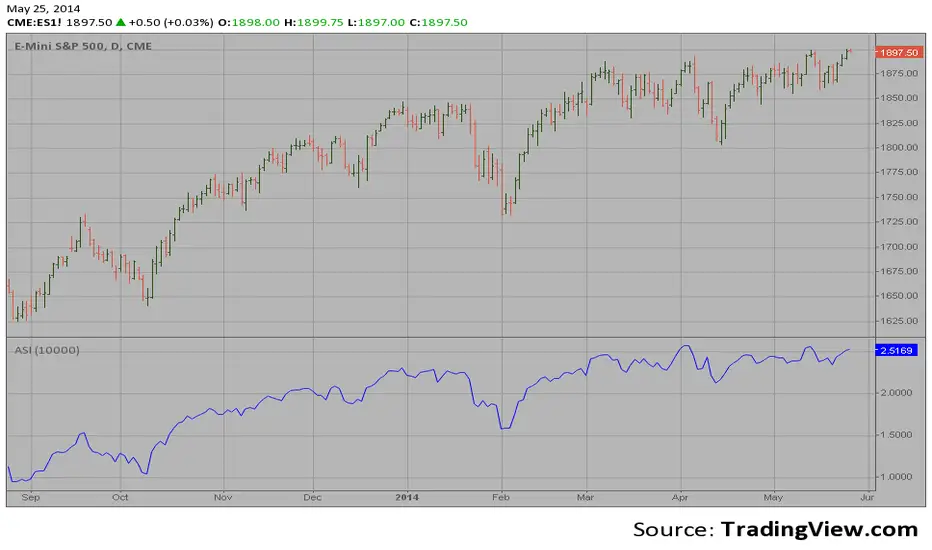
Accumulation Swing IndexPer Investopedia: The ASI is used to gage the long-term trend by comparing bars which contain its opening, closing, high and low prices throughout a period of time. It is a trend finding/confirming tool.
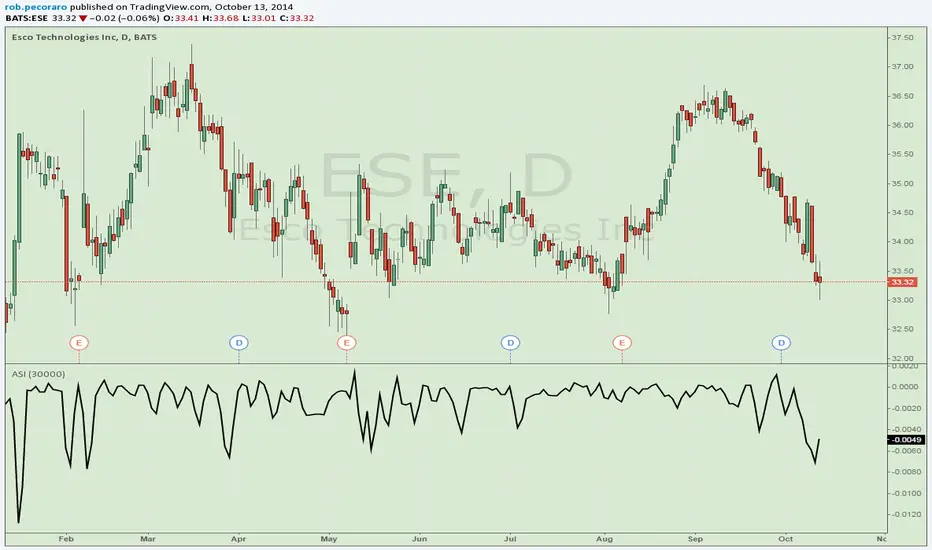
Accumulation Swing Index (ASI) The Accumulation Swing Index is a cumulative total of the Swing Index.
The Accumulation Swing Index was developed by Welles Wilder.
The SwingIndex function was developed to help cut through the maze of
Open, High, Low and Close prices to indicate the real strength and direction
of the market. The Swing Index function looks at the Open, High, Low and
Close values for a two-bar period. The theory is that there are four cross-bar
and one intra-bar comparisons that are strong indicators of an up or down day.
The Swing Index returns a number between -100 and 100. If the factors point toward
an up day, then the function value will be positive and vice versa. In this way,
the Swing Index gives us definite short-term swing points, and it can be used to
supplement other methods as a breakout indicator. A breakout is indicated when the
value of the Accumulation Swing Index (ASI) exceeds the ASI value on the day when a
previous significant High Swing Point was made. A downside breakout is indicated when
the value of the ASI drops below the ASI value on a day when a previous significant
low swing point was made.
Since only futures have a relative daily limit value, this function only makes sense
when applied to a futures contract. If you use this function and it only plots a zero
flat line, check the Daily Limit value.