Gann Octave Pro - Angles & Time Cycles 🎯 Gann Octave Pro - Angles & Time Cycles
## Complete Gann Trading System - Price, Angles & Time in One Indicator
A professional-grade Gann analysis tool combining **Octave Price Levels**, **Gann Angles (1x1, 2x1, 1x2)**, and **Advanced Time Cycle Projections**. Perfect for traders seeking precision market timing through geometric confluence.
---
## 🌟 Key Features
### 📐 Octave Price Levels
- **5 Key Levels**: 0%, 25%, 50%, 75%, 100%
- **Color-Coded**: Green (support) → Blue (50% pivot) → Red (resistance) → Black (boundaries)
- **Dynamic Updates**: Auto-adjusts to swing structure
- **Trading Edge**: 50% level is the most powerful reversal zone
### 📏 Gann Angles
- **1x1 Angle** (Black) - Natural 45° trend line
- **2x1 Angle** (Red) - Steep acceleration zone
- **1x2 Angle** (Red) - Gradual support/resistance
- **Customizable Extension**: Fixed bars or % of swing length
### ⏰ Advanced Time Cycles
**Three Calculation Methods:**
1. **Angle-Level Confluence** ⭐ (Recommended)
- Calculates intersections of Gann angles with octave levels
- Most sophisticated timing system
- Based on price-time geometry
2. **Swing Duration** - Uses actual swing bar length
3. **Harmonic (Swing/8)** - Classic Gann harmonic division
**Cycle Visualization:**
- **Full Cycles** (Purple, solid) - Major turning points, labeled "◆ FC1 (176 bars) "
- **Sub-Cycles** (Blue, dotted) - Minor pivots, labeled "S1 "
- **Mid-Cycles** (Orange, dashed) - Half-cycle inflection points
- **Past Display**: Shows 4 complete past cycles for validation
- **Future Projection**: Projects 8 future cycles for anticipation
---
## 🎯 How to Use
### Quick Start
1. Apply to chart (works all timeframes/instruments)
2. Select period: Default 44 bars (adjust based on timeframe)
3. Choose cycle method: "Angle-Level Confluence" for best results
4. Observe past cycles to validate timing accuracy
### Trading Strategies
**Triple Confluence Setup** (Highest Probability)
- Price at octave level (especially 50%)
- Price touches Gann angle (1x1 most reliable)
- Time cycle arrives (full cycle preferred)
- **Entry**: On confluence | **Stop**: Below/above octave level | **Target**: Next level
**Cycle Anticipation**
- Enter 1-2 bars before cycle line if price at octave level
- Exit at next cycle or target octave level
- **Edge**: Anticipate cycles instead of reacting
**Angle Breakout + Cycle**
- Price breaks 1x1 angle + next cycle within 20 bars
- Hold through cycle, exit at 2x1 angle or next major level
---
## ⚙️ Customization
### Period Selection (88-Based)
11 harmonic options: 3, 6, 11, 22, **44**, 88, 176, 352, 704, 1408, 2816 bars
- **Intraday** (15m-1h): Period 3-4
- **Swing Trading** (4h-Daily): Period 4-5
- **Position Trading** (Daily-Weekly): Period 5-6
### Visual Controls
- **Colors**: Independent for all elements
- **Line Widths**: Separate controls (1-5) for levels, angles, cycles
- **Label Size**: Tiny/Small/Normal/Large (unified)
- **Label Position**: Top/Middle/Bottom
- **Show/Hide**: Toggle any component
### Alerts
- 50% octave level breakouts
- Customizable messages
---
## 💡 Pro Tips
1. **Validate First**: Observe 2-3 past cycles before trading
2. **Adjust to Volatility**: High volatility = lower period (22-44), Low = higher (88-176)
3. **Multiple Timeframes**: Apply on different timeframes for confirmation
4. **Respect 50% Level**: Most powerful reversal zone in Gann theory
5. **Focus on Full Cycles**: Highest probability setups (◆ FC markers)
6. **Combine with Price Action**: Indicator shows WHERE/WHEN, price action shows HOW
---
## 🚀 What Makes It Unique
✅ **Intelligent Confluence Cycles** - Unique angle-level intersection calculation
✅ **Historical Validation** - See past cycles to trust future projections
✅ **Professional Design** - Color-coded hierarchy, clean labels, no clutter
✅ **Complete Automation** - Everything updates in real-time
✅ **Three-Dimensional Analysis** - Price + Angles + Time = complete picture
---
## 📊 Best Markets
- Stock indices (S&P 500, NASDAQ, Dow)
- Forex majors (EUR/USD, GBP/USD, USD/JPY)
- Commodities (Gold, Silver, Oil)
- Crypto (BTC, ETH)
- Liquid stocks
✅ Complete Gann system (price + angles + time)
✅ 3 time cycle methods
✅ Auto swing detection
✅ 4 past + 8 future cycle projections
✅ Professional visualization
✅ Extensive customization
✅ Real-time alerts
✅ Works all markets/timeframes
---
## ⚠️ Disclaimer
This indicator is for educational purposes and applies W.D. Gann methodology principles. Not financial advice. Always use proper risk management, position sizing, and stop losses. Practice on paper before live trading. Past performance doesn't guarantee future results.
---
**The market moves in patterns of price and time. This indicator helps you see them.**
Trade with geometry. Trade with time. Trade with confidence.
Angles

Gann Octave 8 Ver.2.0Gann Octave 8 Ver.2.0 - Complete Trading Guide
Overview
This indicator combines W.D. Gann's time-tested principles of market geometry with modern technical analysis. It identifies key market structures and projects precise support/resistance levels along with angular momentum lines to help traders identify high-probability trading opportunities.
________________________________________
Core Concepts
1. Gann's Octave Division (The Rule of 8)
W.D. Gann discovered that markets move in harmonic divisions based on the number 8. This indicator divides any swing movement into 8 equal parts (octaves):
• 0% - Swing extreme (High for bearish, Low for bullish)
• 12.5% - First octave
• 25% - Quarter level
• 37.5% - Three-eighths level
• 50% - Midpoint (most critical level)
• 62.5% - Five-eighths level
• 75% - Three-quarter level
• 87.5% - Seventh octave
• 100% - Swing extreme (opposite end)
Why 8? Gann believed natural market cycles follow mathematical harmonics. The octave division provides precise entry and exit points that frequently act as support/resistance zones.
2. Gann Angles (Price-Time Relationship)
Gann angles represent the relationship between price movement and time. Each angle shows different momentum levels:
• 1x1 (Black) - 45° angle, perfect balance between price and time. Most important Gann angle. Represents the natural trend line.
• 2x1 (Red) - Steeper angle, 2 units of price per 1 unit of time. Shows strong momentum.
• 1x2 (Red) - Flatter angle, 1 unit of price per 2 units of time. Shows weak momentum.
• 4x1 & 1x4 (Blue) - Even more extreme angles indicating very strong or very weak trends.
• 8x1 & 1x8 (Orange) - Most extreme angles, parabolic moves or complete consolidation.
Key Principle: When price is above the 1x1 angle = bullish. Below 1x1 = bearish. When price crosses from one angle to another, it signals a change in momentum.
________________________________________
How the Indicator Works
Structure Detection
The indicator automatically identifies market swings using pivot points:
1. Bullish Structure (Green): Detected when price makes a higher high
o Octave levels calculated from swing low (0%) to swing high (100%)
o Gann angles project upward from the swing low
2. Bearish Structure (Red): Detected when price makes a lower low
o Octave levels calculated from swing high (0%) to swing low (100%)
o Gann angles project downward from the swing high
Dynamic Updates
• Swing Tracker ON: Levels update continuously as the swing evolves
• Swing Tracker OFF: Levels lock at the initial swing detection (cleaner charts)
Historical Structures
The indicator maintains previous swing structures based on "Number of Swings to Show":
• Set to 1: Only current structure (cleanest)
• Set to 2-3: Current + recent history (recommended for context)
• Set to 4+: Multiple historical structures (may overlap but shows pattern)
________________________________________
Trading Strategy
Entry Signals
BUY SIGNALS (Green Triangle Up ▲)
Signal 1: Bounce from Support Levels
• Price drops to 0%, 50%, or 100% level and reverses
• Best when combined with bullish candlestick pattern (hammer, engulfing)
• Entry: On signal confirmation
• Stop Loss: Below the support level (0.5-1% below)
• Target: Next octave level up (12.5%, 25%, 50%)
Signal 2: Breakout Above Resistance
• Price breaks above 50% or 100% level with momentum
• Confirms trend continuation or reversal
• Entry: On close above the level
• Stop Loss: Below the breakout level
• Target: Previous swing high or next major level
Signal 3: Gann Angle Support
• Price bounces off 1x1 angle (black line)
• Indicates trend is intact
• Entry: When price respects the angle
• Stop Loss: Below the 1x1 angle
• Target: Next resistance level
SELL SIGNALS (Red Triangle Down ▼)
Signal 1: Rejection from Resistance Levels
• Price rallies to 0%, 50%, or 100% level and reverses
• Best when combined with bearish candlestick pattern (shooting star, bearish engulfing)
• Entry: On signal confirmation
• Stop Loss: Above the resistance level (0.5-1% above)
• Target: Next octave level down (87.5%, 75%, 50%)
Signal 2: Breakdown Below Support
• Price breaks below 50% or 0% level with momentum
• Confirms trend continuation or reversal
• Entry: On close below the level
• Stop Loss: Above the breakdown level
• Target: Previous swing low or next major level
Signal 3: Gann Angle Resistance
• Price fails at 1x1 angle (black line)
• Indicates trend weakness
• Entry: When price rejects the angle
• Stop Loss: Above the 1x1 angle
• Target: Next support level
________________________________________
Advanced Trading Techniques
1. The 50% Rule (Most Powerful)
The 50% octave level is the most critical in Gann theory:
• In Uptrend: Price should not break below 50% retracement. If it holds = trend intact, go long.
• In Downtrend: Price should not break above 50% retracement. If it holds = trend intact, go short.
• Reversal: Breaking and closing beyond 50% often signals trend reversal.
2. Gann Angle Confluence
When multiple Gann angles converge with octave levels = HIGH probability zone:
• Look for price to bounce or reverse at these zones
• Example: 1x2 angle meets 50% level = strong support/resistance
• These zones often become pivot points
3. Multiple Timeframe Analysis
• Use higher timeframe (daily) for major structure
• Use lower timeframe (5min, 15min) for precise entries
• Take trades when both timeframes align
4. Swing Failure Pattern
• Price breaks a key level (e.g., 50%) but quickly reverses back
• This "false breakout" often leads to strong move in opposite direction
• Wait for signal in the reversal direction
________________________________________
Settings Optimization
For Day Trading (Scalping)
• Structure Period: 0-2 (22 bars or less)
• Number of Swings: 1 (only current structure)
• Signal Sensitivity: High
• Swing Tracker: OFF (cleaner)
For Swing Trading
• Structure Period: 4-5 (44-88 bars)
• Number of Swings: 2-3
• Signal Sensitivity: Medium
• Swing Tracker: ON or OFF (preference)
For Position Trading
• Structure Period: 6-8 (176+ bars)
• Number of Swings: 3-5
• Signal Sensitivity: Low
• Swing Tracker: ON
________________________________________
Common Patterns to Watch
Bullish Reversal Setup
1. Price in bearish structure (red levels)
2. Price drops to 100% level (swing low)
3. Buy signal appears (green triangle)
4. Price breaks back above 50% level
5. Action: Go long with stop below 100%
Bearish Reversal Setup
1. Price in bullish structure (green levels)
2. Price rises to 100% level (swing high)
3. Sell signal appears (red triangle)
4. Price breaks back below 50% level
5. Action: Go short with stop above 100%
Trend Continuation
1. Price respects 1x1 Gann angle
2. Small pullback to 25% or 37.5% level
3. Buy/sell signal appears
4. Action: Enter in trend direction
________________________________________
________________________________________
Signal Sensitivity Guide
• Low: Conservative, only major breakouts (3-5 signals per day)
• Medium: Balanced, includes approaches (5-10 signals per day)
• High: Aggressive, includes bounces (10-20 signals per day)
Choose based on your trading style and risk tolerance
________________________________________
Final Words
This indicator is a powerful tool, but remember:
"The market is never wrong. Opinions are." - W.D. Gann
• No indicator is 100% accurate
• Always combine with price action and volume
• Backtest on your instrument and timeframe
• Keep learning and adapting your strategy
• Discipline and risk management are more important than the perfect setup
Happy Trading! 📈

MA SMART Angle
### 📊 WHAT IS MA SMART ANGLE?
**MA SMART Angle** is an advanced momentum and trend detection indicator that analyzes the angles (slopes) of multiple moving averages to generate clear, non-repainting BUY and SELL signals.
**Original Concept Credit:** This indicator builds upon the "MA Angles" concept originally created by **JD** (also known as Duyck). The core angle calculation methodology and Jurik Moving Average (JMA) implementation by **Everget** are preserved from the original open-source work. The angle calculation formula was contributed by **KyJ**. This enhanced version is published with respect to the open-source nature of the original indicator.
Original indicator reference: "ma angles - JD" by Duyck
---
## 🎯 ORIGINALITY & VALUE PROPOSITION
### **What Makes This Different from the Original:**
While the original "MA Angles" by **JD** provided excellent angle visualization, it lacked actionable entry signals. **MA SMART Angle** addresses this by adding:
**1. Clear Entry/Exit Signals**
- Explicit BUY/SELL arrows based on angle crossovers, momentum confirmation, and MA alignment
- No guessing when to enter trades - the indicator tells you exactly when conditions align
**2. Non-Repainting Logic**
- All signals use confirmed historical data (shifted by 2 bars minimum)
- Critical for backtesting reliability and live trading confidence
- Original indicator could repaint signals on current bar
**3. Dual Signal System**
- **Simple Mode:** More frequent signals based on angle crossovers + momentum (for active traders)
- **Strict Mode:** Requires full multi-MA alignment + momentum confirmation (for conservative traders)
- Adaptable to different trading styles and risk tolerances
**4. Smart Signal Filtering**
- **Anti-spam cooldown:** Prevents duplicate signals within configurable bar count
- **No-trade zone detection:** Filters out low-conviction sideways markets automatically
- **Multi-timeframe MA alignment:** Ensures all moving averages agree on direction before signaling
**5. Enhanced Visualization**
- Large, clear BUY/SELL arrows with descriptive labels
- Color-coded backgrounds for market states (trending vs. ranging)
- Momentum histogram showing acceleration/deceleration in real-time
- Live status table displaying trend strength, angle value, momentum, and MA alignment
**6. Professional Alert System**
- Four distinct alert conditions: BUY Signal, SELL Signal, Strong BUY, Strong SELL
- Enables automated trade notifications and strategy integration
**7. Modified MA Periods**
- Original used EMA(27), EMA(83), EMA(278)
- Enhanced version uses faster EMA(3), EMA(8), EMA(13) for more responsive signals
- Better suited for modern volatile markets and shorter timeframes
---
## 📐 HOW IT WORKS - TECHNICAL EXPLANATION
### **Core Methodology:**
The indicator calculates angles (slopes) for five key moving averages:
- **JMA (Jurik Moving Average)** - Smooth, lag-reduced trend line (original implementation by **Everget**)
- **JMA Fast** - Responsive momentum indicator with higher power parameter
- **MA27 (EMA 3)** - Primary fast-moving average for signal generation
- **MA83 (EMA 8)** - Medium-term trend confirmation
- **MA278 (EMA 13)** - Slower trend filter
### **Angle Calculation Formula (by KyJ):**
```
angle = arctan((MA - MA ) / ATR(14)) × (180 / π)
```
**Why ATR normalization?**
- Makes angles comparable across different instruments (forex, stocks, crypto)
- Makes angles comparable across different timeframes
- Accounts for volatility - a 10-point move in different assets has different significance
**Angle Interpretation:**
- **> 15°** = Strong trend (momentum accelerating)
- **0° to 15°** = Weak trend (momentum present but moderate)
- **-2° to +2°** = No-trade zone (sideways/choppy market)
- **< -15°** = Strong downtrend
### **Signal Generation Logic:**
#### **BUY Signal Conditions:**
1. MA27 angle crosses above 0° (upward momentum initiates)
2. All three EMAs (3, 8, 13) pointing upward (trend alignment confirmed)
3. Momentum is positive for 2+ bars (acceleration, not deceleration)
4. Angle exceeds minimum threshold (not in no-trade zone)
5. Cooldown period passed (prevents signal spam)
#### **SELL Signal Conditions:**
1. MA27 angle crosses below 0° (downward momentum initiates)
2. All three EMAs pointing downward (downtrend alignment)
3. Momentum is negative for 2+ bars
4. Angle below negative threshold (not in no-trade zone)
5. Cooldown period passed
#### **Strong BUY+ / SELL+ Signals:**
Additional entry opportunities when JMA Fast crosses JMA Slow while maintaining strong directional angle - indicates momentum acceleration within established trend.
---
## 🔧 HOW TO USE
### **Recommended Settings by Trading Style:**
**Scalpers / Day Traders:**
- Signal Type: **Simple**
- Minimum Angle: **3-5°**
- Cooldown Bars: **3-5 bars**
- Timeframes: 1m, 5m, 15m
**Swing Traders:**
- Signal Type: **Strict**
- Minimum Angle: **7-10°**
- Cooldown Bars: **8-12 bars**
- Timeframes: 1H, 4H, Daily
**Position Traders:**
- Signal Type: **Strict**
- Minimum Angle: **10-15°**
- Cooldown Bars: **15-20 bars**
- Timeframes: Daily, Weekly
### **Parameter Descriptions:**
**1. Source** (default: OHLC4)
- Price data used for MA calculations
- OHLC4 provides smoothest angles
- Close is more responsive but noisier
**2. Threshold for No-Trade Zones** (default: 2°)
- Angles below this are considered sideways/ranging
- Increase for stricter filtering of choppy markets
- Decrease to allow signals in quieter trending periods
**3. Signal Type** (Simple vs. Strict)
- **Simple:** Angle crossover OR (trend + momentum)
- **Strict:** Angle crossover AND all MAs aligned AND momentum confirmed
- Start with Simple, switch to Strict if too many false signals
**4. Minimum Angle for Signal** (default: 5°)
- Only generate signals when angle exceeds this threshold
- Higher values = stronger trends required
- Lower values = more sensitive to momentum changes
**5. Cooldown Bars** (default: 5)
- Minimum bars between consecutive signals
- Prevents spam during volatile chop
- Scale with your timeframe (higher TF = more bars)
**6. Color Bars** (default: true)
- Colors chart bars based on signal state
- Green = bullish conditions, Red = bearish conditions
- Can disable if you prefer clean price bars
**7. Background Colors**
- **Yellow background** = No-trade zone (low angle, ranging market)
- **Green flash** = BUY signal generated
- **Red flash** = SELL signal generated
- All customizable or can be disabled
---
## 📊 INTERPRETING THE INDICATOR
### **Visual Elements:**
**Main Chart Window:**
- **Thick Lime/Fuchsia Line** = MA27 angle (primary signal line)
- **Medium Green/Red Line** = MA83 angle (trend confirmation)
- **Thin Green/Red Line** = MA278 angle (slow trend filter)
- **Aqua/Orange Line** = JMA Fast (momentum detector)
- **Green/Red Area** = JMA slope (overall trend context)
- **Blue/Purple Histogram** = Momentum (angle acceleration/deceleration)
**Signal Arrows:**
- **Large Green ▲ "BUY"** = Primary buy signal (all conditions met)
- **Small Green ▲ "BUY+"** = Strong momentum buy (JMA fast cross)
- **Large Red ▼ "SELL"** = Primary sell signal (all conditions met)
- **Small Red ▼ "SELL+"** = Strong momentum sell (JMA fast cross)
**Status Table (Top Right):**
- **Angle:** Current MA27 angle in degrees
- **Trend:** Classification (STRONG UP/DOWN, UP/DOWN, FLAT)
- **Momentum:** Acceleration state (ACCEL UP/DN, Up/Down)
- **MAs:** Alignment status (ALL UP/DOWN, Mixed)
- **Zone:** Trading zone status (ACTIVE vs. NO TRADE)
- **Last:** Bars since last signal
### **Trading Strategies:**
**Strategy 1: Pure Signal Following**
- Enter LONG on BUY signal
- Exit on SELL signal
- Use stop-loss at recent swing low/high
- Works best on trending instruments
**Strategy 2: Confirmation with Price Action**
- Wait for BUY signal + bullish candlestick pattern
- Wait for SELL signal + bearish candlestick pattern
- Increases win rate by filtering premature signals
- Recommended for beginners
**Strategy 3: Momentum Acceleration**
- Use BUY+/SELL+ signals for adding to positions
- Only take these in direction of primary signal
- Scalp quick moves during momentum spikes
- For experienced traders
**Strategy 4: Mean Reversion in No-Trade Zones**
- When status shows "NO TRADE", fade extremes
- Wait for angle to exit no-trade zone for reversal
- Contrarian approach for range-bound markets
- Requires tight stops
---
## ⚠️ LIMITATIONS & DISCLAIMERS
**What This Indicator DOES:**
✅ Measures momentum direction and strength via angle analysis
✅ Generates signals when multiple conditions align
✅ Filters out low-conviction sideways markets
✅ Provides visual clarity on trend state
**What This Indicator DOES NOT:**
❌ Predict future price movements with certainty
❌ Guarantee profitable trades (no indicator can)
❌ Work equally well on all instruments/timeframes
❌ Replace proper risk management and position sizing
**Known Limitations:**
- **Lagging Nature:** Like all moving averages, signals occur after momentum begins
- **Whipsaw Risk:** Can generate false signals in volatile, directionless markets
- **Optimization Required:** Parameters need adjustment for different assets
- **Not a Complete System:** Should be combined with risk management, position sizing, and other analysis
**Best Performance Conditions:**
- Strong trending markets (crypto bull runs, stock breakouts)
- Liquid instruments (major forex pairs, large-cap stocks)
- Appropriate timeframe selection (match to trading style)
- Used alongside support/resistance and volume analysis
---
## 🔔 ALERT SETUP
The indicator includes four alert conditions:
**1. BUY SIGNAL**
- Message: "MA SMART Angle: BUY SIGNAL! Angle crossed up with momentum"
- Use for: Primary long entries
**2. SELL SIGNAL**
- Message: "MA SMART Angle: SELL SIGNAL! Angle crossed down with momentum"
- Use for: Primary short entries or long exits
**3. Strong BUY**
- Message: "MA SMART Angle: Strong BUY momentum - JMA fast crossed up"
- Use for: Adding to longs or aggressive entries
**4. Strong SELL**
- Message: "MA SMART Angle: Strong SELL momentum - JMA fast crossed down"
- Use for: Adding to shorts or aggressive exits
**Setting Up Alerts:**
1. Right-click indicator → "Add Alert on MA SMART Angle"
2. Select desired condition from dropdown
3. Choose notification method (popup, email, webhook)
4. Set alert expiration (typically "Once Per Bar Close")
---
## 📚 EDUCATIONAL VALUE
This indicator serves as an excellent learning tool for understanding:
**1. Angle-Based Momentum Analysis**
- Traditional indicators show MA crossovers
- This shows the *rate of change* (velocity) of MAs
- Teaches traders to think in terms of momentum acceleration
**2. Multi-Timeframe Confirmation**
- Shows how fast, medium, and slow MAs interact
- Demonstrates importance of trend alignment
- Helps develop patience for high-probability setups
**3. Signal Quality vs. Quantity Tradeoff**
- Simple mode = more signals, more noise
- Strict mode = fewer signals, higher quality
- Teaches discretionary filtering skills
**4. Market State Recognition**
- Visual distinction between trending and ranging markets
- Helps traders avoid trading choppy conditions
- Develops "market context" awareness
---
## 🔄 DIFFERENCES FROM OTHER MA INDICATORS
**vs. Traditional MA Crossovers:**
- Measures momentum (angle) rather than just price crossing MA
- Provides earlier signals as angles change before price crosses
- Filters better for sideways markets using no-trade zones
**vs. MACD:**
- Uses multiple MAs instead of just two
- ATR normalization makes it universal across instruments
- Visual angle representation more intuitive than histogram
**vs. Supertrend:**
- Not based on ATR bands but on MA slope analysis
- Provides graduated strength indication (not just binary trend)
- Less prone to whipsaw in low volatility
**vs. Original "MA Angles" by JD:**
- Adds explicit entry/exit signals (original had none)
- Implements no-repaint logic for reliability
- Includes signal filtering and quality controls
- Provides dual signal systems (Simple/Strict)
- Enhanced visualization and status monitoring
- Uses faster MA periods (3/8/13 vs 27/83/278) for modern markets
---
## 📖 CODE STRUCTURE (for Pine Script learners)
This indicator demonstrates:
**Advanced Pine Script Techniques:**
- Custom function implementation (JMA, angle calculation)
- Var declarations for stateful tracking
- Table creation for HUD display
- Multi-condition signal logic
- Alert system integration
- Proper use of historical references for no-repaint
**Code Organization:**
- Modular function definitions (JMA, angle)
- Clear separation of concerns (inputs, calculations, plotting, alerts)
- Extensive commenting for maintainability
- Best practices for Pine Script v5
**Learning Resources:**
- Study the JMA function to understand adaptive smoothing
- Examine angle calculation for ATR normalization technique
- Review signal logic for multi-condition confirmation patterns
- Analyze anti-spam filtering for state management
The code is open-source - feel free to study, modify, and improve upon it!
---
## 🙏 CREDITS & ATTRIBUTION
**Original Concepts:**
- **"ma angles - JD" by JD (Duyck)** - Core angle calculation methodology and indicator concept
Original open-source indicator on TradingView Community Scripts
- **JMA (Jurik Moving Average) implementation by Everget** - Smooth, low-lag moving average function
Acknowledged in original JD indicator code
- **Angle Calculation formula by KyJ** - Mathematical formula for converting MA slope to degrees using ATR normalization
Acknowledged in original JD indicator code comments
**Enhancements in This Version:**
- Signal generation logic - Original implementation for this indicator
- No-repaint confirmation system - Original implementation
- Dual signal modes (Simple/Strict) - Original implementation
- Visual enhancements and status table - Original implementation
- Alert system and signal filtering - Original implementation
- Modified MA periods (3/8/13 instead of 27/83/278) - Optimization for modern markets
**Open Source Philosophy:**
This indicator follows the open-source spirit of TradingView and the Pine Script community. The original "ma angles - JD" by JD (Duyck) was published as open-source, enabling this enhanced version. Similarly, this code is published as open-source to allow further community improvements.
---
## ⚡ QUICK START GUIDE
**For New Users:**
1. Add indicator to chart
2. Start with default settings (Simple mode)
3. Wait for BUY signal (green arrow)
4. Observe how price behaves after signal
5. Check status table to understand market state
6. Adjust parameters based on your instrument/timeframe
**For Experienced Traders:**
1. Switch to Strict mode for higher quality signals
2. Increase cooldown bars to reduce frequency
3. Raise minimum angle threshold for stronger trends
4. Combine with your existing strategy for confirmation
5. Set up alerts for desired signal types
6. Backtest on your preferred instruments
---
## 🎓 RECOMMENDED COMBINATIONS
**Works Well With:**
- **Volume Analysis:** Confirm signals with volume spikes
- **Support/Resistance:** Take signals near key levels
- **RSI/Stochastic:** Avoid overbought/oversold extremes
- **ATR:** Size positions based on volatility
- **Price Action:** Wait for candlestick confirmation
**Complementary Indicators:**
- Order Flow / Footprint (for institutional confirmation)
- Volume Profile (for identifying value areas)
- VWAP (for intraday mean reversion reference)
- Fibonacci Retracements (for target setting)
---
## 📈 PERFORMANCE EXPECTATIONS
**Realistic Win Rates:**
- Simple Mode: 45-55% (higher frequency, moderate accuracy)
- Strict Mode: 55-65% (lower frequency, higher accuracy)
- Combined with price action: 60-70%
**Best Asset Classes:**
1. **Cryptocurrencies** (strong trends, clear signals)
2. **Forex Major Pairs** (smooth price action, good angles)
3. **Large-Cap Stocks** (trending behavior, liquid)
4. **Index Futures** (trending instruments)
**Challenging Conditions:**
- Low volatility consolidation periods
- News-driven erratic movements
- Thin/illiquid instruments
- Counter-trending markets
---
## 🛡️ RISK DISCLAIMER
**IMPORTANT LEGAL NOTICE:**
This indicator is for **educational and informational purposes only**. It is **NOT financial advice** and does not constitute a recommendation to buy or sell any financial instrument.
**Trading Risks:**
- Trading carries substantial risk of loss
- Past performance does not guarantee future results
- No indicator can predict market movements with certainty
- You can lose more than your initial investment (especially with leverage)
**User Responsibilities:**
- Conduct your own research and due diligence
- Understand the instruments you trade
- Never risk more than you can afford to lose
- Use proper position sizing and risk management
- Consider consulting a licensed financial advisor
**Indicator Limitations:**
- Signals are based on historical data only
- No guarantee of accuracy or profitability
- Parameters must be optimized for your specific use case
- Results vary significantly by market conditions
By using this indicator, you acknowledge and accept all trading risks. The author is not responsible for any financial losses incurred through use of this indicator.
---
## 📧 SUPPORT & FEEDBACK
**Found a bug?** Please report it in the comments with:
- Chart symbol and timeframe
- Parameter settings used
- Description of unexpected behavior
- Screenshot if possible
**Have suggestions?** Share your ideas for improvements!
**Enjoying the indicator?** Leave a like and follow for updates!

Gann Single Square Swing Trading System with Gann AnglesGann Single Square Swing Trading System
This script automatically detects "squares" - geometric patterns where price movement equals time movement. When price moves the same distance as the number of bars (time), it creates powerful support/resistance levels based on Gann theory.
Key Visual Elements
• Box: The detected square pattern
• Dark Blue Line (50%): Most important trading level
• Green Lines: Profit target levels (125%, 150%)
• Red Lines: Stop loss levels (-25%, -50%)
• Colored Angle Lines: Gann angles for trend direction
• Quality Score: Blue label showing setup strength (aim for 70%+)
Simple Trading Rules
LONG Trades (Green 🟢 Square)
1. Entry: Buy when price touches the dark blue 50% line from above
2. Stop Loss: Place below the red -25% line
3. Take Profit: Exit at green 125% line (first target) or 150% line (second target)
SHORT Trades (Red 🔴 Square)
1. Entry: Sell when price touches the dark blue 50% line from below
2. Stop Loss: Place above the red -25% line
3. Take Profit: Exit at green 125% line (first target) or 150% line (second target)
Entry Checklist
✅ Square quality score > 70%
✅ Price touches 50% level (dark blue line)
✅ Volume above average (if volume filter enabled)
✅ Clear square formation visible
Alerts
The script generates automatic alerts when price reaches the 50% trading level. Enable alerts in TradingView to get notified of setups.
Bottom Line: Wait for the alert → Check quality score → Enter at 50% level → Set stop at red line → Take profit at green line.

Trend Lines [LuxAlgo]Our new "Trend Lines" indicator detects and highlights relevant trendlines on the user chart while keeping it free of as much clutter as possible.
The indicator is thought for real-time usage and includes several filters as well as the ability to estimate trendline angles.
🔶 USAGE
Trendlines can act as support/resistance, with a higher number of tests indicating a more significant support/resistance role.
A broken TrendLine can be indicative of a potential trend reversal. The script highlights breaks with a label.
Users can additionally filter trendlines, only showing trendlines whose angles fall within a user set range:
This allows for the removal of potential clutter from the chart but also helps keep steeper or more horizontal trendlines.
🔶 DETAILS
When a swing (pivot point) is found, a Trendline is drawn when certain conditions are fulfilled.
An essential condition is that a Bearish Trendline (red) always occurs on a lower high, while a Bullish Trendline (blue) occurs on a higher low.
Our implementation will first show an initial dotted-styled TrendLine on confirmation, after which a solid-styled secondary TrendLine will develop. The latter will be used for the real-time detection of breaks at that line:
Furthermore, the script allows you to add more conditions:
🔹 Length (Swings)
A swing develops when a high/low is the highest/lowest against x highs/lows on the left AND right of that bar. x can be set by "Length" in settings.
The following images clarify this. The script confirms a swing where the yellow flag is shown; the high (here visualized with a purple label) is the highest point against x bars left and right of that point.
At that moment, this swing is checked against the previous swing. If all conditions are fulfilled, an initial TrendLine is drawn on confirmation.
After that point, a secondary thicker solid line is seen which keeps progressing bar after bar, until:
• a new TrendLine is formed
• the TrendLine is broken
🔹 Breaks between Swings
Once there is confirmation that a TrendLine can be drawn, the script allows you to filter for breakthroughs on that line. This can be set with "Check breaks between"
Disabled : the initial TrendLine is allowed to be pierced:
Check breaks between point A - point B : no breaks are allowed between both Swing points:
Point A - Current bar : no breaks are allowed between the first Swing point and the point of confirmation ('current' bar):
🔹 TrendLine breaks
As mentioned, the secondary TrendLine (solid line) progresses bar after bar until a new TrendLine is formed or the TrendLine is broken. When a TrendLine is broken, the TrendLine stops progressing, but if there isn't a new TrendLine and price return back, the TrendLine will re-appear, potentially giving several signals when the TrendLine is broken again.
Minimal bars allow you to regulate the amount of signals when the TrendLine is broken.
-> The secondary TrendLine must be uninterrupted for at least x bars before a potential break can be considered.
The following example shows 1 signal against 3 by adjusting this setting from 2 to 5:
🔹 Angles
Angles should normally be calculated when the units of the X and Y axis are the same. However, on our charts, the unit of the X-axis is bar_index (bars), and on the Y-axis the unit is price (¥, €, £, $,...).
It is not easy to normalize and create reasonably valid angles. Often certain angle calculations can differ through price changes or volatility.
Our calculate_slope() function tries to make corresponding angles through all bars.
We do this by calculating the difference between the highest/lowest price values in a certain bar range. The bar range is our X-axis, and the price difference is our Y-axis.
Zooming in/out will not change the amount of bars or the price. Since it does change our view on the chart, and thereby how we see the angles, we have included a setting where you can personalize the ratio between X and Y-axis (Angles -> Ratio X-Y axis).
Settings: Angles - Ratio X-Y axis:
🔶 SETTINGS
🔹 Swings
Length: Lookback period for the detection of swing points.
🔹 Trendline validation
Check breaks between :
Disabled : the initial TrendLine is allowed to be pierced
Check breaks between point A - point B : no breaks are allowed between both Swing points
Point A - Current bar : no breaks are allowed between the first Swing point and the point of confirmation ('current' bar)
Source (breaks) : Source which invalidates TrendLine, default: close
🔹 TrendLine breaks
Minimal bars : The secondary TrendLine must be uninterrupted for at least x bars before a potential break can be considered.
🔹 Angles
Show : Toggle labels.
Ratio X-Y axis : Every user has his preferences regarding zoom, chart layout,...
If the shown angles are not according to your expectations, you can adjust this number.
Only TrendLine between : Only allow TrendLines between the minimum and maximum degrees. Set only the minimal and maximum values above 0.

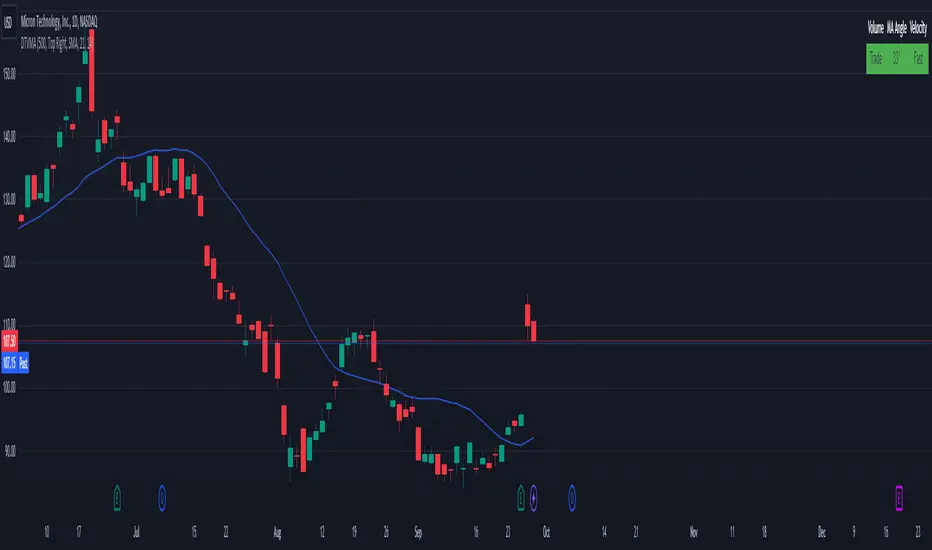
Display Trade Volume with MA Angle and Price VelocityThis Pine Script indicator is designed to provide traders with a visual representation of trade volume, moving average (MA) angle, and price velocity on a chart. The primary components of this indicator are:
Trade Volume: The indicator compares the current bar's trade volume with the average volume over a user-defined lookback period. The volume is displayed as either "Low" or "Trade" in a table, with red or green background color, respectively, to indicate whether it's below or above the average volume.
MA Angle: The indicator calculates the angle of the moving average (either Simple, Exponential, or Hull) over a user-defined length. A positive angle is shown in green, while a negative angle is shown in red. The angle is displayed in degrees in the table.
Price Velocity: This component calculates the velocity of price movement by comparing the difference between high and low prices over a user-defined lookback period. It then displays the velocity as either "Slow" or "Fast" in the table, with red or green background color, respectively, depending on whether it's below or above the average difference.
The indicator also includes alert conditions for high and low volume situations, notifying the trader when the current bar's volume is significantly higher or lower than the average volume.
TrigLibrary "Trig"
Trigonometric functions
rt_get_angleAlpha(a, b, c, deg)
Get angle α of a right triangle, given the lengths of its sides
Parameters:
a : length of leg a (float)
b : length of leg b (float)
c : length of hypotenuse (float)
deg : flag to return angle in degrees (bool - default = false)
Returns: angle α in radians (or degrees if deg == true)
rt_get_angleAlphaFromLine(x1, y1, x2, y2, l, deg)
Get angle α of a right triangle formed by the given line
Parameters:
x1 : x coordinate 1 (int - optional, required if argument l is not specified)
y1 : y coordinate 1 (float - optional, required if argument l is not specified)
x2 : x coordinate 2 (int - optional, required if argument l is not specified)
y2 : y coordinate 2 (float - optional, required if argument l is not specified)
l : line object (line - optional, required if x1, y1, x2, and y2 agruments are not specified)
deg : flag to return angle in degrees (bool - default = false)
Returns: angle α in radians (or degrees if deg == true)
rt_get_angleBeta(a, b, c, deg)
Get angle β of a right triangle, given the lengths of its sides
Parameters:
a : length of leg a (float)
b : length of leg b (float)
c : length of hypotenuse (float)
deg : flag to return angle in degrees (bool - default = false)
Returns: angle β in radians (or degrees if deg == true)
rt_get_angleBetaFromLine(x1, y1, x2, y2, l, deg)
Get angle β of a right triangle formed by the given line
Parameters:
x1 : x coordinate 1 (int - optional, required if argument l is not specified)
y1 : y coordinate 1 (float - optional, required if argument l is not specified)
x2 : x coordinate 2 (int - optional, required if argument l is not specified)
y2 : y coordinate 2 (float - optional, required if argument l is not specified)
l : line object (line - optional, required if x1, y1, x2, and y2 agruments are not specified)
deg : flag to return angle in degrees (bool - default = false)
Returns: angle β in radians (or degrees if deg == true)
Chop Zone - SamXThis is my spin on the Chop Zone indicator. It was forked from the built-in TradingView Chop Zone indicator. There were several reasons for this effort...
The built-in indicator version had no real configuration options
It was hard-coded to use the 34-period EMA with fixed span sizes for identifying price range
There was no real context to the meaning of default color scheme
The separation points of the chop zone bars was at a fixed 1.43-degree scale
Note: If left at default settings, this indicator will exactly match the built-in Chop Zone indicator.
WARNING : Please be sure you understand the potential impact and implications before adjusting any of the settings in the "Advanced Configuration" section!!!
Chop Zone with discrete/standard coloring:
Chop Zone with gradient fill:
Moving Average angle plot with gradient fill:

Gann FanHello All,
For long time I have been getting many requests about Gann Fan indicator. now we have linefill() function in Pine Language and I think it's right time to make Gann Fan Indicator. Many Thanks to Pine Team for adding many new features to the Pine Language!
How this indicator works:
- It calculates midline (1/1)
- By using midline it calculates other lines (1/2, 1/3, 1/4...etc)
- It calculates highest/lowest Pivot Points in last 280 bars.( by default it's 280 bars, you can change it and pivot period )
- It checks the location of highest/lowest Pivot Points
- After the calculation of the Gann Fan lines, it draws lines, puts Labels and paints the zones between the lines according to the colors set by the user
Long time ago I created a special algorithm for calculating the line with 45 degree and I used it for "1/1" line. Anybody who needs it can use this algorithm freely ;)
Options:
You can change following items;
- The colors
- Transparency. Possible values for transparency are from 0 (not transparent) to 100 (invisible)
- Line styles
- Loopback Period (by default it's 280)
- Pivot Period (by default it's 5)
- Enable/disable Labels
- Label location (by default it's 50
Tradingview Gann Fan page : The Gann Fan is a technical analysis tool created by WD Gann. The tool is comprised of 9 diagonal lines (extending indefinitely) designed to show different support and resistance levels on a chart. These angles -drawn from main tops and bottoms- divide time and price into proportionate parts and are often used to predict areas of support and resistance, key tops and bottoms and future price moves. Please note that the chart needs to be scaled properly to ensure the market has a square relationship....
Enjoy!

Triple-Angle Trend SignalAn enhancement and iteration of lmatl's "angle bar colors " to enable multiple angle bars (up to 3) each with customisable price sources, angle periods, thresholds of degrees, line thicknesses and colours. Full history is displayed of when the selected angle bars have all been within higher degrees (green background) and lower degrees (red background).
This indicator is useful when it is customised to suit individual charts where it can specify conditions to find entries on uptrends and exits on downtrends.

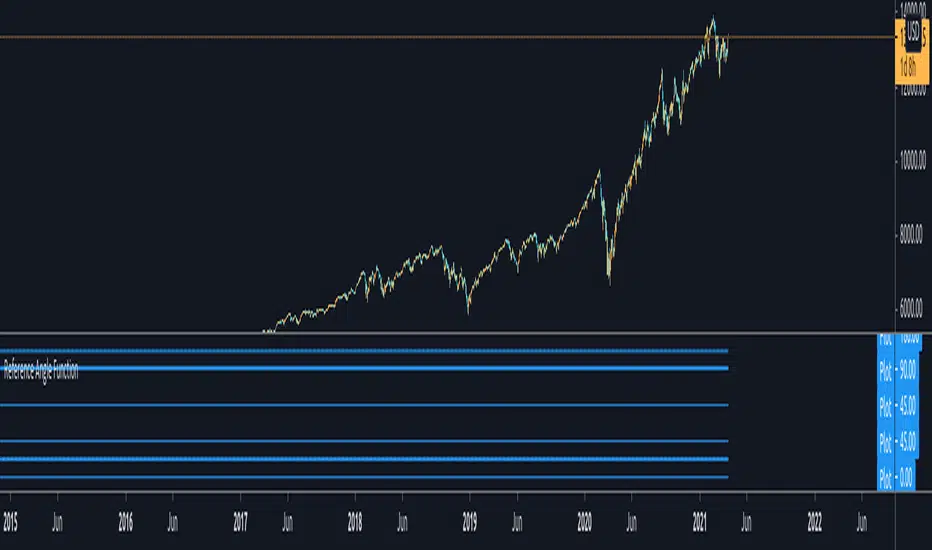
Reference Angle Function - for developers█ OVERVIEW
This function should give you a correct output in a circle of 360°. It is meant to be used by developers/pine-script-coders to figure out reference angles.
Conditions :
1. If the angle given to this function is in between 0-360 then it would give you the same angle without any modifications
2. If the angle given is greater than 360° - for example : 540°, - then it would output 180° which is the angle after a complete revolution.
3. If the angle given is negative, then it would go counter clockwise and give you the angle.
4. If the angle is negative and less than -360°, then it would also give you the actual correct degree after counting the revolution and flipping it to positive.
Feel free to play with it or use it if you need to. I already included some test inputs to show you how it would work.
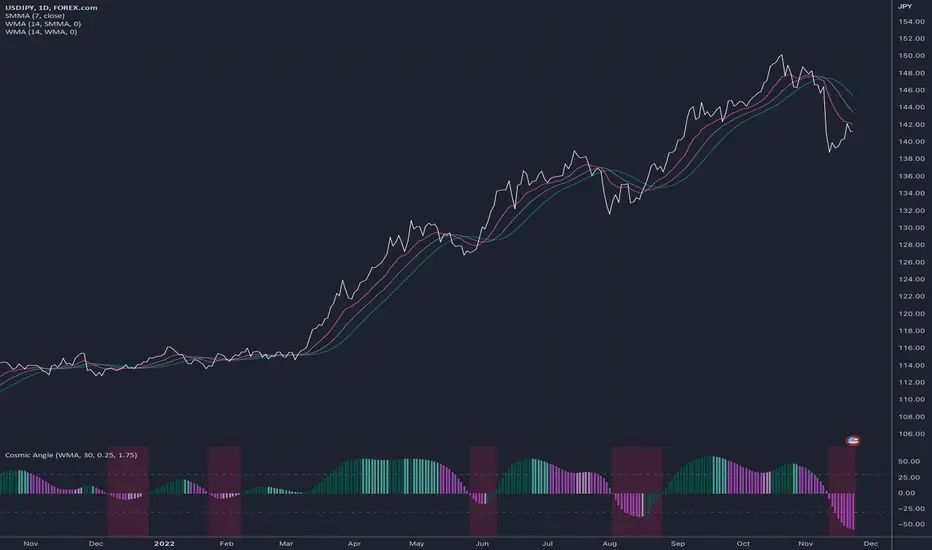
Cosmic AngleThis is a histogram that can display a moving average's angle and also show how volatile the change in angle is.
To use:
Add any moving average indicator to the chart
Click that indicator's More > Add Indicator on (MA)
Select the Cosmic Angle indicator
Adjust the Cosmic Angle 's Price To Bar Ratio value to reflect that of your chart's
Adjust the Cosmic Angle 's Threshold as per your liking (*1)
(*1) This setting affects the bar colors. It represents the minimum difference in degrees between the n and n-1 bars' angle to force a change of color.
angle bar colors [LM]Hello guys,
I would like to introduce you angle bar colors indicator. It colors bars depending the angle of the bar x length back and current one
lime angle > 70 degrees
green 20 < angle < 70 degrees
orange 0 > angle <= 20 degrees
purple 0 > angle >= -20 degrees
red -20 > angle > -70 degrees
maroon angle < -70 degrees
Any suggestions are welcome
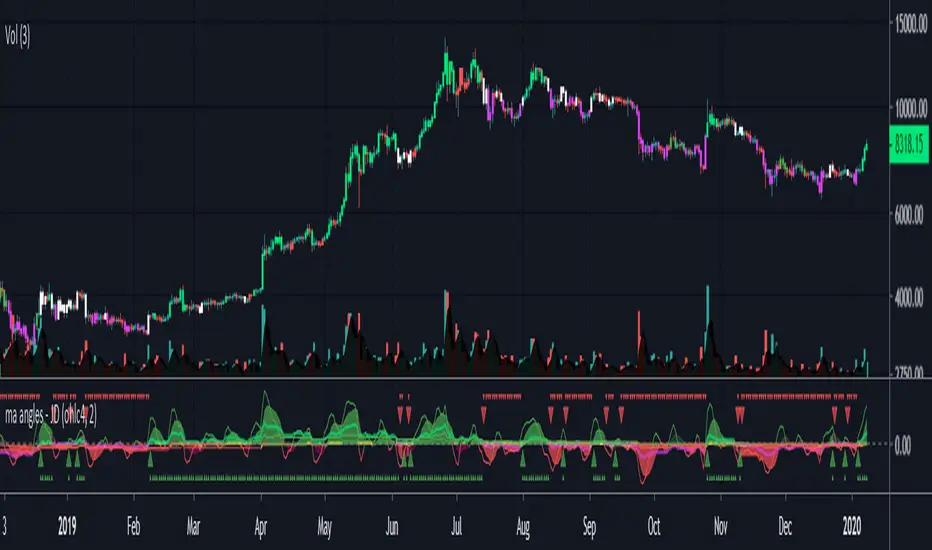
ma angles - JDthis indicator gives you the angles of different moving averages
this can give an indication of the momentum of a move increasing or decreasing
you can also set a threshold for a minimum angle to filter out "no trade" zones
JD.
#NotTradingAdvice #DYOR
I build these indicators for myself and provide them open source, to use for free to use and improve upon,
as I believe the best way to learn is toghether.
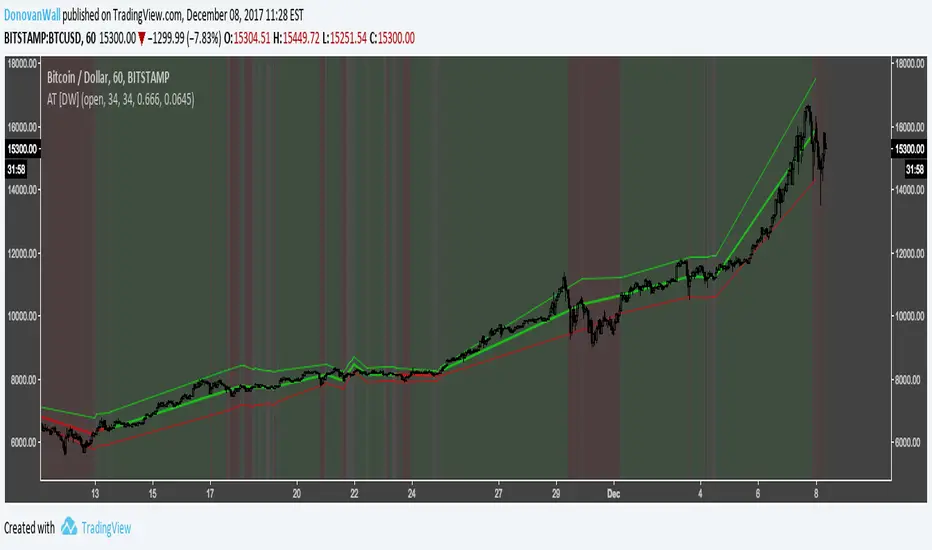
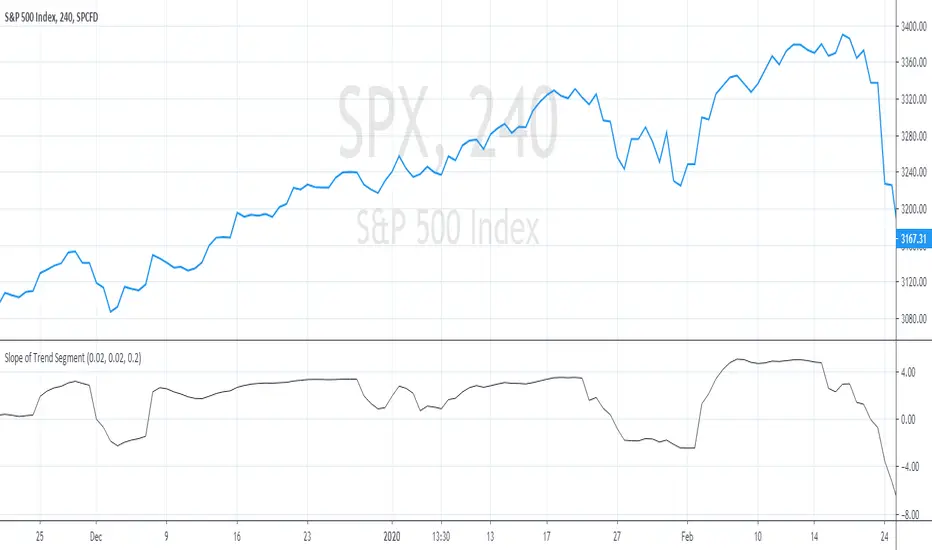
Angular Trend [DW]This is an experimental study designed to outline the trend of a security based on the average angular change of price.
New lines are drawn whenever the source's angle of change is equal to zero.