DCA Investment Tracker Pro [tradeviZion]DCA Investment Tracker Pro: Educational DCA Analysis Tool
An educational indicator that helps analyze Dollar-Cost Averaging strategies by comparing actual performance with historical data calculations.
---
💡 Why I Created This Indicator
As someone who practices Dollar-Cost Averaging, I was frustrated with constantly switching between spreadsheets, calculators, and charts just to understand how my investments were really performing. I wanted to see everything in one place - my actual performance, what I should expect based on historical data, and most importantly, visualize where my strategy could take me over the long term .
What really motivated me was watching friends and family underestimate the incredible power of consistent investing. When Napoleon Bonaparte first learned about compound interest, he reportedly exclaimed "I wonder it has not swallowed the world" - and he was right! Yet most people can't visualize how their $500 monthly contributions today could become substantial wealth decades later.
Traditional DCA tracking tools exist, but they share similar limitations:
Require manual data entry and complex spreadsheets
Use fixed assumptions that don't reflect real market behavior
Can't show future projections overlaid on actual price charts
Lose the visual context of what's happening in the market
Make compound growth feel abstract rather than tangible
I wanted to create something different - a tool that automatically analyzes real market history, detects volatility periods, and shows you both current performance AND educational projections based on historical patterns right on your TradingView charts. As Warren Buffett said: "Someone's sitting in the shade today because someone planted a tree a long time ago." This tool helps you visualize your financial tree growing over time.
This isn't just another calculator - it's a visualization tool that makes the magic of compound growth impossible to ignore.
---
🎯 What This Indicator Does
This educational indicator provides DCA analysis tools. Users can input investment scenarios to study:
Theoretical Performance: Educational calculations based on historical return data
Comparative Analysis: Study differences between actual and theoretical scenarios
Historical Projections: Theoretical projections for educational analysis (not predictions)
Performance Metrics: CAGR, ROI, and other analytical metrics for study
Historical Analysis: Calculates historical return data for reference purposes
---
🚀 Key Features
Volatility-Adjusted Historical Return Calculation
Analyzes 3-20 years of actual price data for any symbol
Automatically detects high-volatility stocks (meme stocks, growth stocks)
Uses median returns for volatile stocks, standard CAGR for stable stocks
Provides conservative estimates when extreme outlier years are detected
Smart fallback to manual percentages when data insufficient
Customizable Performance Dashboard
Educational DCA performance analysis with compound growth calculations
Customizable table sizing (Tiny to Huge text options)
9 positioning options (Top/Middle/Bottom + Left/Center/Right)
Theme-adaptive colors (automatically adjusts to dark/light mode)
Multiple display layout options
Future Projection System
Visual future growth projections
Timeframe-aware calculations (Daily/Weekly/Monthly charts)
1-30 year projection options
Shows projected portfolio value and total investment amounts
Investment Insights
Performance vs benchmark comparison
ROI from initial investment tracking
Monthly average return analysis
Investment milestone alerts (25%, 50%, 100% gains)
Contribution tracking and next milestone indicators
---
📊 Step-by-Step Setup Guide
1. Investment Settings 💰
Initial Investment: Enter your starting lump sum (e.g., $60,000)
Monthly Contribution: Set your regular DCA amount (e.g., $500/month)
Return Calculation: Choose "Auto (Stock History)" for real data or "Manual" for fixed %
Historical Period: Select 3-20 years for auto calculations (default: 10 years)
Start Year: When you began investing (e.g., 2020)
Current Portfolio Value: Your actual portfolio worth today (e.g., $150,000)
2. Display Settings 📊
Table Sizes: Choose from Tiny, Small, Normal, Large, or Huge
Table Positions: 9 options - Top/Middle/Bottom + Left/Center/Right
Visibility Toggles: Show/hide Main Table and Stats Table independently
3. Future Projection 🔮
Enable Projections: Toggle on to see future growth visualization
Projection Years: Set 1-30 years ahead for analysis
Live Example - NASDAQ:META Analysis:
Settings shown: $60K initial + $500/month + Auto calculation + 10-year history + 2020 start + $150K current value
---
🔬 Pine Script Code Examples
Core DCA Calculations:
// Calculate total invested over time
months_elapsed = (year - start_year) * 12 + month - 1
total_invested = initial_investment + (monthly_contribution * months_elapsed)
// Compound growth formula for initial investment
theoretical_initial_growth = initial_investment * math.pow(1 + annual_return, years_elapsed)
// Future Value of Annuity for monthly contributions
monthly_rate = annual_return / 12
fv_contributions = monthly_contribution * ((math.pow(1 + monthly_rate, months_elapsed) - 1) / monthly_rate)
// Total expected value
theoretical_total = theoretical_initial_growth + fv_contributions
Volatility Detection Logic:
// Detect extreme years for volatility adjustment
extreme_years = 0
for i = 1 to historical_years
yearly_return = ((price_current / price_i_years_ago) - 1) * 100
if yearly_return > 100 or yearly_return < -50
extreme_years += 1
// Use median approach for high volatility stocks
high_volatility = (extreme_years / historical_years) > 0.2
calculated_return = high_volatility ? median_of_returns : standard_cagr
Performance Metrics:
// Calculate key performance indicators
absolute_gain = actual_value - total_invested
total_return_pct = (absolute_gain / total_invested) * 100
roi_initial = ((actual_value - initial_investment) / initial_investment) * 100
cagr = (math.pow(actual_value / initial_investment, 1 / years_elapsed) - 1) * 100
---
📊 Real-World Examples
See the indicator in action across different investment types:
Stable Index Investments:
AMEX:SPY (SPDR S&P 500) - Shows steady compound growth with standard CAGR calculations
Classic DCA success story: $60K initial + $500/month starting 2020. The indicator shows SPY's historical 10%+ returns, demonstrating how consistent broad market investing builds wealth over time. Notice the smooth theoretical growth line vs actual performance tracking.
MIL:VUAA (Vanguard S&P 500 UCITS) - Shows both data limitation and solution approaches
Data limitation example: VUAA shows "Manual (Auto Failed)" and "No Data" when default 10-year historical setting exceeds available data. The indicator gracefully falls back to manual percentage input while maintaining all DCA calculations and projections.
MIL:VUAA (Vanguard S&P 500 UCITS) - European ETF with successful 5-year auto calculation
Solution demonstration: By adjusting historical period to 5 years (matching available data), VUAA auto calculation works perfectly. Shows how users can optimize settings for newer assets. European market exposure with EUR denomination, demonstrating DCA effectiveness across different markets and currencies.
NYSE:BRK.B (Berkshire Hathaway) - Quality value investment with Warren Buffett's proven track record
Value investing approach: Berkshire Hathaway's legendary performance through DCA lens. The indicator demonstrates how quality companies compound wealth over decades. Lower volatility than tech stocks = standard CAGR calculations used.
High-Volatility Growth Stocks:
NASDAQ:NVDA (NVIDIA Corporation) - Demonstrates volatility-adjusted calculations for extreme price swings
High-volatility example: NVIDIA's explosive AI boom creates extreme years that trigger volatility detection. The indicator automatically switches to "Median (High Vol): 50%" calculations for conservative projections, protecting against unrealistic future estimates based on outlier performance periods.
NASDAQ:TSLA (Tesla) - Shows how 10-year analysis can stabilize volatile tech stocks
Stable long-term growth: Despite Tesla's reputation for volatility, the 10-year historical analysis (34.8% CAGR) shows consistent enough performance that volatility detection doesn't trigger. Demonstrates how longer timeframes can smooth out extreme periods for more reliable projections.
NASDAQ:META (Meta Platforms) - Shows stable tech stock analysis using standard CAGR calculations
Tech stock with stable growth: Despite being a tech stock and experiencing the 2022 crash, META's 10-year history shows consistent enough performance (23.98% CAGR) that volatility detection doesn't trigger. The indicator uses standard CAGR calculations, demonstrating how not all tech stocks require conservative median adjustments.
Notice how the indicator automatically detects high-volatility periods and switches to median-based calculations for more conservative projections, while stable investments use standard CAGR methods.
---
📈 Performance Metrics Explained
Current Portfolio Value: Your actual investment worth today
Expected Value: What you should have based on historical returns (Auto) or your target return (Manual)
Total Invested: Your actual money invested (initial + all monthly contributions)
Total Gains/Loss: Absolute dollar difference between current value and total invested
Total Return %: Percentage gain/loss on your total invested amount
ROI from Initial Investment: How your starting lump sum has performed
CAGR: Compound Annual Growth Rate of your initial investment (Note: This shows initial investment performance, not full DCA strategy)
vs Benchmark: How you're performing compared to the expected returns
---
⚠️ Important Notes & Limitations
Data Requirements: Auto mode requires sufficient historical data (minimum 3 years recommended)
CAGR Limitation: CAGR calculation is based on initial investment growth only, not the complete DCA strategy
Projection Accuracy: Future projections are theoretical and based on historical returns - actual results may vary
Timeframe Support: Works ONLY on Daily (1D), Weekly (1W), and Monthly (1M) charts - no other timeframes supported
Update Frequency: Update "Current Portfolio Value" regularly for accurate tracking
---
📚 Educational Use & Disclaimer
This analysis tool can be applied to various stock and ETF charts for educational study of DCA mathematical concepts and historical performance patterns.
Study Examples: Can be used with symbols like AMEX:SPY , NASDAQ:QQQ , AMEX:VTI , NASDAQ:AAPL , NASDAQ:MSFT , NASDAQ:GOOGL , NASDAQ:AMZN , NASDAQ:TSLA , NASDAQ:NVDA for learning purposes.
EDUCATIONAL DISCLAIMER: This indicator is a study tool for analyzing Dollar-Cost Averaging strategies. It does not provide investment advice, trading signals, or guarantees. All calculations are theoretical examples for educational purposes only. Past performance does not predict future results. Users should conduct their own research and consult qualified financial professionals before making any investment decisions.
---
© 2025 TradeVizion. All rights reserved.
Analytics

UNITED TRADING COMMUNITY WaterMarkWATER MARK indicator. Will allow you to improve the order of the entries you need on the chart.
1. Name and date for the traded instrument
2. Watermarks to protect your charts (in the center and around the perimeter of the chart)
3. The new "notes" option will allow you to keep focus on the factors that are important to you on the chart.
Very flexible settings for any notes, labels, watermarks on the chart that are important to you.
Индикатор WATER MARK . Даст возможность вам улучшить порядок нужных вам записей на графике.
1. Название и дата для торгуемого инструмента
2. Водные знаки для защиты ваших графиков ( в центре и по периметру графика)
3. Новая опция "заметки" позволит вам держать фокус на важных для вас факторах на графике.
Очень гибкая настройка , любых значимых для вас заметок , лейблов , вотермарк на графике.

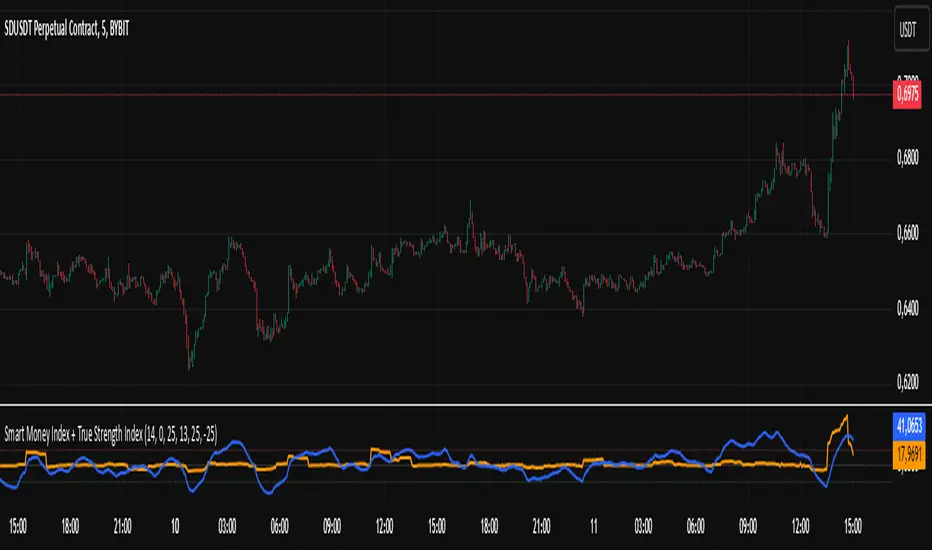
Smart Money Index + True Strength IndexThe Smart Money Index + True Strength Index indicator is a combination of two popular technical analysis indicators: the Smart Money Index (SMI) and the True Strength Index (TSI). This combined indicator helps traders identify potential entry points for long and short positions based on signals from both indexes.
Main Components:
Smart Money Index (SMI):
The SMI measures the difference between the closing and opening price of a candle multiplied by the trading volume over a certain period of time. This allows you to assess the activity of large players ("smart money") in the market. If the SMI value is above a certain threshold (smiThreshold), it may indicate a bullish trend, and if lower, it may indicate a bearish trend.
True Strength Index (TSI):
The TSI is an oscillator that measures the strength of a trend by comparing the price change of the current bar with the previous bar. It uses two exponential moving averages (EMAS) to smooth the data. TSI values can fluctuate around zero, with values above the overbought level indicating a possible downward correction, and values below the oversold level signaling a possible upward correction.
Parameters:
SMI Length: Defines the number of candles used to calculate the average SMI value. The default value is 14.
SMI Threshold: A threshold value that is used to determine a buy or sell signal. The default value is 0.
Length of the first TSI smoothing (tsiLength1): The length of the first EMA for calculating TSI. The default value is 25.
Second TSI smoothing length (tsiLength2): The length of the second EMA for additional smoothing of TSI values. The default value is 13.
TSI Overbought level: The level at which the market is considered to be overbought. The default value is 25.
Oversold level TSI: The level at which it is considered that the market is in an oversold state. The default value is -25.
Logic of operation:
SMI calculation:
First, the difference between the closing and opening price of each candle (close - open) is calculated.
This difference is then multiplied by the trading volume.
The resulting product is averaged using a simple moving average (SMA) over a specified period (smiLength).
Calculation of TSI:
The price change relative to the previous bar is calculated (close - close ).
The first EMA with the length tsiLength1 is applied.
Next, a second EMA with a length of tsiLength2 is applied to obtain the final TSI value.
The absolute value of price changes is calculated in the same way, and two emas are also applied.
The final TSI index is calculated as the ratio of these two values multiplied by 100.
Graphical representation:
The SMI and TSI lines are plotted on the graph along with their respective thresholds.
For SMI, the line is drawn in orange, and the threshold level is dotted in gray.
For the TSI, the line is plotted in blue, the overbought and oversold levels are indicated by red and green dotted lines, respectively.
Conditions for buy/sell signals:
A buy (long) signal is generated when:
SMI is greater than the threshold (smi > smiThreshold)
TSI crosses the oversold level from bottom to top (ta.crossover(tsi, oversold)).
A sell (short) signal is generated when:
SMI is less than the threshold (smi < smiThreshold)
TSI crosses the overbought level from top to bottom (ta.crossunder(tsi, overbought)).
Signal display:
When the conditions for a long or short are met, labels labeled "LONG" or "SHORT" appear on the chart.
The label for the long is located under the candle and is colored green, and for the short it is above the candle and is colored red.
Notification generation:
The indicator also supports notifications via the TradingView platform. Notifications are sent when conditions arise for a long or short position.
This combined indicator provides the trader with the opportunity to use both SMI and TSI signals simultaneously, which can improve the accuracy of trading decisions.
analytics_tablesLibrary "analytics_tables"
📝 Description
This library provides the implementation of several performance-related statistics and metrics, presented in the form of tables.
The metrics shown in the afforementioned tables where developed during the past years of my in-depth analalysis of various strategies in an atempt to reason about the performance of each strategy.
The visualization and some statistics where inspired by the existing implementations of the "Seasonality" script, and the performance matrix implementations of @QuantNomad and @ZenAndTheArtOfTrading scripts.
While this library is meant to be used by my strategy framework "Template Trailing Strategy (Backtester)" script, I wrapped it in a library hoping this can be usefull for other community strategy scripts that will be released in the future.
🤔 How to Guide
To use the functionality this library provides in your script you have to import it first!
Copy the import statement of the latest release by pressing the copy button below and then paste it into your script. Give a short name to this library so you can refer to it later on. The import statement should look like this:
import jason5480/analytics_tables/1 as ant
There are three types of tables provided by this library in the initial release. The stats table the metrics table and the seasonality table.
Each one shows different kinds of performance statistics.
The table UDT shall be initialized once using the `init()` method.
They can be updated using the `update()` method where the updated data UDT object shall be passed.
The data UDT can also initialized and get updated on demend depending on the use case
A code example for the StatsTable is the following:
var ant.StatsData statsData = ant.StatsData.new()
statsData.update(SideStats.new(), SideStats.new(), 0)
if (barstate.islastconfirmedhistory or (barstate.isrealtime and barstate.isconfirmed))
var statsTable = ant.StatsTable.new().init(ant.getTablePos('TOP', 'RIGHT'))
statsTable.update(statsData)
A code example for the MetricsTable is the following:
var ant.StatsData statsData = ant.StatsData.new()
statsData.update(ant.SideStats.new(), ant.SideStats.new(), 0)
if (barstate.islastconfirmedhistory or (barstate.isrealtime and barstate.isconfirmed))
var metricsTable = ant.MetricsTable.new().init(ant.getTablePos('BOTTOM', 'RIGHT'))
metricsTable.update(statsData, 10)
A code example for the SeasonalityTable is the following:
var ant.SeasonalData seasonalData = ant.SeasonalData.new().init(Seasonality.monthOfYear)
seasonalData.update()
if (barstate.islastconfirmedhistory or (barstate.isrealtime and barstate.isconfirmed))
var seasonalTable = ant.SeasonalTable.new().init(seasonalData, ant.getTablePos('BOTTOM', 'LEFT'))
seasonalTable.update(seasonalData)
🏋️♂️ Please refer to the "EXAMPLE" regions of the script for more advanced and up to date code examples!
Special thanks to @Mrcrbw for the proposal to develop this library and @DCNeu for the constructive feedback 🏆.
getTablePos(ypos, xpos)
Get table position compatible string
Parameters:
ypos (simple string) : The position on y axise
xpos (simple string) : The position on x axise
Returns: The position to be passed to the table
method init(this, pos, height, width, positiveTxtColor, negativeTxtColor, neutralTxtColor, positiveBgColor, negativeBgColor, neutralBgColor)
Initialize the stats table object with the given colors in the given position
Namespace types: StatsTable
Parameters:
this (StatsTable) : The stats table object
pos (simple string) : The table position string
height (simple float) : The height of the table as a percentage of the charts height. By default, 0 auto-adjusts the height based on the text inside the cells
width (simple float) : The width of the table as a percentage of the charts height. By default, 0 auto-adjusts the width based on the text inside the cells
positiveTxtColor (simple color) : The text color when positive
negativeTxtColor (simple color) : The text color when negative
neutralTxtColor (simple color) : The text color when neutral
positiveBgColor (simple color) : The background color with transparency when positive
negativeBgColor (simple color) : The background color with transparency when negative
neutralBgColor (simple color) : The background color with transparency when neutral
method init(this, pos, height, width, neutralBgColor)
Initialize the metrics table object with the given colors in the given position
Namespace types: MetricsTable
Parameters:
this (MetricsTable) : The metrics table object
pos (simple string) : The table position string
height (simple float) : The height of the table as a percentage of the charts height. By default, 0 auto-adjusts the height based on the text inside the cells
width (simple float) : The width of the table as a percentage of the charts width. By default, 0 auto-adjusts the width based on the text inside the cells
neutralBgColor (simple color) : The background color with transparency when neutral
method init(this, seas)
Initialize the seasonal data
Namespace types: SeasonalData
Parameters:
this (SeasonalData) : The seasonal data object
seas (simple Seasonality) : The seasonality of the matrix data
method init(this, data, pos, maxNumOfYears, height, width, extended, neutralTxtColor, neutralBgColor)
Initialize the seasonal table object with the given colors in the given position
Namespace types: SeasonalTable
Parameters:
this (SeasonalTable) : The seasonal table object
data (SeasonalData) : The seasonality data of the table
pos (simple string) : The table position string
maxNumOfYears (simple int) : The maximum number of years that fit into the table
height (simple float) : The height of the table as a percentage of the charts height. By default, 0 auto-adjusts the height based on the text inside the cells
width (simple float) : The width of the table as a percentage of the charts width. By default, 0 auto-adjusts the width based on the text inside the cells
extended (simple bool) : The seasonal table with extended columns for performance
neutralTxtColor (simple color) : The text color when neutral
neutralBgColor (simple color) : The background color with transparency when neutral
method update(this, wins, losses, numOfInconclusiveExits)
Update the strategy info data of the strategy
Namespace types: StatsData
Parameters:
this (StatsData) : The strategy statistics object
wins (SideStats)
losses (SideStats)
numOfInconclusiveExits (int) : The number of inconclusive trades
method update(this, stats, positiveTxtColor, negativeTxtColor, negativeBgColor, neutralBgColor)
Update the stats table object with the given data
Namespace types: StatsTable
Parameters:
this (StatsTable) : The stats table object
stats (StatsData) : The stats data to update the table
positiveTxtColor (simple color) : The text color when positive
negativeTxtColor (simple color) : The text color when negative
negativeBgColor (simple color) : The background color with transparency when negative
neutralBgColor (simple color) : The background color with transparency when neutral
method update(this, stats, buyAndHoldPerc, positiveTxtColor, negativeTxtColor, positiveBgColor, negativeBgColor)
Update the metrics table object with the given data
Namespace types: MetricsTable
Parameters:
this (MetricsTable) : The metrics table object
stats (StatsData) : The stats data to update the table
buyAndHoldPerc (float) : The buy and hold percetage
positiveTxtColor (simple color) : The text color when positive
negativeTxtColor (simple color) : The text color when negative
positiveBgColor (simple color) : The background color with transparency when positive
negativeBgColor (simple color) : The background color with transparency when negative
method update(this)
Update the seasonal data based on the season and eon timeframe
Namespace types: SeasonalData
Parameters:
this (SeasonalData) : The seasonal data object
method update(this, data, positiveTxtColor, negativeTxtColor, neutralTxtColor, positiveBgColor, negativeBgColor, neutralBgColor, timeBgColor)
Update the seasonal table object with the given data
Namespace types: SeasonalTable
Parameters:
this (SeasonalTable) : The seasonal table object
data (SeasonalData) : The seasonal cell data to update the table
positiveTxtColor (simple color) : The text color when positive
negativeTxtColor (simple color) : The text color when negative
neutralTxtColor (simple color) : The text color when neutral
positiveBgColor (simple color) : The background color with transparency when positive
negativeBgColor (simple color) : The background color with transparency when negative
neutralBgColor (simple color) : The background color with transparency when neutral
timeBgColor (simple color) : The background color of the time gradient
SideStats
Object that represents the strategy statistics data of one side win or lose
Fields:
numOf (series int)
sumFreeProfit (series float)
freeProfitStDev (series float)
sumProfit (series float)
profitStDev (series float)
sumGain (series float)
gainStDev (series float)
avgQuantityPerc (series float)
avgCapitalRiskPerc (series float)
avgTPExecutedCount (series float)
avgRiskRewardRatio (series float)
maxStreak (series int)
StatsTable
Object that represents the stats table
Fields:
table (series table) : The actual table
rows (series int) : The number of rows of the table
columns (series int) : The number of columns of the table
StatsData
Object that represents the statistics data of the strategy
Fields:
wins (SideStats)
losses (SideStats)
numOfInconclusiveExits (series int)
avgFreeProfitStr (series string)
freeProfitStDevStr (series string)
lossFreeProfitStDevStr (series string)
avgProfitStr (series string)
profitStDevStr (series string)
lossProfitStDevStr (series string)
avgQuantityStr (series string)
MetricsTable
Object that represents the metrics table
Fields:
table (series table) : The actual table
rows (series int) : The number of rows of the table
columns (series int) : The number of columns of the table
SeasonalData
Object that represents the seasonal table dynamic data
Fields:
seasonality (series Seasonality)
eonToMatrixRow (map)
numOfEons (series int)
mostRecentMatrixRow (series int)
balances (matrix)
returnPercs (matrix)
maxDDs (matrix)
eonReturnPercs (array)
eonCAGRs (array)
eonMaxDDs (array)
SeasonalTable
Object that represents the seasonal table
Fields:
table (series table) : The actual table
headRows (series int) : The number of head rows of the table
headColumns (series int) : The number of head columns of the table
eonRows (series int) : The number of eon rows of the table
seasonColumns (series int) : The number of season columns of the table
statsRows (series int)
statsColumns (series int) : The number of stats columns of the table
rows (series int) : The number of rows of the table
columns (series int) : The number of columns of the table
extended (series bool) : Whether the table has additional performance statistics

Buy-Sell-Hold RecommendationsDescription:
The indicator displays "recommendations" for the active symbol (Buy, Strong buy, Sell, Strong sell or Hold), based on the Tradingview's recommendations data. There are 3 presentations you can choose from:
- Bar -> displays a vertical/horizontal bar with sections for each rating
- Pie chart -> displays a pie chart with sections
- Table -> displays a table with score for each recommendation
Inputs:
- Display mode -> data presentation mode
- Position -> position of the bar/pie chart/table
- Highlight the highest rating -> recommendation(s) with highest score will be highlighted
- Buy, Strong buy, Sell, etc. -> colors of the "bar" sections
- Pixel Width, Pixel Height, etc. -> size of each "pixel" (cell) of the pie chart
- Resolution (X), Resolution (Y) -> how many pixels (cells) the pie chart has on each axis
- Inner area size (%) -> size of the empty space at the center of the pie chart
- Invert theme -> invert coloring scheme for "table" presentation mode
Notes:
- Tradingview seems to provide the recommendations only for major stocks
- Data is taken directly from Tradingview and is based on opinions of "analysts"
