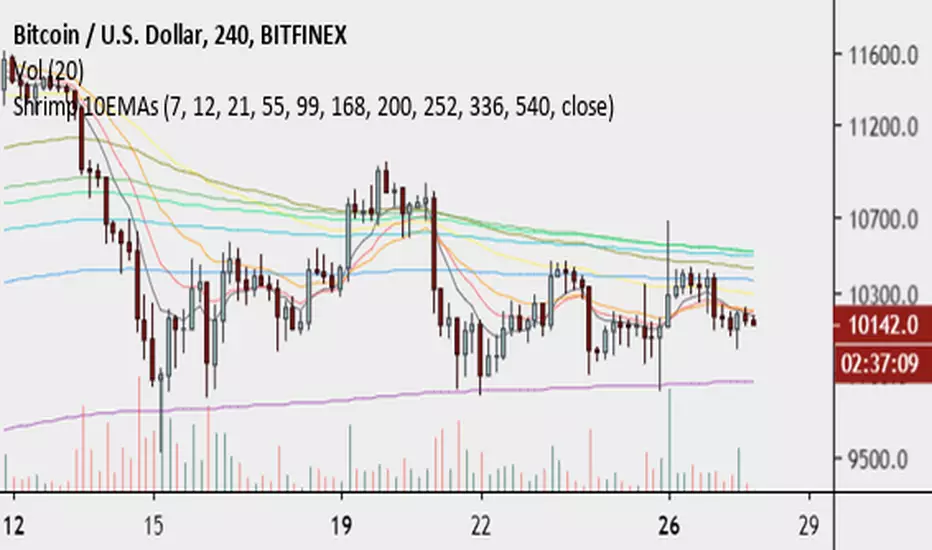
Shrimp 10EMAsA simple bundle of EMAs with some odd numbers that I found good confluence on 15min, 1h, 4h, 12h, 1d, 1w on BTC and on ALTS.
Works good for dynamic S/R on LTF and high probability target on MTF and HTF.
Try it out during your scans.
Lemme know what you think.
Altcoins
Coinbase ALT/USD IndexA simple ALT/USD pair index of all the altcoins currently trading on Coinbase.

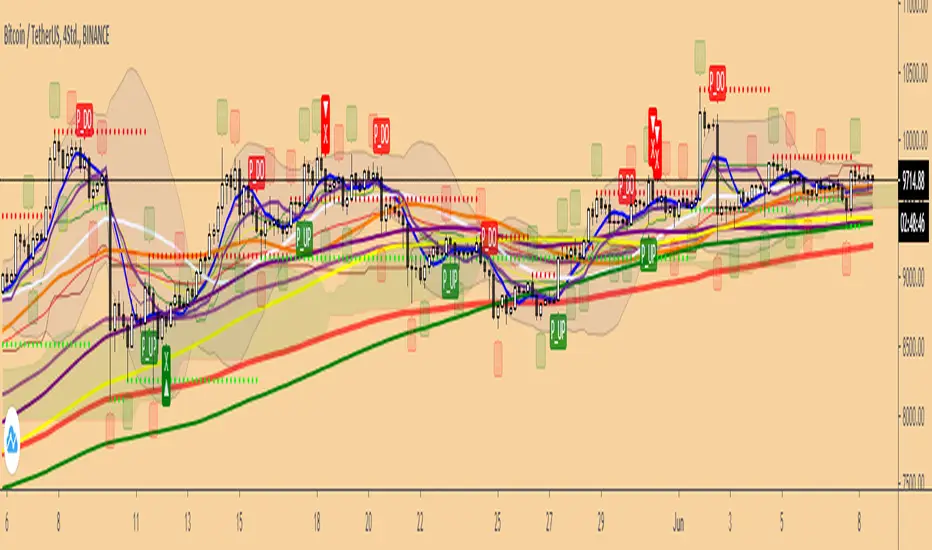
Strategy Builder Crypto V6Hello everyone
This indicator is the result of 7 years of trading (including 3 years of analyzing day and night how crypto assets behave).
I made it fully customizable but I wouldn't recommend changing the default values as they're the most optimal ones for now. Might change in the future but I'm very happy with the signals so far and I hope you'll be as well :)
Without further due, let's dig into it...
0 - Algo trading and Why
In the crypto trading, there is a lot of useless noise (we can probably thank Crypto Twitter for that :p) and a lot of useless data with the sole purpose is to lure you (who said Bitfinex Long/Short ratio or CME gaps ??)
I wanted to remove all the useless and only focus on Technical Analysis (TA) because I was deeply convinced that TA includes by design Fundamental Analysis (FA) and Pumponomics Analysis (PA) - PA being for instance when your favorite twitter guru will pump and dump on you
I heard that so many people got REKT from the previous bear market and I wanted to give back to the community - who helped me so much a few years back.
I worked hard to design the method and make it simple for the public and for FREE (so far as I want to collect feedbacks from the community and improving the indicator)
THIS IS MY GIFT TO YOU
1 - Input values
I'll explain later on through a medium article what each parameter means and how to set them up. For now, please used the optimized and recommended values already set in the indicator
2 - The method
This method works for intraday trading for timeframes between m5 and H1. Any timeframe above could work but would give signals too late - in this case, I would recommend changing the inputs with smaller values to adjust
I see a trend being composed of a main trend, and mini sub trends. In other words, for instance, a weekly bullish trend is made of smaller H4 bullish trends. Hope it makes sense so far
Let's call the weekly trend the MAIN trend and the H4 smaller trends the SECONDARY trends
That's exactly what this indicator is about
It will catch the best MAIN trend and all the SECONDARY trends in the same direction of the MAIN trend.
It's up to you if you want to take all the SECONDARY trends or only the first one in the sequence.
3 - Invalidation signal
A signal invalidation is used to make you exiting your position with a small loss before your stop loss will get hit. Very powerful way to save your capital and limit your losses.
You'll find the indicator here on tradingview for free under the name Trend signal with Alert (made by myself)
Trend signal with Alert
to invalidate entries. You'll need to request an invite
Briefly, let's assume we get a BUY signal. I would exit the position either if I'm getting a DOWN trend signal. It means, if the oblique/logarithmic trendline is broken, then it's better to exit the position and wait for the indicator to give another BUY signal later hopefully
Best case, it will limit your loss in case the asset will dump.
Worst case, this strict management strategy will make you exiting your position for no reason and you'll re-enter later (with a signal) at almost the same price or a bit higher
In the long run, this method will prevent you from having big losses
4 - Stop Loss and Take profits levels
It's really up to you. It depends of your capital and psychology
This indicator is made to give big moves but that's not 100% guaranteed. You can draw some trendlines or use moving averages in big timeframes to set your take profit and stop loss levels.
I personally use this also, along with fibonacci on the weekly/monthly timeframes for my take profit levels
As I'm a nice person, I'm linking the Fibonacci indicator that I use here
Automatic Multi-timeframes fibonacci zones
. You'll also need to request an invite for that one
4-bis - Trailing stop
Not financial advice but I use a supertrend and I have a software that will trail my stop according to that supertrend level
For LONG positions, we could set the trailing below the supertrend.
For SHORT positions, we could set the trailing above the supertrend.
You'll find the indicator here on tradingview for free under the name Supertrend V1.0 - Buy or Sell Signal
5 - Which assets
It's working with the default values on major/mid/small caps and for ALTS/BTC, ALTS/USD and ALTS/ETH pairing
YES, THIS IS MOST AWESOME THING OF THE ENTIRE UNIVERSE !!!
6 - Best setup
m15 timeframe is my preferred one for this method. Best Risk/Reward/Invalidations ratio among all other timeframes
I strongly recommend to use the Trend Signal with the input value 14 for the invalidations
If you enter on a BUY signal, and get a RED trend signal, exit immediately the position without waiting for any other confirmation/pullback or anything else
If you enter on a SELL signal, and get a BLUE trend signal, exit immediately the position without waiting for any other confirmation/pullback or anything else
For the trailing stop/Supertrend value, it depends of your capital and how big your stop loss should be. I personally use the settings in the Supertrend indicator
7 - Alerts
You can setup alerts for the primary and secondary signals in Tradingview so that you won't have to stare at the charts all day long. You mental healthy is my priority above everything else :)
8 - More to come
I personally use the alerts from this indicator coupled with a system to take the trades given by the tradingview alerts. I'll publish it later on if I feel the indicator collects enough interest from you guys

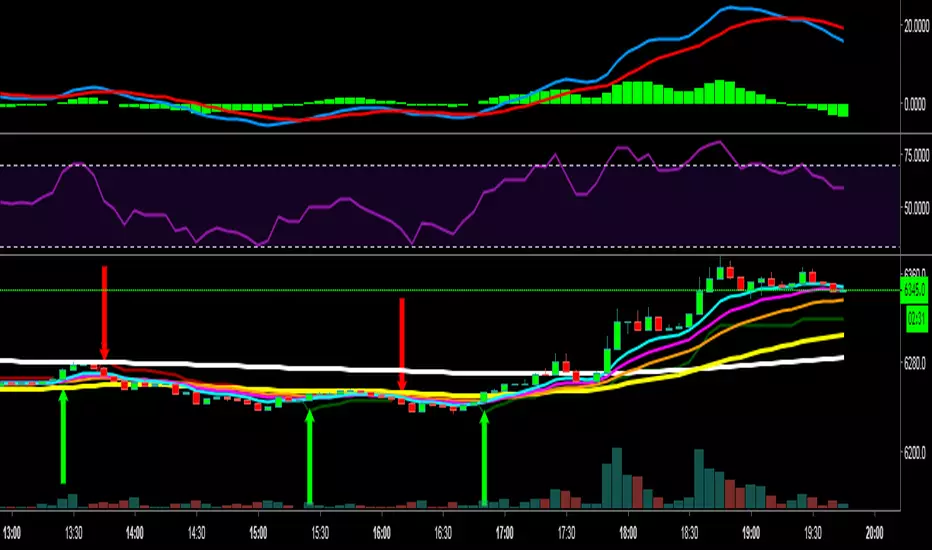
T-Best Indicator For Bitmex Short & Long & Alts CoinT-Best Indicator isunique trading indicator which comes with combination of multiple indicators, giving more accuracy to the Buy/Sell Signal. If the candles crosses red balls, price will go up and if crosses green balls price will go down. Most important feature included here is the Buy/Sell onscreen Alerts & lables.
T-Best Indicator Exponential/Simple Moving Averages, Bollinger Bands , Fractal Patterns and many more

Slices of Bitcoin
A very simple indicator that shows how many times a currency fits into Bitcoin. In other words, the higher the value, the weaker the currency against Bitcoin.
You can easily see that since the beginning of 2019 Stellar Lumen (XLM) lost half of its BTC-value while the USD-value was constant.

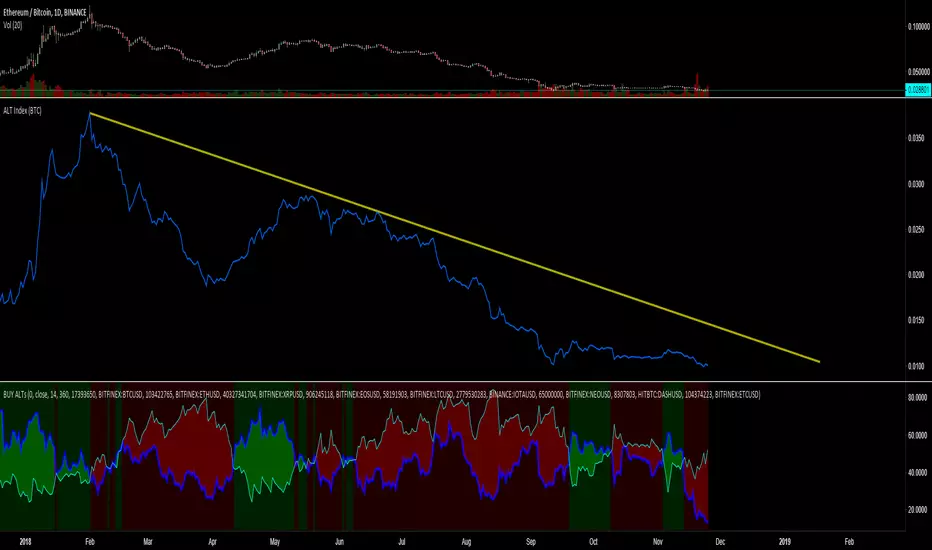
Altcoin Profitability Tracker 2Ever wonder which altcoins are performing better than Bitcoin? This script plots the profitability of 15 altcoins and BTCUSD so you can quickly determine where to invest your money.

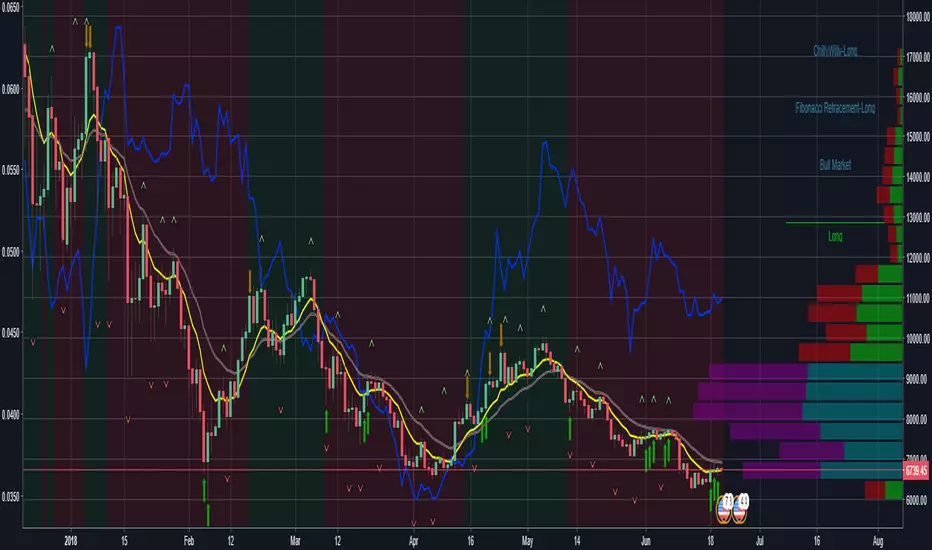
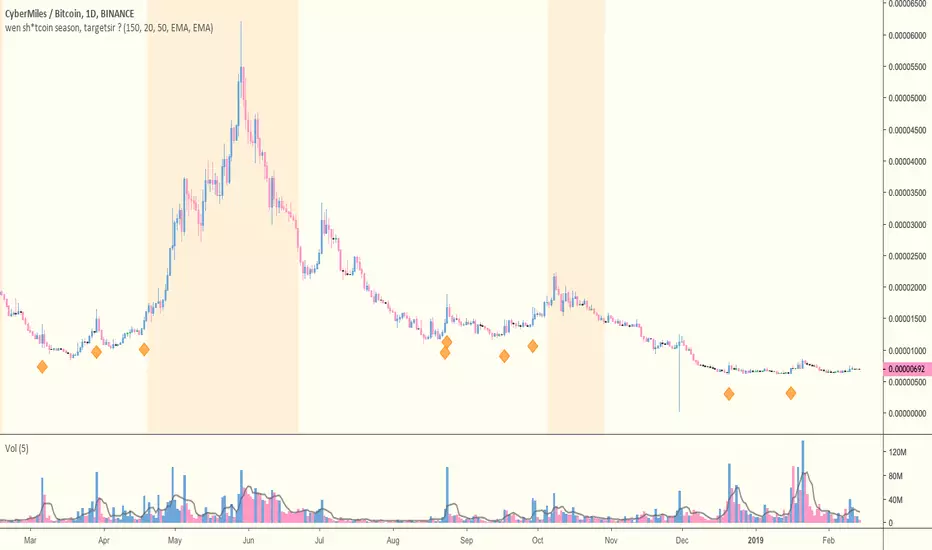
wen sh*tcoin season, targetsir ?Cheap thing to throw over your charts when scrolling through the likes of Binance, Bittrex or whatever
Highlights the Golden Cross region ("It's alt season!") -- configurable
Attempts to highlight potential "out of season" blatant accumulation via large volume spikes -- %age spike configurable
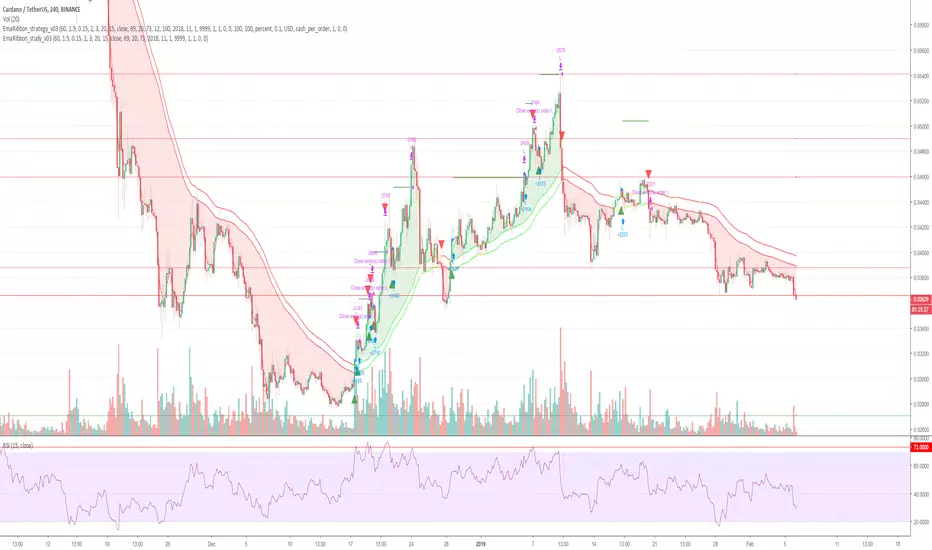
Cryptocurrency trend following EMA Ribbon LONG only studyThis strategy is based on EMA Ribbon and uses multiple indicators to find optimal time to enter/exit the trade and filter out false signals. The script with default setting is developed mainly for trading altcoins/stable coin pair such as ADA(USDT etc on 4h timeframe but it can be applied to any pair/any timeframe with some settings adjustments.
For plot on chart features make sure that you have both study and strategy scripts on chart with same settings.
Strategy settings description:
1. Signal EMA Length - Value for exponencial moving average (slowest from EMA Ribbon)
1a. Buy price toleration (%) - Price deviation for filtering bounces of EMA - price must close defined percents above EMA to open long trade
1b. Sell price toleration (%) - Price deviation for filtering bounces of EMA - price must close defined percents bellow EMA to close long trade
1c. EMA deelay - EMA id delayed by defined bars for smoothening
2. Filter by Fast EMA - Strategy filters signals to prevent buy while coin is dropping
2a. Fast EMA Length - Value for fast exponencial moving average
3. Filter by SMA - Strategy filters signals to confirm trend change
3a. SMA Length - Value for simple moving average
4. Filter by RSI - Strategy filters signals to prevent buing/selling overbought/oversold coins
4a. RSI Length - Length of RSI identificator
4b. RSI Source candle - What price of candle is used for RSI calculation (open, close, high, low)
4c. RSI Long condition - When buy, RSI indicator must be below this value to prevent of buying already overbought coin
4d. RSI Short condition - When sell, RSI indicator must be above this value to prevent of selling already oversold coin
5. RSI Close Trade Condition - Strategy sell coin once RSI reach defined value
5a. RSI close trade condition - Sell once RSI indicator acquires defined value
6. Close trade by Take Profit or Stop Loss Condition (STRATEGY ONLY) - Strategy sell coin once defined take profit / stoploss level is reached
6a. Take Profit (%) - Take profit value in percent
6b. Stop Loss (%) - Stop loss value in percent
6c. Plot targets on chart - defined targets will be plotted as lines on chart
7. Date range from
7a From Year - To run strategy in interval
7b From Month - To run strategy in interval
7c From Day - To run strategy in interval
8. Date range to
8a To Year - To run strategy in interval
8b To Month - To run strategy in interval
8c To Day - To run strategy in interval
9. Wait to confirm the signal
9a Wait candless to buy - strategy will wait defined candless to confirm the signal before buy
9b Wait candless to sell - strategy will wait defined candless to confirm the signal before sell
10. Plotting on chart (STUDY ONLY)
10a Plot signal line channel with bows on chart
10b Plot simple moving average on chart
10c Plot EMA Ribbon on chart
10d Plot recent support and resistance levels on chart
11. Show Every signal (STUDY ONLY) - Unchecked shows only first signal based on strategy. But if you use take profit/stoploss settings within your bot, you might want to rebuy on next signal. Checked shows signal on each candle.
Throw on chart also buld-in RSI indicator and set the same as strategy
Notice that there might be false signals, especially when the coin is not trending or is strongly manipulated. Overall strategy is profitable though. You just take some minor loses and wont miss the big move.
You may also consider to compare buy&hold return vs profit from trading this strategy. In downtrend as we have seen recently, profit may not be as high as you expect but it is still much better than just hold and hope.
You can use the strategy script for fine tunning settings and find best settings for yourself.
Study script helps you to automate trading with use of alerts perharps with 3commas bot or even trade manually based on email/sms notification setted by tradingview
Notice that study script does not handle takeprofit/stoploss order. That is why sell arrows could be plotted by study script later than strategy script. To rebuy after takeprofit/stop-loss use "11. Show Every signal (STUDY ONLY)" setting
Make sure that you keep same settings for strategy and study scripts.
If you need any help with settings do not hesitate to ask. I would also appriciate any feedback and ideas how to improve this script.
Here is backtest result from 1. Nov 2018 using constant 100USD Buy ammount:
1hTriLine, so much power, so easy to use....So many nuances to this one. So many powerful strategies to devise. Responsive. Accurate. Easy to use. Everything you can expect from one of my scripts. Trading made easy.

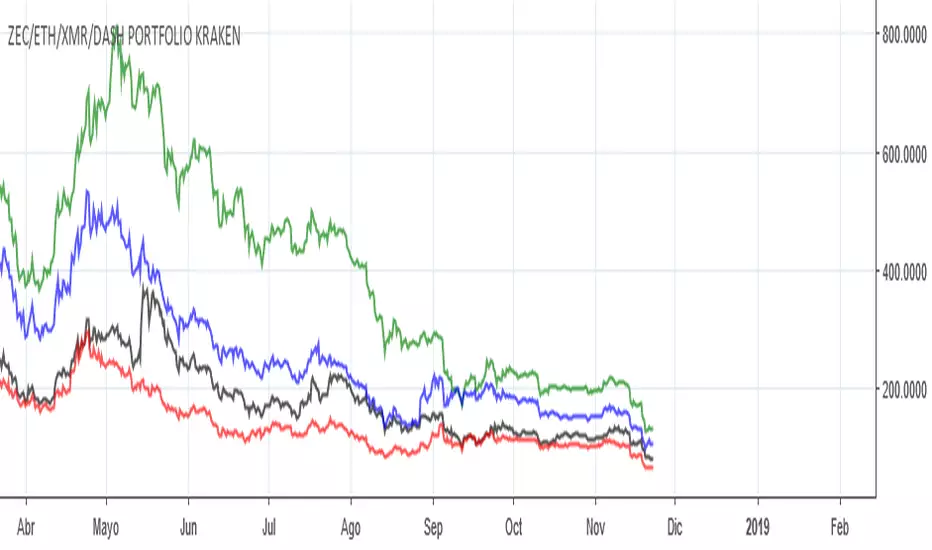
ZEC/ETH/XMR/DASH PORTFOLIO KRAKENPortfolio chart with total value.
I will try to optimize it, maybe add % option if I findout how ;p
Or maybe a normalization would be good, idk.
Cheers!
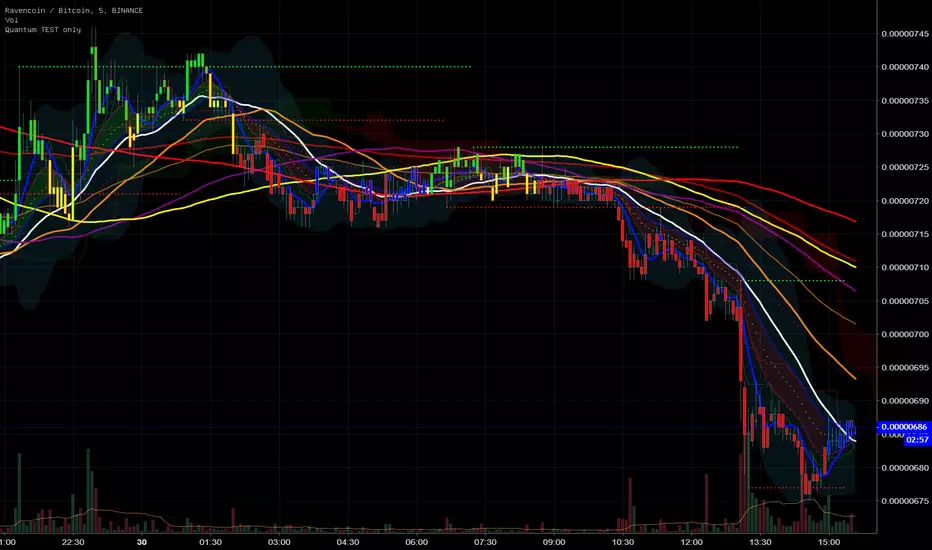
Quantum all in one Crypto indicator V1Quantum all in one Crypto indicator V1
Features:
Bollinger
Ichimoku
6 EMA
6 MA + Fast & Slow
CDC Strategy
Fractals
Pivots
.. and more
V 1.5 in progress
enjoy
Quantum All in One Crypto Indicator V1Quantum All in One Crypto Indicator V1
Features
6 EMA
6 MA + Slow & Fast
Ichimoku
Bollinger
Fractals
CDC Strategy
Colored Bars
Pivot´s and more..
have fun
Version V1.5 in Progress
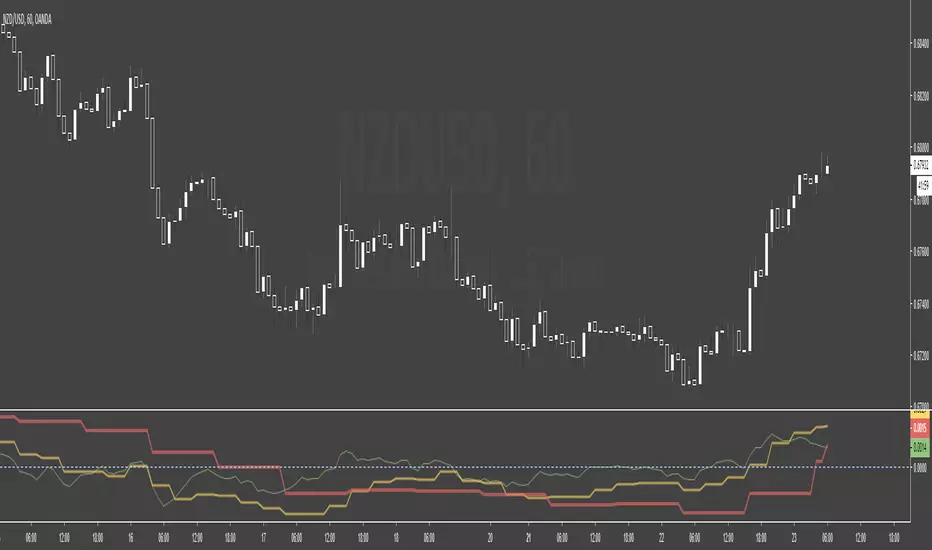
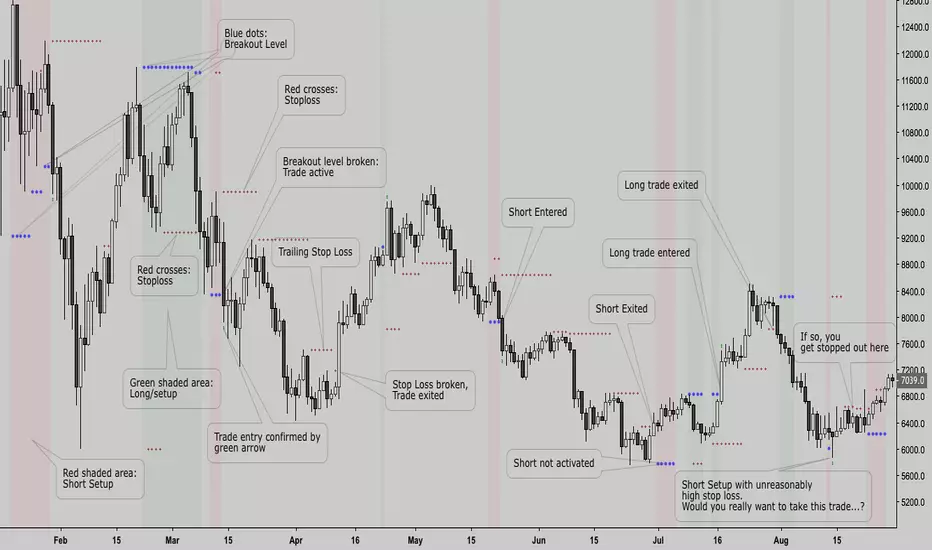
Zentrading Trend FollowerOur Trend following indicator is designed to get you in every trend safely, but perhaps most importantly, keeps you out of bad trades.
It performs well on all assets as it captures trending moves.
It does not only provide you with buy or sell signals you have to react on quickly, rather, it shows you when a trade setup is active. In this way you can anticipate the break of the breakout level to enter the trade. A trailing stop loss is used to exit.
It will work on all timeframes, but as lower timeframes add more noise to the market there will naturally be more losing trades than on higher timeframes. We recommend using it on anywhere from the weekly down to 1 or 2 HR -0.44% timeframes.
It is very simple to use:
The shaded areas on the chart indicate that a trade setup has been detected: Green for bullish setups, red for bearish setups.
The blue dots are plotted as the breakout level, if the price breaks this level the trade is entered. (as you can see on the chart, they can sometimes move towards the price!)
Red crosses are plotted as your trailing stop loss, if price breaks the stop loss the trade is closed.
This is a subscription indicator, please pm for information on how to access.
Happy trading!

Leverage Trading Signal by VarunLeverage Trading Signal:- Best suitable for all the Alt coins and leverage trading in all time frame, best suitable for Binance, Bitmex and Bitfinex Exchange. This signal exactly gives you when to BUY and when to SELL, in leverage same as when to LONG and When to SHORT. According to Backtest of 1000 times with 100s of Altcoins and Leverage Trading is successfully giving 5-8% Profit reward at the end of the day as per your own risk level and own Risk to Reward Setup.
Note:- Best Part is, It has Alert System inbuild, when a signal occurs, it will alert you
DPD INDICATOR (DEMA PRICE DİFFERENCE PERCENTAGE )I use DEMA and Price difference in many strategies and and trade.
Finally , ı wanted to build an indicator for relation between them.
It calculates the percentage of difference between price and dema and estimates deviation from the main trend.
Formula = (price-dema)/price*100
There is some parameters;
DEMA Length is length of dema , ı think 50 is good enough,
there is upper and lower band for DPD Score .
You can change it based on volatilities of your pairs to find an optima.
and use it to be sure about your entry point.
I will developed and combine DPD with some other indicators and build strategies with it.
You can be part of that , I am waiting for your feedback.
Stay in Touch :)

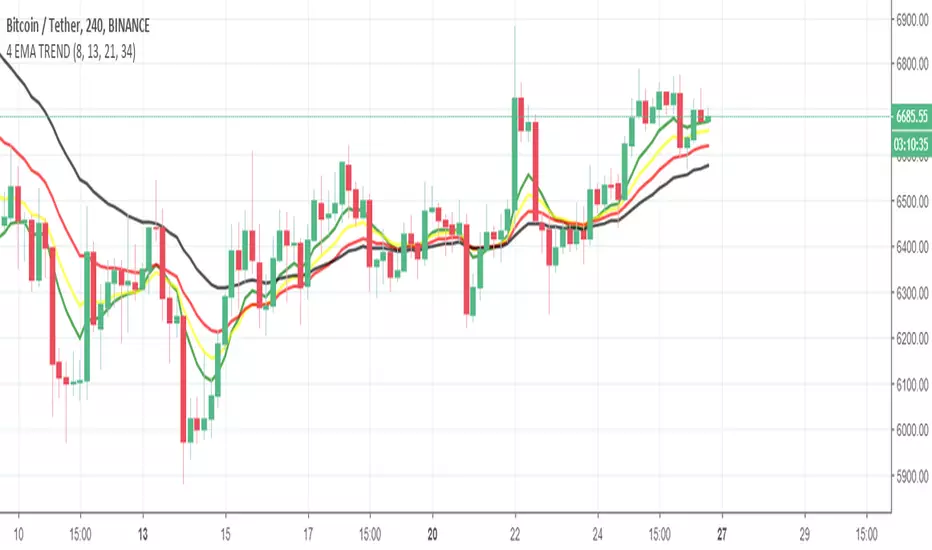
4 EMA TREND INDICATORİf GREEN > YELLOW > RED > BLACK
UPWARD TREND
If BLACK > RED > YELLOW > GREEN
DOWNWARD TREND
In upward trend , if green(fastest ema) crossunder YELLOW or RED or both of them , you can close the position . Dont wait the Downward Trend.
Lengths of EMAs are based on Fibonacci numbers ( 8,13,21,34) , if you want, you can change it based on your strategy.
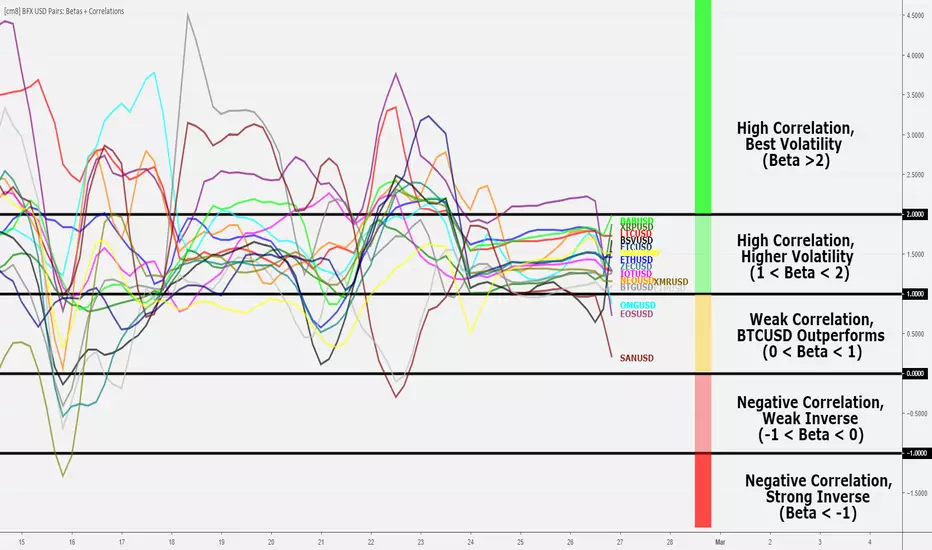
Bitfinex USD Pairs: Betas and Correlations [checkm8]Hello and welcome to my beta and correlation indicator!
This indicator is meant to be used to assess trading alternatives to BTCUSD on Bitfinex, examining alt-USD pairs that can be traded on margin. This list is as follows:
ETHUSD
LTCUSD
EOSUSD
NEOUSD
OMGUSD
XRPUSD
IOTUSD
BCHUSD
SANUSD
ETPUSD
ETCUSD
XMRUSD
ZECUSD
DSHUSD
Before dwelling further on the script, let's revisit the definitions of beta and correlation:
Beta is a statistical measure of a %-change in an asset relative to a 1% change in a benchmark. In our case - this is BTCUSD. For example, if the beta is 1.5, it means that the particular asset moves 1.5% in the same direction as the 1% change of the benchmark. If the beta is negative, the asset is moving in opposite direction of the benchmark. Note: beta is not confined to any range.
Correlation is a statistical measure of the relationship between two assets, from a range of +1 to -1, where a score of +1 implies perfect positive correlation (prices move in the same direction), -1 implies perfect negative correlation (inverse relationship), and 0 implies no relationship in price changes.
For the calculations, BITFINEX:BTCUSD is used as the benchmark.
Through the script's settings:
You can select whether to plot betas or the correlations
You can select the desired length to be used in the measure of beta and correlations
You can enable smoothing for less choppy results. This is accompanied by options to modify the smoothing length and the smoothing method, where SMA, EMA, RMA, and WMA are available.
You can enable and disable individual alt pairs from being displayed (ie. if you do not want LTCUSD plotted, you can turn it off)
Below is an example of the correlation setting.
I would recommend using a smoothing input of 3-6, on SMA, and the 4-hour timeframe for good results. I use this indicator for help in deciding what alt pairs to trade on a particular day, where you will want to trade alts with the highest correlations. Note: be weary of less liquid markets, such as ETP and SAN.
Also note: the labels shown in the snapshot are for presentation purposes only. You can enable Indicator Labels by right clicking the oscillator -> "Price Scale" -> "Indicator Labels".
Please let me know if you have any questions, suggestions, or concerns.
Happy trading!
For additional information as to why you should be using this indicator and trading alts instead of BTCUSD, please refer to my study:
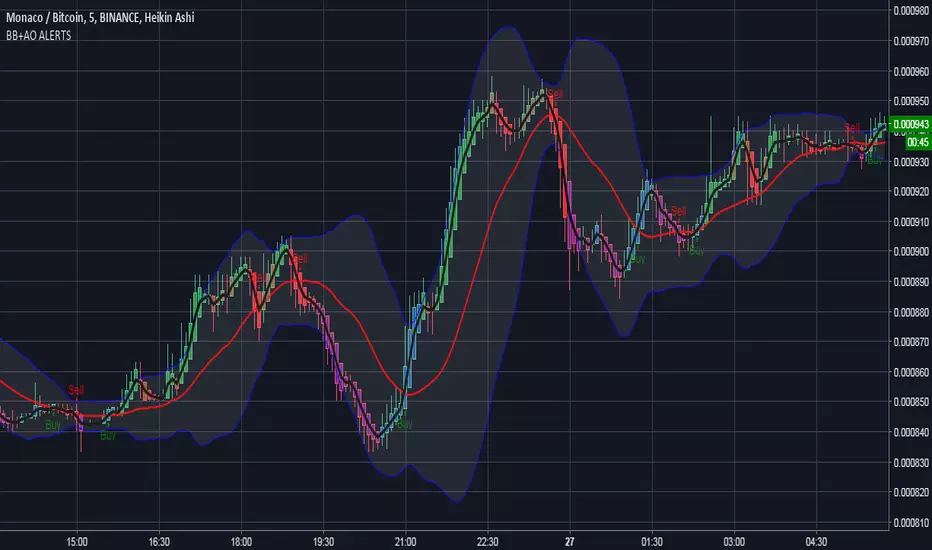
BB+AO ALERTSto be used with AO indicator, based on forex strat --
www.forexstrategiesresources.com
works on 1/3/5/15/30 candles, buy signals are best when the black 3 fast ema crosses up through the red mid band