Infinite EMA with Alpha Control♾️ Infinite EMA with Alpha Control
What Makes This EMA "Infinite"?
Unlike traditional EMA indicators that are limited to typical periods (1-5000), this Infinite EMA breaks all boundaries. You can create EMAs with periods of 1,000, 10,000, or even 1,000,000 bars - that's why it's called "infinite"! Also Infinite EMA starts working immediately from the very first bar on your chart
Why This EMA is "Infinite":
1. Mathematically: When N → ∞, alpha → 0, meaning infinitely long "memory"
2. Practically: You can set any period - even 100,000 bars
3. Flexibility: Alpha allows precise control over the "forgetting speed"
How Does It Work?
The magic lies in the Alpha parameter. While regular EMAs use fixed formulas, this indicator gives you direct control over the EMA's "memory" through Alpha values:
• High Alpha (0.1-0.2): Fast reaction, short memory
• Medium Alpha (0.01-0.05): Balanced response
• Low Alpha (0.0001-0.001): Extremely slow reaction, very long memory
• Ultra-low Alpha (0.000001): Almost frozen in time
The Mathematical Formula:
Alpha = 2 / (Period + 1)
This means you can achieve any EMA period by adjusting Alpha, giving you infinite flexibility!
Expanded "Infinite EMA" Table:
Period EMA (N) - Alpha (Rounded) - Alpha (Exact) - Description
10 - 0.1818 - 0.181818... - Fast EMA
20 - 0.0952 - 0.095238... - Short-term
50 - 0.0392 - 0.039215... - Medium-term
100 - 0.0198 - 0.019801... - Long-term
200 - 0.0100 - 0.009950... - Standard long-term
500 - 0.0040 - 0.003996... - Very long-term
1,000 - 0.0020 - 0.001998... - Super long-term
2,000 - 0.0010 - 0.000999... - Ultra long-term
5,000 - 0.0004 - 0.000399... - Mega long-term
10,000 - 0.0002 - 0.000199... - Giga long-term
25,000 - 0.00008 - 0.000079... - Century-scale EMA
50,000 - 0.00004 - 0.000039... - Practically motionless
100,000 - 0.00002 - 0.000019... - "Glacial" EMA
500,000 - 0.000004 - 0.000003... - Geological timescale
1,000,000 - 0.000002 - 0.000001... - Approaching constant
5,000,000 - 0.0000004 - 0.0000003... - Virtually static
10,000,000 - 0.0000002 - 0.0000001... - Nearly flat line
100,000,000 - 0.00000002 - 0.00000001... - Mathematical infinity
Formula: Alpha = 2/(N+1) where N is the EMA period
Key Features:
Dual EMA System: Run fast and slow EMAs simultaneously
Crossover Signals: Automatic buy/sell signals with customizable alerts
Alpha Control: Direct mathematical control over EMA behavior
Infinite Periods: From 1 to 100,000,000+ bars
Visual Customization: Colors, fills, backgrounds, signal sizes
Instant Start: Works accurately from the very first bar
Update Intervals: Control calculation frequency for noise reduction
Why Choose Infinite EMA?
1. Unlimited Flexibility: Any period you can imagine
2. Mathematical Precision: Direct alpha control for exact behavior
3. Professional Grade: Suitable for all trading styles
4. Easy to Use: Simple settings with powerful results
5. No Warm-up Period: Accurate values from bar #1
Simple Explanation:
Think of EMA as a "memory system":
• High Alpha = Short memory (forgets quickly, reacts fast)
• Low Alpha = Long memory (remembers everything, moves slowly)
With Infinite EMA, you can set the "memory length" to anything from seconds to centuries!
⚡ Instant Start Feature - EMA from First Bar
Immediate Calculation from Bar #1
Unlike traditional EMA indicators that require a "warm-up period" of N bars before showing accurate values, Infinite EMA starts working immediately from the very first bar on your chart.
How It Works:
Traditional EMA Problem:
• Standard 200-period EMA: Needs 200+ bars to become accurate
• First 200 bars: Shows incorrect/unstable values
• Result: Large portions of historical data are unusable
Infinite EMA Solution:
Bar #1: EMA = Current Price (perfect starting point)
Bar #2: EMA = Alpha × Price + (1-Alpha) × Previous EMA
Bar #3: EMA = Alpha × Price + (1-Alpha) × Previous EMA
...and so on
Key Benefits:
No Warm-up Period: Start trading signals from day one
Full Chart Coverage: Every bar has a valid EMA value
Historical Accuracy: Backtesting works on entire dataset
New Markets: Works perfectly on newly listed assets
Short Datasets: Effective even with limited historical data
Practical Impact:
Scenario Traditional EMA Infinite EMA
New cryptocurrency Unusable for first 200 days ✅ Works from day 1
Limited data (< 200 bars) Inaccurate values ✅ Fully functional
Backtesting Must skip first 200 bars ✅ Test entire history
Real-time trading Wait for stabilization ✅ Trade immediately
Technical Implementation:
if barstate.isfirst
EMA := currentPrice // Perfect initialization
else
EMA := alpha × currentPrice + (1-alpha) × previousEMA
This smart initialization ensures mathematical accuracy from the very first calculation, eliminating the traditional EMA "ramp-up" problem.
Why This Matters:
For Backesters: Use 100% of available data
For Live Trading: Get signals immediately on any timeframe
For Researchers: Analyze complete datasets without gaps
Bottom Line: Infinite EMA is ready to work the moment you add it to your chart - no waiting, no warm-up, no exceptions!
Unlike traditional EMAs that require a "warm-up period" of 200+ bars before showing accurate values, Infinite EMA starts working immediately from bar #1.
This breakthrough eliminates the common problem where the first portion of your chart shows unreliable EMA data. Whether you're analyzing a newly listed cryptocurrency, working with limited historical data, or backtesting strategies, every single bar provides mathematically accurate EMA values.
No more waiting periods, no more unusable data sections - just instant, reliable trend analysis from the moment you apply the indicator to any chart.
🔄 Update Interval Bars Feature
The Update Interval feature allows you to control how frequently the EMA recalculates, providing flexible noise filtering without changing the core mathematics.
Set to 1 for standard behavior (updates every bar), or increase to 5-10 for smoother signals that update less frequently. Higher intervals reduce market noise and false signals but introduce slightly more lag. This is particularly useful on volatile timeframes where you want the EMA's directional bias without every minor price fluctuation affecting the calculation.
Perfect for swing traders who prefer cleaner, more stable trend lines over hyper-responsive indicators.
Conclusion
The Infinite EMA transforms the traditional EMA from a fixed-period tool into a precision instrument with unlimited flexibility. By understanding the Alpha-Period relationship, traders can create custom EMAs that perfectly match their trading style, timeframe, and market conditions.
The "infinite" nature comes from the ability to set any period imaginable - from ultra-fast 2-bar EMAs to glacially slow 10-million-bar EMAs, all controlled through a single Alpha parameter.
________________________________________
Whether you're a beginner looking for simple trend following or a professional researcher analyzing century-long patterns, Infinite EMA adapts to your needs. The power of infinite periods is now in your hands! 🚀
Go forward to the horizon. When you reach it, a new one will open up.
- J. P. Morgan
ALPHA-C

40 Ticker Cross-Sectional Z-Scores [BackQuant]40 Ticker Cross-Sectional Z-Scores
BackQuant’s 40 Ticker Cross-Sectional Z-Scores is a powerful portfolio management strategy that analyzes the relative performance of up to 40 different assets, comparing them on a cross-sectional basis to identify the top and bottom performers. This indicator computes Z-scores for each asset based on their log returns and evaluates them relative to the mean and standard deviation over a rolling window. The Z-scores represent how far an asset's return deviates from the average, and these values are used to rank the assets, allowing for dynamic asset allocation based on performance.
By focusing on the strongest-performing assets and avoiding the weakest, this strategy aims to enhance returns while managing risk. Additionally, by adjusting for standard deviations, the system offers a risk-adjusted method of ranking assets, making it suitable for traders who want to dynamically allocate capital based on performance metrics rather than just price movements.
Key Features
1. Cross-Sectional Z-Score Calculation:
The system calculates Z-scores for 40 different assets, evaluating their log returns against the mean and standard deviation over a rolling window. This enables users to assess the relative performance of each asset dynamically, highlighting which assets are performing better or worse compared to their historical norms. The Z-score is a useful statistical tool for identifying outliers in asset performance.
2. Asset Ranking and Allocation:
The system ranks assets based on their Z-scores and allocates capital to the top performers. It identifies the top and bottom assets, and traders can allocate capital to the top-performing assets, ensuring that their portfolio is aligned with the best performers. Conversely, the bottom assets are removed from the portfolio, reducing exposure to underperforming assets.
3. Rolling Window for Mean and Standard Deviation Calculations:
The Z-scores are calculated based on rolling means and standard deviations, making the system adaptive to changing market conditions. This rolling calculation window allows the strategy to adjust to recent performance trends and minimize the impact of outdated data.
4. Mean and Standard Deviation Visualization:
The script provides real-time visualizations of the mean (x̄) and standard deviation (σ) of asset returns, helping traders quickly identify trends and volatility in their portfolio. These visual indicators are useful for understanding the current market environment and making more informed allocation decisions.
5. Top & Bottom Performer Tables:
The system generates tables that display the top and bottom performers, ranked by their Z-scores. Traders can quickly see which assets are outperforming and underperforming. These tables provide clear and actionable insights, helping traders make informed decisions about which assets to include in their portfolio.
6. Customizable Parameters:
The strategy allows traders to customize several key parameters, including:
Rolling Calculation Window: Set the window size for the rolling mean and standard deviation calculations.
Top & Bottom Tickers: Choose how many of the top and bottom assets to display and allocate capital to.
Table Orientation: Select between vertical or horizontal table formats to suit the user’s preference.
7. Forward Test & Out-of-Sample Testing:
The system includes out-of-sample forward tests, ensuring that the strategy is evaluated based on real-time performance, not just historical data. This forward testing approach helps validate the robustness of the strategy in dynamic market conditions.
8. Visual Feedback and Alerts:
The system provides visual feedback on the current asset rankings and allocations, with dynamic labels and plots on the chart. Additionally, users receive alerts when allocations change, keeping them informed of important adjustments.
9. Risk Management via Z-Scores and Std Dev:
The system’s approach to asset selection is based on Z-scores, which normalize performance relative to the historical mean. By incorporating standard deviation, it accounts for the volatility and risk associated with each asset. This allows for more precise risk management and portfolio construction.
10. Note on Mean Reversion Strategy:
If you take the inverse of the signals provided by this indicator, the strategy can be used for mean-reversion rather than trend-following. This would involve buying the underperforming assets and selling the outperforming ones. However, it's important to note that this approach does not work well with highly correlated assets, as the relationship between the assets could result in the same directional movement, undermining the effectiveness of the mean-reversion strategy.
References
www.uts.edu.au
onlinelibrary.wiley.com
www.cmegroup.com
Final Thoughts
The 40 Ticker Cross-Sectional Z-Scores strategy offers a data-driven approach to portfolio management, dynamically allocating capital based on the relative performance of assets. By using Z-scores and standard deviations, this strategy ensures that capital is directed to the strongest performers while avoiding weaker assets, ultimately improving the risk-adjusted returns of the portfolio. Whether you’re focused on trend-following or looking to explore mean-reversion strategies, this flexible system can be tailored to suit your investment goals.

Performance Metrics With Bracketed Rebalacing [BackQuant]Performance Metrics With Bracketed Rebalancing
The Performance Metrics With Bracketed Rebalancing script offers a robust method for assessing portfolio performance, integrating advanced portfolio metrics with different rebalancing strategies. With a focus on adaptability, the script allows traders to monitor and adjust portfolio weights, equity, and other key financial metrics dynamically. This script provides a versatile approach for evaluating different trading strategies, considering factors like risk-adjusted returns, volatility, and the impact of portfolio rebalancing.
Please take the time to read the following:
Key Features and Benefits of Portfolio Methods
Bracketed Rebalancing:
Bracketed Rebalancing is an advanced strategy designed to trigger portfolio adjustments when an asset's weight surpasses a predefined threshold. This approach minimizes overexposure to any single asset while maintaining flexibility in response to market changes. The strategy is particularly beneficial for mitigating risks that arise from significant asset weight fluctuations. The following image illustrates how this method reacts when asset weights cross the threshold:
Daily Rebalancing:
Unlike the bracketed method, Daily Rebalancing adjusts portfolio weights every trading day, ensuring consistent asset allocation. This method aims for a more even distribution of portfolio weights, making it a suitable option for traders who prefer less sensitivity to individual asset volatility. Here's an example of Daily Rebalancing in action:
No Rebalancing:
For traders who prefer a passive approach, the "No Rebalancing" option allows the portfolio to remain static, without any adjustments to asset weights. This method may appeal to long-term investors or those who believe in the inherent stability of their selected assets. Here’s how the portfolio looks when no rebalancing is applied:
Portfolio Weights Visualization:
One of the standout features of this script is the visual representation of portfolio weights. With adjustable settings, users can track the current allocation of assets in real-time, making it easier to analyze shifts and trends. The following image shows the real-time weight distribution across three assets:
Rolling Drawdown Plot:
Managing drawdown risk is a critical aspect of portfolio management. The Rolling Drawdown Plot visually tracks the drawdown over time, helping traders monitor the risk exposure and performance relative to the peak equity levels. This feature is essential for assessing the portfolio's resilience during market downturns:
Daily Portfolio Returns:
Tracking daily returns is crucial for evaluating the short-term performance of the portfolio. The script allows users to plot daily portfolio returns to gain insights into daily profit or loss, helping traders stay updated on their portfolio’s progress:
Performance Metrics
Net Profit (%):
This metric represents the total return on investment as a percentage of the initial capital. A positive net profit indicates that the portfolio has gained value over the evaluation period, while a negative value suggests a loss. It's a fundamental indicator of overall portfolio performance.
Maximum Drawdown (Max DD):
Maximum Drawdown measures the largest peak-to-trough decline in portfolio value during a specified period. It quantifies the most significant loss an investor would have experienced if they had invested at the highest point and sold at the lowest point within the timeframe. A smaller Max DD indicates better risk management and less exposure to significant losses.
Annual Mean Returns (% p/y):
This metric calculates the average annual return of the portfolio over the evaluation period. It provides insight into the portfolio's ability to generate returns on an annual basis, aiding in performance comparison with other investment opportunities.
Annual Standard Deviation of Returns (% p/y):
This measure indicates the volatility of the portfolio's returns on an annual basis. A higher standard deviation signifies greater variability in returns, implying higher risk, while a lower value suggests more stable returns.
Variance:
Variance is the square of the standard deviation and provides a measure of the dispersion of returns. It helps in understanding the degree of risk associated with the portfolio's returns.
Sortino Ratio:
The Sortino Ratio is a variation of the Sharpe Ratio that only considers downside risk, focusing on negative volatility. It is calculated as the difference between the portfolio's return and the minimum acceptable return (MAR), divided by the downside deviation. A higher Sortino Ratio indicates better risk-adjusted performance, emphasizing the importance of avoiding negative returns.
Sharpe Ratio:
The Sharpe Ratio measures the portfolio's excess return per unit of total risk, as represented by standard deviation. It is calculated by subtracting the risk-free rate from the portfolio's return and dividing by the standard deviation of the portfolio's excess return. A higher Sharpe Ratio indicates more favorable risk-adjusted returns.
Omega Ratio:
The Omega Ratio evaluates the probability of achieving returns above a certain threshold relative to the probability of experiencing returns below that threshold. It is calculated by dividing the cumulative probability of positive returns by the cumulative probability of negative returns. An Omega Ratio greater than 1 indicates a higher likelihood of achieving favorable returns.
Gain-to-Pain Ratio:
The Gain-to-Pain Ratio measures the return per unit of risk, focusing on the magnitude of gains relative to the severity of losses. It is calculated by dividing the total gains by the total losses experienced during the evaluation period. A higher ratio suggests a more favorable balance between reward and risk.
www.linkedin.com
Compound Annual Growth Rate (CAGR) (% p/y):
CAGR represents the mean annual growth rate of the portfolio over a specified period, assuming the investment has been compounding over that time. It provides a smoothed annual rate of growth, eliminating the effects of volatility and offering a clearer picture of long-term performance.
Portfolio Alpha (% p/y):
Portfolio Alpha measures the portfolio's performance relative to a benchmark index, adjusting for risk. It is calculated using the Capital Asset Pricing Model (CAPM) and represents the excess return of the portfolio over the expected return based on its beta and the benchmark's performance. A positive alpha indicates outperformance, while a negative alpha suggests underperformance.
Portfolio Beta:
Portfolio Beta assesses the portfolio's sensitivity to market movements, indicating its exposure to systematic risk. A beta greater than 1 suggests the portfolio is more volatile than the market, while a beta less than 1 indicates lower volatility. Beta is used to understand the portfolio's potential for gains or losses in relation to market fluctuations.
Skewness of Returns:
Skewness measures the asymmetry of the return distribution. A positive skew indicates a distribution with a long right tail, suggesting more frequent small losses and fewer large gains. A negative skew indicates a long left tail, implying more frequent small gains and fewer large losses. Understanding skewness helps in assessing the likelihood of extreme outcomes.
Value at Risk (VaR) 95th Percentile:
VaR at the 95th percentile estimates the maximum potential loss over a specified period, given a 95% confidence level. It provides a threshold value such that there is a 95% probability that the portfolio will not experience a loss greater than this amount.
Conditional Value at Risk (CVaR):
CVaR, also known as Expected Shortfall, measures the average loss exceeding the VaR threshold. It provides insight into the tail risk of the portfolio, indicating the expected loss in the worst-case scenarios beyond the VaR level.
These metrics collectively offer a comprehensive view of the portfolio's performance, risk exposure, and efficiency. By analyzing these indicators, investors can make informed decisions, balancing potential returns with acceptable levels of risk.
Conclusion
The Performance Metrics With Bracketed Rebalancing script provides a comprehensive framework for evaluating and optimizing portfolio performance. By integrating advanced metrics, adaptive rebalancing strategies, and visual analytics, it empowers traders to make informed decisions in managing their investment portfolios. However, it's crucial to consider the implications of rebalancing strategies, as academic research indicates that predictable rebalancing can lead to market impact costs. Therefore, adopting flexible and less predictable rebalancing approaches may enhance portfolio performance and reduce associated costs.

CAPM Alpha & BetaThe CAPM Alpha & Beta indicator is a crucial tool in finance and investment analysis derived from the Capital Asset Pricing Model (CAPM) . It provides insights into an asset's risk-adjusted performance (Alpha) and its relationship to broader market movements (Beta). Here’s a breakdown:
1. How Does It Work?
Alpha:
Definition: Alpha measures the portion of an investment's return that is not explained by market movements, i.e., the excess return over and above what the market is expected to deliver.
Purpose: It represents the value a fund manager or strategy adds (or subtracts) from an investment’s performance, adjusting for market risk.
Calculation:
Alpha is derived from comparing actual returns to expected returns predicted by CAPM:
Alpha = Actual Return − (Risk-Free Rate + β × (Market Return − Risk-Free Rate))
Alpha = Actual Return − (Risk-Free Rate + β × (Market Return − Risk-Free Rate))
Interpretation:
Positive Alpha: The investment outperformed its CAPM prediction (good performance for additional value/risk).
Negative Alpha: The investment underperformed its CAPM prediction.
Beta:
Definition: Beta measures the sensitivity of an asset's returns relative to the overall market's returns. It quantifies systematic risk.
Purpose: Indicates how volatile or correlated an investment is relative to the market benchmark (e.g., S&P 500).
Calculation:
Beta is computed as the ratio of the covariance of the asset and market returns to the variance of the market returns:
β = Covariance (Asset Return, Market Return) / Variance (Market Return)
β = Variance (Market Return) Covariance (Asset Return, Market Return)
Interpretation:
Beta = 1: The asset’s price moves in line with the market.
Beta > 1: The asset is more volatile than the market (higher risk/higher potential reward).
Beta < 1: The asset is less volatile than the market (lower risk/lower reward).
Beta < 0: The asset moves inversely to the market.
2. How to Use It?
Using Alpha:
Portfolio Evaluation: Investors use Alpha to gauge whether a portfolio manager or a strategy has successfully outperformed the market on a risk-adjusted basis.
If Alpha is consistently positive, the portfolio may deliver higher-than-expected returns for the given level of risk.
Stock/Asset Selection: Compare Alpha across multiple securities. Positive Alpha signals that the asset may be a good addition to your portfolio for excess returns.
Adjusting Investment Strategy: If Alpha is negative, reassess the asset's role in the portfolio and refine strategies.
Using Beta:
Risk Management:
A high Beta (e.g., 1.5) indicates higher sensitivity to market movements. Use such assets if you want to take on more risk during bullish market phases or expect higher returns.
A low Beta (e.g., 0.7) indicates stability and is useful in diversifying risk in volatile or bearish markets.
Portfolio Diversification: Combine assets with varying Betas to achieve the desired level of market responsiveness and smooth out portfolio volatility.
Monitoring Systematic Risk: Beta helps identify whether an investment aligns with your risk tolerance. For example, high-Beta stocks may not be suitable for conservative investors.
Practical Application:
Use both Alpha and Beta together:
Assess performance with Alpha (excess returns).
Assess risk exposure with Beta (market sensitivity).
Example: A stock with a Beta of 1.2 and a highly positive Alpha might suggest a solid performer that is slightly more volatile than the market, making it a suitable pick for risk-tolerant, return-maximizing investors.
In conclusion, the CAPM Alpha & Beta indicator gives a comprehensive view of an asset's performance and risk. Alpha enables performance evaluation on a risk-adjusted basis, while Beta reveals the level of market risk. Together, they help investors make informed decisions, build optimal portfolios, and align investments with their risk-return preferences.

Relative Performance SuiteOverview
The Relative Performance Suite (RPS) is a versatile and comprehensive indicator designed to evaluate an asset's performance relative to a benchmark. By offering multiple methods to measure performance, including Relative Performance, Alpha, and Price Ratio, this tool helps traders and investors assess asset strength, resilience, and overall behavior in different market conditions.
Key Features:
✅ Multiple Performance Measures:
Choose from various relative performance calculations, including:
Relative Performance:
Measures how much an asset has outperformed or underperformed its benchmark over a given period.
Relative Performance (Proportional):
A proportional version of relative performance,
factoring in scaling effects.
Relative Performance (MA Based):
Uses moving averages to smooth performance fluctuations.
Alpha:
A measure of an asset’s performance relative to what would be expected based on its beta and the benchmark’s return. It represents the excess return above the risk-free rate after adjusting for market risk.
Price Ratio:
Compares asset prices directly to determine relative value over time.
✅ Customizable Moving Averages:
Apply different moving average types (SMA, EMA, SMMA, WMA, VWMA) to smooth price inputs and refine calculations.
✅ Beta Calculation:
Includes a Beta measure used in Alpha calculation, which users can toggle the visibility of helping users understand an asset's sensitivity to market movements.
✅ Risk-Free Rate Adjustment:
Incorporate risk-free rates (e.g., US Treasury yields, Fed Funds Rate) for a more accurate calculation of Alpha.
✅ Logarithmic Returns Option:
Users can switch between standard returns and log returns for more refined performance analysis.
✅ Dynamic Color Coding:
Identify outperformance or underperformance with intuitive color coding.
Option to color bars based on relative strength, making chart analysis easier.
✅ Customizable Tables for Data Display:
Overview table summarizing key metrics.
Explanation table offering insights into how values are derived.
How to Use:
Select a Benchmark: Choose a comparison symbol (e.g., TOTAL or SPX ).
Pick a Performance Metric: Use different modes to analyze relative performance.
Customize Calculation Methods: Adjust moving averages, timeframes, and log returns based on preference.
Interpret the Colors & Tables: Utilize the dynamic coloring and tables to quickly assess market conditions.
Ideal For:
Traders looking to compare individual asset performance against an index or benchmark.
Investors analyzing Alpha & Beta to understand risk-adjusted returns.
Market analysts who want a visually intuitive and data-rich performance tracking tool.
This indicator provides a powerful and flexible way to track relative asset strength, helping users make more informed trading decisions.

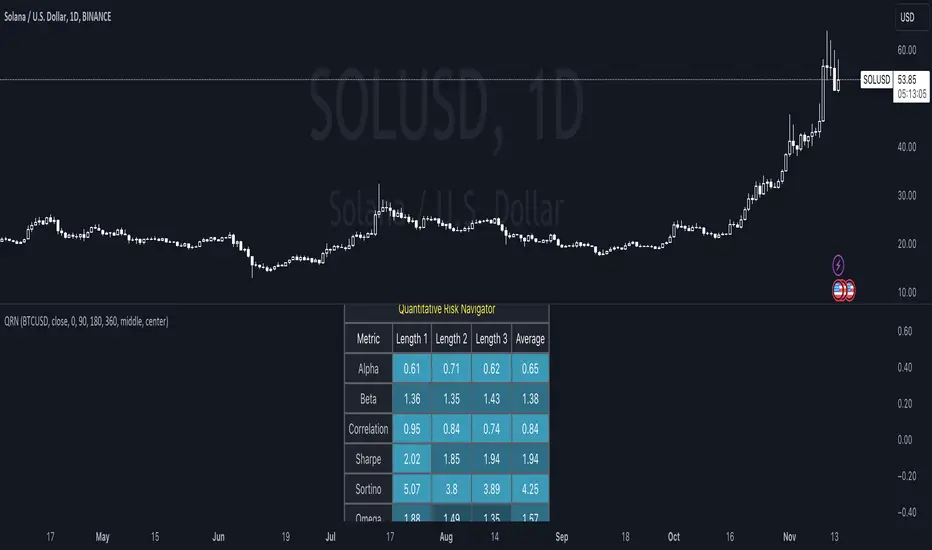
Quantitative Risk Navigator [kikfraben]📊 Quantitative Risk Navigator - Your Financial Performance GPS
Navigate the complexities of financial markets with confidence using the Quantitative Risk Navigator. This indicator provides you with a comprehensive dashboard to assess and understand the risk and performance of your chosen asset.
📈 Key Features:
Alpha and Beta Analysis: Uncover the outperformance (Alpha) and risk exposure (Beta) of your asset compared to a selected benchmark. Know where your investment stands in the market.
Correlation Insights: Understand the relationship between your asset and its benchmark through a clear visualization of correlation trends over different time lengths.
Risk-Return Metrics: Evaluate risk and return simultaneously with Sharpe and Sortino ratios. Make informed decisions by assessing the reward-to-risk ratio of your investment.
Omega Ratio: Gain deeper insights into your asset's performance by analyzing the Omega Ratio, which highlights the distribution of positive and negative returns.
Customizable Visualization: Tailor your chart to focus on specific metrics and time frames. Choose which metrics to display, allowing you to concentrate on the aspects that matter most to you.
Interactive Metrics Table: A user-friendly metrics table provides a quick overview of key values, including average metrics, enabling you to grasp the financial health of your asset at a glance.
Color-Coded Clarity: The indicator employs color-coded visualizations, making it easy to identify bullish and bearish trends, helping you make rapid and informed decisions.
🛠️ How to Use:
Symbol Selection: Choose your base symbol and preferred data source for analysis.
Risk-Free Rate: Input your risk-free rate to fine-tune calculations.
Length Customization: Adjust the lengths for different metrics to align with your analysis preferences.
Whether you're a seasoned trader or just stepping into the financial world, the Quantitative Risk Navigator empowers you to make strategic decisions by providing a comprehensive view of your asset's risk and return profile. Stay in control of your investments with this powerful financial GPS.
🚀 Start Navigating Your Financial Journey Today!
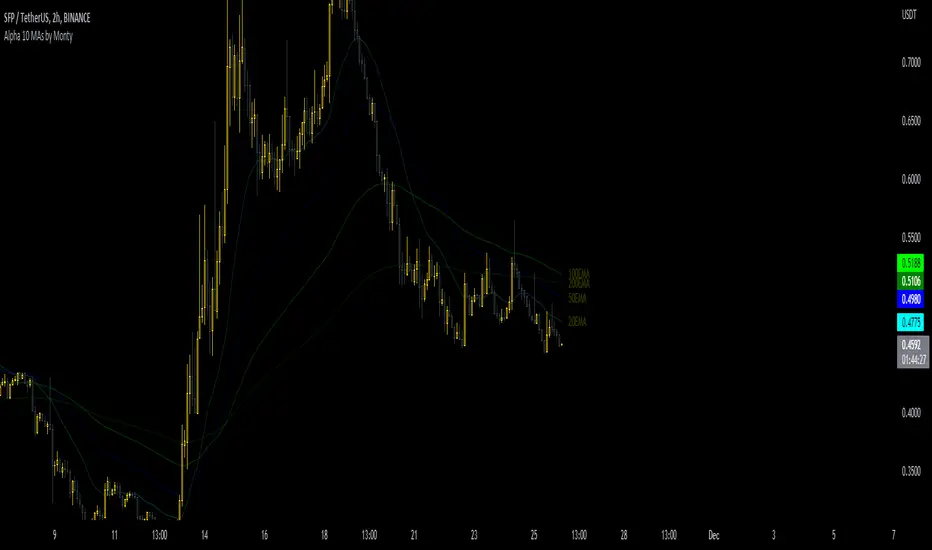
10 MAs Alpha Indicator by MontyThis indicator is a part of the script I coded earlier this month.
The name is to surprise one of our discord member.
I will publish that indicator in a few days as well, but publishing this as a gesture of giving back to the community.
Indicator has:
10 Moving Averages
Adjustable Color, Opacity and Size etc
Shows Labels for each of the MA.
Can be shifted between EMA or SMA
Can be fixed to show a specific TF MA on current Timeframe.
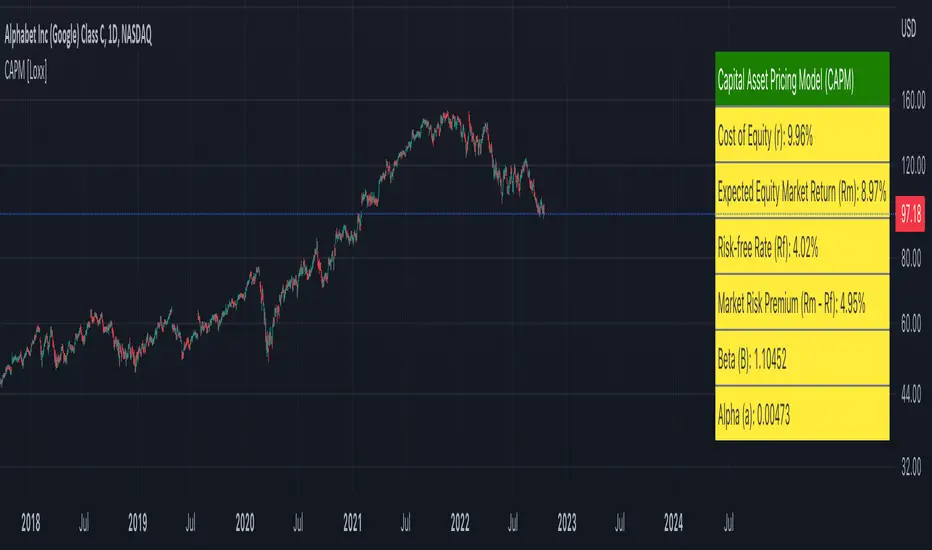
Capital Asset Pricing Model (CAPM) [Loxx]Capital Asset Pricing Model (CAPM) demonstrates how to calculate the Cost of Equity for an underlying asset using Pine Script. This script will only work on the monthly timeframe. While you can change the default inputs, you should study what CAPM is and how this works before doing so. This indicator pulls various types of data from SPY from various timeframes to calculate risk-free rates, market premiums, and log returns. Alpha and Beta are computed using the regression between underlying asset and SPY. This indicator only calculates on the most recent data. If you wish to change this, you'll have to save the script and make adjustments. A few examples where CAPM is used:
Used as the mu factor Geometric Brownian Motion models for options pricing and forecasting price ranges and decay
Calculating the Weighted Average Cost of Capital
Asset pricing
Efficient frontier
Risk and diversification
Security market line
Discounted Cashflow Analysis
Investment bankers use CAPM to value deals
Account firms use CAPM to verify asset prices and assumptions
Real estate firms use variations of CAPM to value properties
... and more
Details of the calculations used here
Rm is calculated using yearly simple returns data from SPY, typically this is just hard coded as 10%.
Rf is pulled from US 10 year bond yields
Beta and Alpha are pulled form monthly returns data of the asset and SPY
In the past, typically this data is purchased from investments banks whose research arms produce values for beta, alpha, risk free rate, and risk premiums. In 2022 ,you can find free estimates for each parameter but these values might not reflect the most current data or research.
History
The CAPM was introduced by Jack Treynor (1961, 1962), William F. Sharpe (1964), John Lintner (1965) and Jan Mossin (1966) independently, building on the earlier work of Harry Markowitz on diversification and modern portfolio theory. Sharpe, Markowitz and Merton Miller jointly received the 1990 Nobel Memorial Prize in Economics for this contribution to the field of financial economics. Fischer Black (1972) developed another version of CAPM, called Black CAPM or zero-beta CAPM, that does not assume the existence of a riskless asset. This version was more robust against empirical testing and was influential in the widespread adoption of the CAPM.
Usage
The CAPM is used to calculate the amount of return that investors need to realize to compensate for a particular level of risk. It subtracts the risk-free rate from the expected rate and weighs it with a factor – beta – to get the risk premium. It then adds the risk premium to the risk-free rate of return to get the rate of return an investor expects as compensation for the risk. The CAPM formula is expressed as follows:
r = Rf + beta (Rm – Rf) + Alpha
Therefore,
Alpha = R – Rf – beta (Rm-Rf)
Where:
R represents the portfolio return
Rf represents the risk-free rate of return
Beta represents the systematic risk of a portfolio
Rm represents the market return, per a benchmark
For example, assuming that the actual return of the fund is 30, the risk-free rate is 8%, beta is 1.1, and the benchmark index return is 20%, alpha is calculated as:
Alpha = (0.30-0.08) – 1.1 (0.20-0.08) = 0.088 or 8.8%
The result shows that the investment in this example outperformed the benchmark index by 8.8%.
The alpha of a portfolio is the excess return it produces compared to a benchmark index. Investors in mutual funds or ETFs often look for a fund with a high alpha in hopes of getting a superior return on investment (ROI).
The alpha ratio is often used along with the beta coefficient, which is a measure of the volatility of an investment. The two ratios are both used in the Capital Assets Pricing Model (CAPM) to analyze a portfolio of investments and assess its theoretical performance.
To see CAPM in action in terms of calculate WACC, see here for an example: finbox.com
Further reading
en.wikipedia.org
AlphaTrend Strategy with Trailing SL %this is a modified version of AlphaTrend Strategy with added trailing Stop Loss
this is my first script that I have added to tradingview community
the trailing SL makes it very effective to lower the losses and can improve the overall return

regressLibrary "regress"
produces the slope (beta), y-intercept (alpha) and coefficient of determination for a linear regression
regress(x, y, len) regress: computes alpha, beta, and r^2 for a linear regression of y on x
Parameters:
x : the explaining (independent) variable
y : the dependent variable
len : use the most recent "len" values of x and y
Returns: : alpha is the x-intercept, beta is the slope, an r2 is the coefficient of determination
Note: the chart does not show anything, use the return values to compute model values in your own application, if you wish.

Market Movers: Sectoral IndexThe indicator will show the Sectors which are leading or lagging NIFTY50 index based on Alpha & Beta values. Stock selection can be done based on the respective Sectors.
Look for alpha & beta values.
Prefer one with high beta.
Greens are leaders & Blues are lagers.
This don't completely indicates a trend, but it can give the overview of a major trend & market movers.
Gray line is the base index NIFTY50, it is Zero.
Turn on Indicator Name Label in Settings > Chart Settings.
In intraday or positions, in a leading Sector there will be a leading stock, spot it out.
Make a sector wise watchlist of stocks.
Use higher or Daily timeframe for Swing trades.
Detailed descriptions are available in my previous Alpha & Beta indicators.

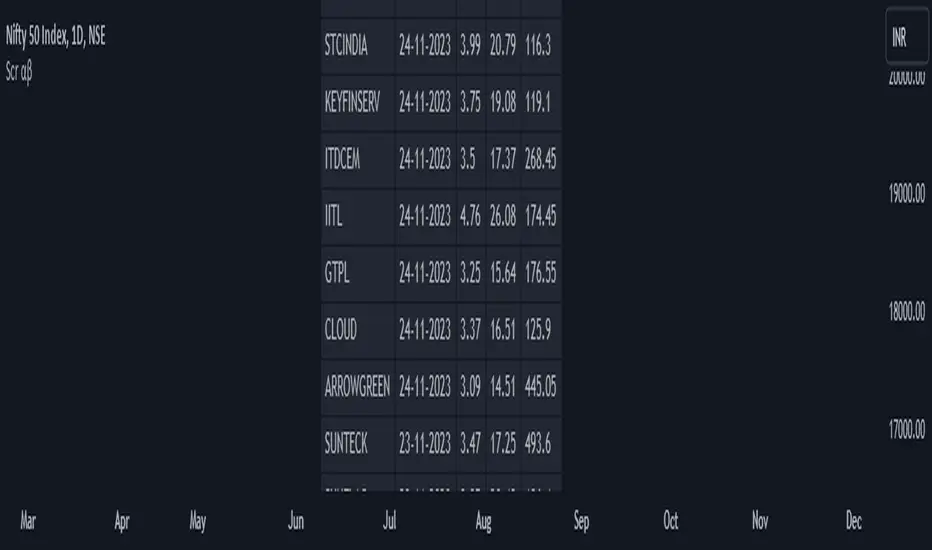
Screener: Alpha & Beta IndexThis is a Index Screener which can short list the major Sectors contributing to NIFTY movement that day.
This helps in sector based trading, in which we can trade in the stocks which falls under that particular sector.
No need to roam around all the stocks in the whole watchlist.
It is recommended to create sector wise watchlist of all sectors. It will be easier to concentrate in only one sector.
For example in IT sector index there are certain stocks which contribute to the movement of IT sector.
This will be available in NSE (or exchange website).
For detailed description check out the descriptions in my previous 2 Alpha and Beta indicators.
Combine and use this screener with my previous Alpha & Beta indicator.

Screener: Alpha & BetaThis is a Live Screener for my previous Alpha & Beta indicator, which filters stocks lively based on the given values.
Use 5min timeframe for Live Intraday.
The default stocks in the screener is selected based on high beta value from F&O listed stocks. It may include other stocks also.
User can input stocks of your choice either through the menu or through the Pine editor.
The maximum number of stocks inputs is only 40. The indicator includes only 20 stocks by default.
More number of stocks can be added but it makes the screener slower to load.
Open the indicator in a sperate tab or window to avoided the loading lag.
It is recommended to choose only 10 to 20 stocks based on the weightage from each sectors.
Beta values are dynamic. It changes from day to day based on the trend and sector.
Update the sock list weekly or twice a week or monthly.
Use investing.com screener(preferably) or TradingView screener for shortlisting beta stocks.
Remember that majority of indicators fails in a sideways market, also every indicator is not 100% accurate.
Alpha & BetaHow to use Alpha(α)?
If Alpha is positive the stock outperforms, if the value is negative means the stock underperforms.
α < 0: The investment has earned too little for its risk (or, was too risky for the return)
α = 0: The investment has earned a return adequate for the risk taken
α > 0: The investment has a return in excess of the reward for the assumed risk
How to use Beta(β)?
β = 1: Exactly as volatile as the index
β > 1: More volatile than the index
β < 1 > 0: Less volatile than the index
β = 0: Uncorrelated to the index
β < 0: Negatively correlated to the index
β > 2: Trending stock
Higher the β higher risk/reward
Example: If the beta is 1.1, the share price is like to move by 10% more than the index
Trading Tip
Choose a stock with Alpha greater than 0 and Beta greater than 1.9 for intraday in 5min timeframe for long positions
Remember that such stocks will have high risk and high reward
Shortlist stocks with Beta greater than 1.9 for next day in 5min timeframe

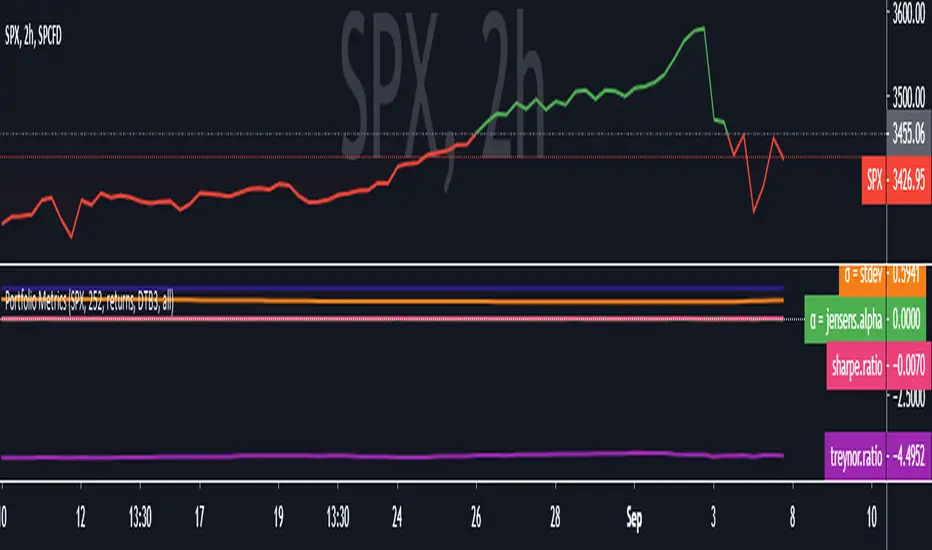
Portfolio: alpha, beta, stdev, variance, mean, max drawdown...Portfolio Metrics **New**
'returns'
'log returns'
'geometric returns'
portfolio alpha
portfolio beta
portfolio,market correlation
portfolio standard deviation
portfolio variance
mean portfolio returns
maximum drawdown
maximum gain

Portfolio Metrics = α(Jensen's), β, CAPM(Ra), Sharpe, TreynorPortfolio Metrics...
Standard Deviation
Jensen's Alpha
Beta
Expected Return (CAPM, Ra)
Sharpe Ratio
Treynor Ratio
Alpha & BetaAlpha & Beta Indicators for Portfolio Performance
β = Σ Correlation (RP, RM) * (σP/σM)
α P = E(RP) –
Where,
RP = Portfolio Return (or Investment Return)
RM = Market Return (or Benchmark Index)
RF = Risk-Free Rate
How to use the Indicator
RM = SPX (Default)
The Market Return for the indicator has the options of $SPX, $NDX, or $DJI (S&P 500, Nasdaq 100, Dow 30)
RF = FRED: DTB3
The Risk-Free Rate in the Indicator is set to the 3-Month Treasury Bill: Secondary Market Rate
The Default Timeframe is 1260 or 5-Years (252 Trading Days in One Year)
RP = The symbol you enter
HOWEVER , you can determine your portfolio value by following the following directions below.
Note: I am currently working on an indicator that will allow you to insert the weights of your positions.
Complete Portfolio Analysis Directions
You will first need...
a) spreadsheet application - Google Sheets is Free, but Microsoft Excel will convert ticker symbols to Stocks and Retrieve Data.
b) your current stock tickers, quantity of shares, and last price information
In the spreadsheet,
In the first column list the stock tickers...
AMZN
AAPL
TSLA
In the second column list the quantity of shares you own...
5
10
0.20
In the third column insert the last price
Excel: Three tickers will automatically give you the option to "Convert to Stocks",
after conversion, click once on cell and click the small tab in the upper right-hand of the highlighted cell.
Click the tab and a menu pops up
Find "Price", "Price Extended-Hours", or "Previous Close"...
$3,284.72
$497.48
$2,049.98
Next, multiply the number of shares by the price (Stock Market Value)
Excel: in fourth column type "=(B1*C1)", "=(B2*C2)", "=(B3*C3)"...
= $16,423.60
= $4,974.80
= $410.00
add the three calculated numbers together or click "ΣAutoSum" (Portfolio Market Value)
= $21,808.40
Last, divide the market value of AMZN ($16,423.60) by the Portfolio Market Value ($21,808.40) for each of the stocks.
= 0.7531
= 0.2281
= 0.0188
These values are the weight of the stock in your portfolio.
Go back to TradingView
Enter into the "search box" the following...
AMZN*0.7531 + AAPL*0.2281 + TSLA*0.0188
and click Enter
Now you can use the "Alpha & Beta" Indicator to analyze your entire portfolio!

Fill Strength Gradient [BigBitsIO]This script plots two moving averages but is mostly designed to highlight a fill strength gradient. The fill strength gradient shows a more opaque fill based on the current percentage difference of the current difference to the maximum difference in two MAs in a trend.
Citation: PinceCoders - Slight modification on color functions

Alpha-Decreasing Exponential Moving AverageThe alpha parameter of this moving average decreases with every new bar on the chart, so it will become more slowly and slowly in course of time. Can act like additional support/resistance line but works in an acceptable way on weekly and monthly timeframes only.

Alpha-Sutte ModelThe Alpha-Sutte model is an ongoing project run by Ansari Saleh Ahmar, a lecturer and researcher at Universitas Negeri Makassar in Indonesia, that attempts to make forecasts for time series like how Arima and Holt-Winters models do. Currently Ahmar and his team have conducted research and published papers comparing the efficacy of the Alpha-Sutte and other models, such as Arima and Holt-Winters, on topics ranging from forecasting Turkey's CPI data, Bitcoin prices, Apple's stock prices, primary energy supply of Indonesia, to infant mortality rates in China.
The Alpha-Sutte model in comparison to the other two models listed above shows promise in providing a more accurate forecast, and the project has been able to receive some of its funding from organizations such as the US Agency for International Development, which is a part of the US Federal Government, so maybe the project has some actual merit.
How it works:
In this model there are four values presented at the top of the window.
1) The first value in blue is the value of the Alpha-Sutte model whose purpose is to forecast the price of the current bar.
2) The second value in yellow is an adaptive version of the Alpha-Sutte model that I made. The purpose of the adaptive Alpha-Sutte model is to expand upon the Alpha-Sutte by allowing new information to be introduced, causing the value to change during the current period, hence the adaptiveness of it.
3) The third value in aqua is the moving average of the low% Sutte line which is a predictive line that is based off of the close and low of the current and previous periods.
4) The fourth value in red is the moving average of the high% Sutte line which is a predictive line that is based off of the close and high of the current and previous periods.
Trend signals:
If low% Sutte (aqua value/line) is greater than high% Sutte (red value/line) then this is a buy signal.
If high% Sutte (red value/line) is greater than low% Sutte (aqua value/line) then this is a sell signal.
Caveat:
Even though this model's purpose is to forecast the future, will it be able to predict periods of large movements? No, of course not, but it will adjust quickly to try to make more accurate forecasts for the next period. This was also a reason why I made an adaptive version of this model to try to reduce some of the discrepancies between the Alpha Sutte and price when there is a large unexpected move.
*WARNING before using this I would highly recommend that you look up "Sutte Indicator" online and read some of the papers about this model before you use this , even though this model has shown merit when compared to Arima and Holt-Winter models this is still an ongoing project.*
Hopefully this project will actually come to something in the near future as the calculation for this time series predictive model is much easier to calculate and program in pine editor than something like an Arima model.
*Also, if you know how to use R language there is a package for the "Alpha-Sutte model".*

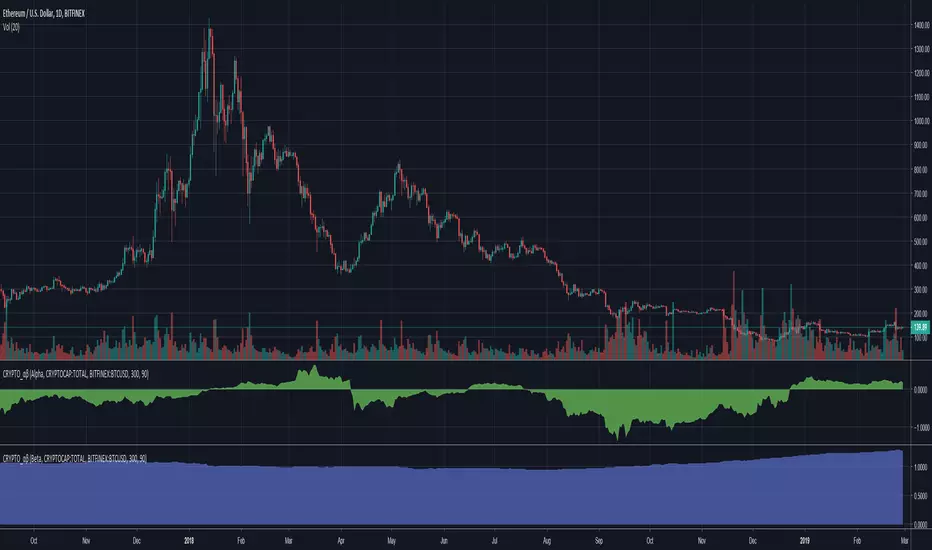
Cryptocurrency α / β (Alpha and Beta)Alpha and Beta for cryptocurrency. Custom input for other symbols.
[NG] Indicator - Altcoin Alpha - v1(Created for Client)
Alpha (Unique price action of asset) indicator for ALTcoins implementation, taking `BINANCE:BTCUSDT` as the market reference. Can be improved by adding more BTC charts from more sources, so as to get a unified chart of BTC for market representation.
Set `alpha period` to a value, wherein you want to see the unique price action of the asset. For short term trend, a value of 24 is good for `1H` charts (1 day), and value of 168 is good for long term trends on `1H` charts (1 week trend).
Corresponding values of `beta period` should be `168` (1 week for 1 day alpha) and `720` (1 month for 1 week alpha period).
You can set `alpha` and `beta` period as per your requirements.
Regards,

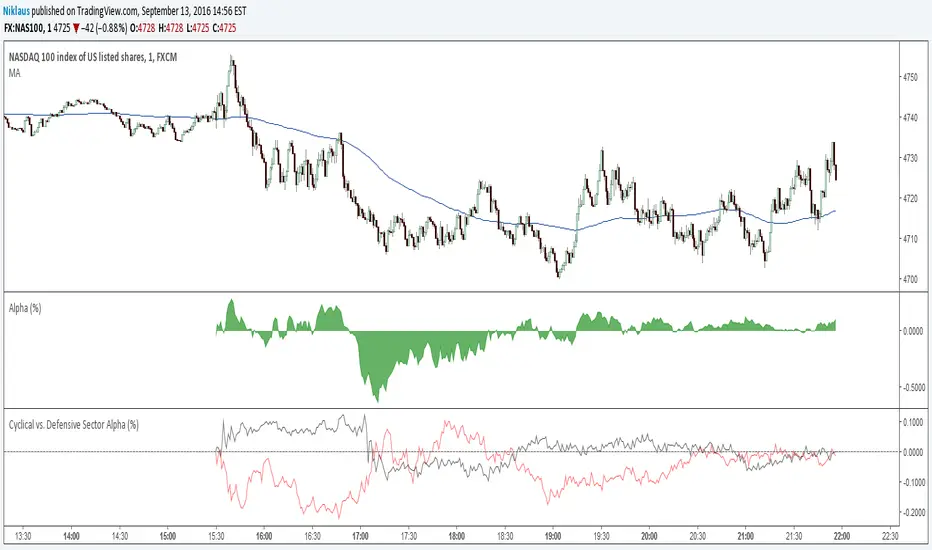
Cyclical vs. Defensive Sector Alphashows mean excess returns of defensive and cyclical sectors vs. S&P500