Universal 10 MA be @cryptoingenerUniversal Multi MA (10 Moving Averages, Dynamic Colors, Multi-TF, By @CryptoIngener
Short Description (Краткое описание):
Indicator for plotting up to 10 moving averages of any type (SMA, EMA, WMA, HMA, RMA, DEMA, KAMA) on any timeframe, with dynamic coloring and customizable line thickness. Includes a subtle green watermark for copyright.
“This script is provided for educational and informational purposes only.”
Alma

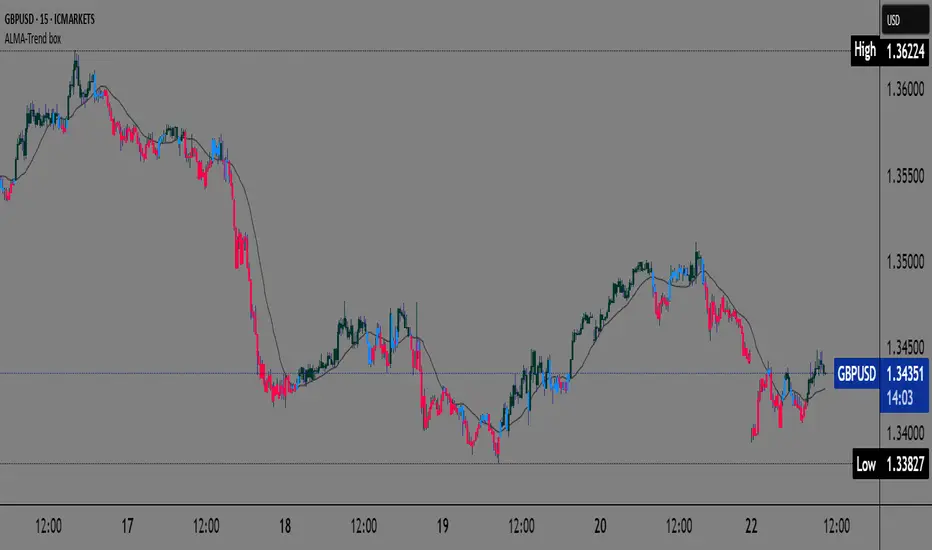
ALMA Trend-boxALMA Trend-box — an innovative indicator for detecting trend and consolidation based on the ALMA moving average
This indicator combines the Adaptive Laguerre Moving Average (ALMA) with unique visual representations of trend and consolidation zones, providing traders with clearer and deeper insight into current market conditions.
Originality and Usefulness
Unlike classic indicators based on simple moving averages, ALMA uses a Gaussian weighting function and an offset parameter to reduce lag, resulting in smoother and more accurate trend signals. This indicator not only plots the ALMA but also analyzes the slope angle of the ALMA line, combining it with the price’s position relative to the moving average to identify three key market states:
Uptrend (bullish): when the ALMA slope angle is above a defined threshold and the price is above ALMA,
Downtrend (bearish): when the slope angle is below a negative threshold and the price is below ALMA,
Consolidation or sideways trend: when neither of the above conditions is met.
A special contribution is the automatic identification of consolidation zones (periods of weak trend or transition between bullish and bearish phases), visually represented by blue-colored candlesticks on the chart. This feature can help traders better recognize moments when the market is indecisive and adjust their strategies accordingly.
How the Indicator Works
ALMA is calculated using user-defined parameters — length, offset, and sigma — which can be adjusted for different timeframes and instruments.
The slope angle of the ALMA line is calculated based on the difference between the current and previous ALMA values, converted into degrees.
Based on the slope angle and the relative price position to ALMA, the indicator determines the trend type and changes the candle colors accordingly:
Green for bullish (uptrend),
Red for bearish (downtrend),
Blue for sideways trend (consolidation).
When the slope angle falls within a certain range and the price behavior contradicts the trend, the indicator detects consolidation and displays it graphically through semi-transparent boxes and background color.
How to Use This Indicator
Use candle colors for quick identification of the current trend and potential trend reversals.
Pay attention to consolidation zones marked by boxes (blue candles), as these are potential signals for trend breaks or preparation for stronger price moves.
ALMA parameters can be adjusted depending on the timeframe and market volatility, providing flexibility in analysis.
The indicator is useful for both short-term scalping strategies and longer-term trend monitoring and position management.
Why This Indicator is Useful
Many existing trend indicators do not consider the slope angle of the moving average as a quantitative measure of trend strength, nor do they automatically detect consolidations as separate zones. ALMA Trend-box fills this gap by combining sophisticated mathematical processing with simple and intuitive visual representation. This way, users get a tool that helps make decisions based on more objective criteria of trend and consolidation rather than just price location relative to averages.
Weighted Regression Bands (Zeiierman)█ Overview
Weighted Regression Bands is a precision-engineered trend and volatility tool designed to adapt to the real market structure instead of reacting to price noise.
This indicator analyzes Weighted High/Low medians and applies user-selectable smoothing methods — including Kalman Filtering, ALMA, and custom Linear Regression — to generate a Fair Value line. Around this, it constructs dynamic standard deviation bands that adapt in real-time to market volatility.
The result is a visually clean and structurally intelligent trend framework suitable for breakout traders, mean reversion strategies, and trend-driven analysis.
█ How It Works
⚪ Structural High/Low Analysis
At the heart of this indicator is a custom high/low weighting system. Instead of using just the raw high or low values, it calculates a midline = (high + low) / 2, then applies one of three weighting methods to determine which price zones matter most.
Users can select the method using the “Weighted HL Method” setting:
Simple
Selects the single most dominant median (highest or lowest) in the lookback window. Ideal for fast, reactive signals.
Advanced
Ranks each bar based on a composite score: median × range × recency. This method highlights structurally meaningful bars that had both volatility and recency. A built-in Kalman filter is applied for extra stability.
Smooth
Blends multiple bars into a single weighted average using smoothed decay and range. This provides the softest and most stable structural response.
⚪ Smoothing Methods (ALMA / Linear Regression)
ALMA provides responsive, low-lag smoothing for fast trend reading.
Linear Regression projects the Fair Value forward, ideal for trend modeling.
⚪ Kalman Smoothing Filter
Before trend calculations, the indicator applies an optional Kalman-style smoothing filter. This helps:
Reduce choppy false shifts in trend,
Retain signal clarity during volatile periods,
Provide stability for long-term setups.
⚪ Deviation Bands (Dynamic Volatility Envelopes)
The indicator builds ±1, ±2, and ±3 standard deviation bands around the fair value line:
Calculated from the standard deviation of price,
Bands expand and contract based on recent volatility,
Visualizes potential overbought/oversold or trending conditions.
█ How to Use
⚪ Trend Trading & Filtering
Use the Fair Value line to identify the dominant direction.
Only trade in the direction of the slope for higher probability setups.
⚪ Volatility-Based Entries
Watch for price reaching outer bands (+2σ, +3σ) for possible exhaustion.
Mean reversion entries become higher quality when far from Fair Value.
█ Settings
Length – Lookback for Weighted HL and trend smoothing
Deviation Multiplier – Controls how wide the bands are from the fair value line
Method – Choose between ALMA or Linear Regression smoothing
Smoothing – Strength of Kalman Filter (1 = none, <1 = stronger smoothing)
-----------------
Disclaimer
The content provided in my scripts, indicators, ideas, algorithms, and systems is for educational and informational purposes only. It does not constitute financial advice, investment recommendations, or a solicitation to buy or sell any financial instruments. I will not accept liability for any loss or damage, including without limitation any loss of profit, which may arise directly or indirectly from the use of or reliance on such information.
All investments involve risk, and the past performance of a security, industry, sector, market, financial product, trading strategy, backtest, or individual's trading does not guarantee future results or returns. Investors are fully responsible for any investment decisions they make. Such decisions should be based solely on an evaluation of their financial circumstances, investment objectives, risk tolerance, and liquidity needs.

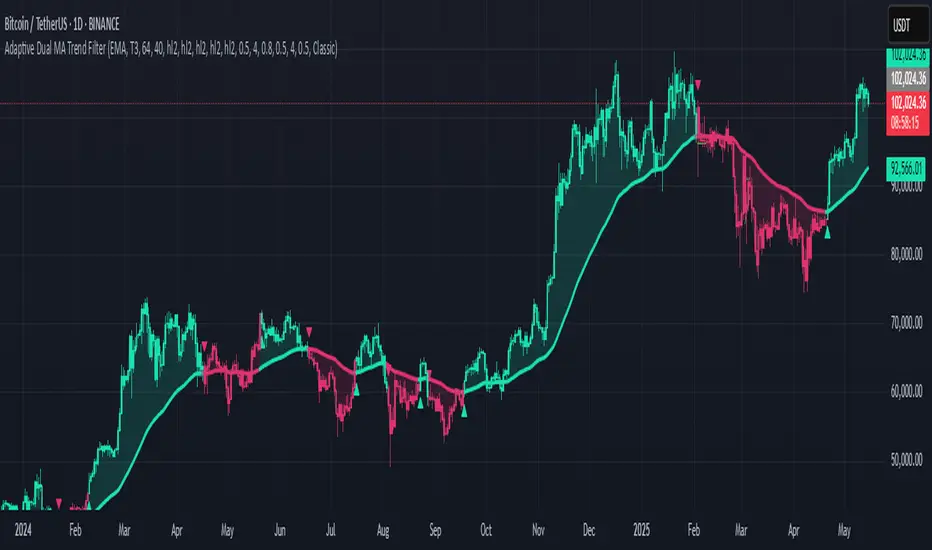
Adaptive Dual MA Trend FilterAdaptive Dual MA Trend Filter is a versatile Pine Script™ indicator that delivers clear, reliable trend signals using customizable moving averages:
Dual‑Stage Filtering – Apply any traditional MA (SMA, EMA, VWMA, HMA, RMA, TEMA, DEMA, FRAMA, TRIMA) or advanced smoothing (ALMA, T3) as your “main” and “filter” MAs. The filter MA is double‑smoothed for noise suppression, then converted into a robust “double‑filtered” baseline.
Flexible Inputs – Select lengths, sources (close, high, low, hl2), offsets, sigma, and volume factors to tailor the responsiveness and smoothness to your favorite timeframe or asset class.
Intuitive Signals – The script detects confirmed bullish (green) and bearish (red) trend shifts as:
Circle marker on the MA line
Triangle arrows below/above bars
Full candles and MA line colored by current trend
Clean Overlay – Works directly on your price chart, with optional semi‑transparent fills for extra visual clarity.
Theme Support – Choose from Vibrant, Pastel, Neon, Classic, Monochrome, Solarized, or Material palettes for seamless chart styling.
Ideal for swing traders and intraday scalpers alike, Multi‑Source Double‑Filter Trend offers both “set‑and‑forget” simplicity and deep customization for power users.
Usage
Add to chart → Inputs → tweak MA types/lengths
Watch for color changes and markers
Combine with volume or momentum filters for entry confirmation
Enjoy clearer trend identification and smoother trade signals!
Disclaimer
This script is for educational and informational purposes only. Not financial advice. Use at your own risk.
Ultimate Total MA + ATRIndicator Description (English)
Name: Tendencias FX - Multi-Line with Customizable Offsets (1x..6x)
This script is a multi-purpose trend-following indicator that calculates a central Moving Average (Mid Line) plus a set of 6 different bands (1x to 6x) above and below that average. Each band is determined by a user-defined ATR length and multiplier. Key features include:
Independent MA Types
Choose different moving average methods for the Mid Line and for the ATR calculation.
Available types: SMA, EMA, WMA, RMA, HMA, and ALMA.
Separate Lengths
Configure the length of the Mid Line independently from the ATR length.
This allows fine-tuning of both the central average and the volatility measure.
6 Customizable Multipliers
Bands are calculated for 1x, 2x, 3x, 4x, 5x, and 6x multiples of the chosen ATR.
Each level has its own checkbox in the Inputs tab so you can show or hide them at will.
Color Dynamics
The Mid Line automatically changes color to green when its current value is higher than the previous bar’s value, and red otherwise.
All upper/lower bands are rendered in a neutral gray (#787b86) for easy distinction.
Time Shift (Offset)
An offset parameter allows shifting the entire indicator (Mid Line plus bands) forward (to the right) or backward (to the left) by a certain number of bars.
This can help evaluate leads/lags, or compare the past behavior of these lines against future price developments.
Check Boxes for Visibility
Checkboxes in the Inputs let you toggle 1x..6x band levels.
By default, 1x, 2x, and 3x are visible, while 4x, 5x, and 6x are off.
Overlay with Shared Price Scale
The script is set as overlay=true and uses scale=scale.right, so it draws directly on the main chart and shares the same price axis as your candles.
This indicator is ideal if you want:
A central MA for trend detection.
ATR-based volatility bands (up to 6 multipliers).
Full control over the type and length of both the Mid Line MA and the ATR.
An optional offset to shift the lines in time for backtesting or forward-projection.
Usage Tips
In the Inputs tab, customize:
Mid Line length and ATR length independently.
MA methods for both Mid Line and ATR (SMA, EMA, WMA, RMA, HMA, ALMA).
Band visibility via checkboxes for 1x..6x.
Offset for shifting lines in time.
In the Style tab, you can further customize colors, line widths, and visibility of each element (Mid line, ±1x..±6x).
Enjoy exploring different settings to best match your preferred trading style and timeframe!

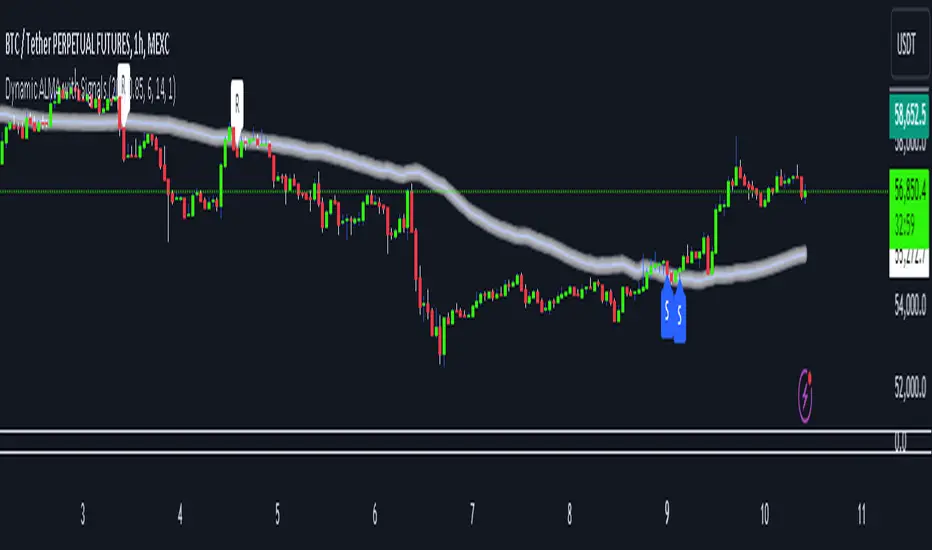
Dynamic ALMA with signalsEnhanced ALMA with Signals
This TradingView indicator is designed to enhance your trading strategy by utilizing the Arnaud Legoux Moving Average (ALMA), a unique moving average that provides smoother price action while minimizing lag. The script not only plots the ALMA line but also dynamically adjusts its parameters based on market volatility to adapt to different trading conditions. Additionally, it highlights potential bounce points off the line, as well as breakout points, giving traders clear signals for potential support, resistance levels, and breakouts.
Key Features:
Dynamic ALMA Line with Glow Effect:
The core of this indicator is the ALMA line, which is dynamically adjusted to market volatility, providing more accurate signals in varying conditions. The line adapts to both trending and consolidating markets by adjusting its sensitivity in real time. A glow effect is created by plotting the ALMA line multiple times with increasing transparency, making it visually distinct.
Bounce Detection Signals with Volatility Filter:
The script detects and labels potential support and resistance bounces based on the crossover and crossunder of the price with the ALMA line, further filtered by a volatility condition. This helps in filtering out false signals during low-volatility conditions, making the signals more reliable.
Visual Enhancements:
Custom glow effects and labels for bounce detection enhance chart readability and help traders quickly identify key levels.
Inputs:
Base Window Size: Sets the number of bars used in calculating the ALMA, allowing traders to adjust the sensitivity of the moving average. This parameter is dynamically adjusted based on current market volatility.
Offset: Determines the position of the ALMA curve. Higher values move the curve further away from the price. This value remains constant for stability.
Sigma: Controls the smoothness of the ALMA curve; a higher sigma results in a smoother curve. This value also remains constant.
ATR Period and Threshold Multiplier: Used to calculate the Average True Range (ATR) for the volatility filter, which determines whether the market conditions are sufficiently volatile to consider bounce signals.
How It Works:
Dynamic ALMA Calculation:
The script calculates the ALMA (Arnaud Legoux Moving Average) using the ta.alma function, dynamically adjusting the window size based on market volatility measured by the ATR (Average True Range). This ensures that the ALMA line remains responsive in high-volatility environments and smooth in low-volatility conditions.
Glow Effect:
To create a glow effect around the ALMA line, the script plots the ALMA multiple times with varying degrees of transparency. This visual enhancement helps the ALMA line stand out on the chart.
Bounce Detection with Volatility Filter:
The script uses two conditions to detect potential bounces:
Support Bounce: Detected when the low of the bar crosses above the ALMA line (ta.crossover(low, alma)) and the close is above the ALMA, while the volatility filter confirms sufficient market activity. This suggests potential support at the ALMA line.
Resistance Bounce: Detected when the high of the bar crosses below the ALMA line (ta.crossunder(high, alma)) and the close is below the ALMA, while the volatility filter confirms sufficient market activity. This indicates potential resistance at the ALMA line.
Labeling Bounce Points:
When a bounce is detected, the script labels it on the chart:
Support Bounces (S): Labeled with a blue "S" below the bar where a support bounce is detected.
Resistance Bounces (R): Labeled with a white "R" above the bar where a resistance bounce is detected.
Usage:
This enhanced indicator helps traders visualize key support and resistance levels more effectively by dynamically adjusting the ALMA moving average to market conditions. By detecting and labeling potential bounce points and filtering these signals based on volatility, traders can better identify entry and exit points in their trading strategy. The dynamic adjustments and visual enhancements make it easier to spot critical levels quickly and adapt to changing market conditions.
Customize the inputs to fit your trading style, and use this enhanced ALMA indicator to gain a more refined understanding of market trends, potential reversals, and breakouts.
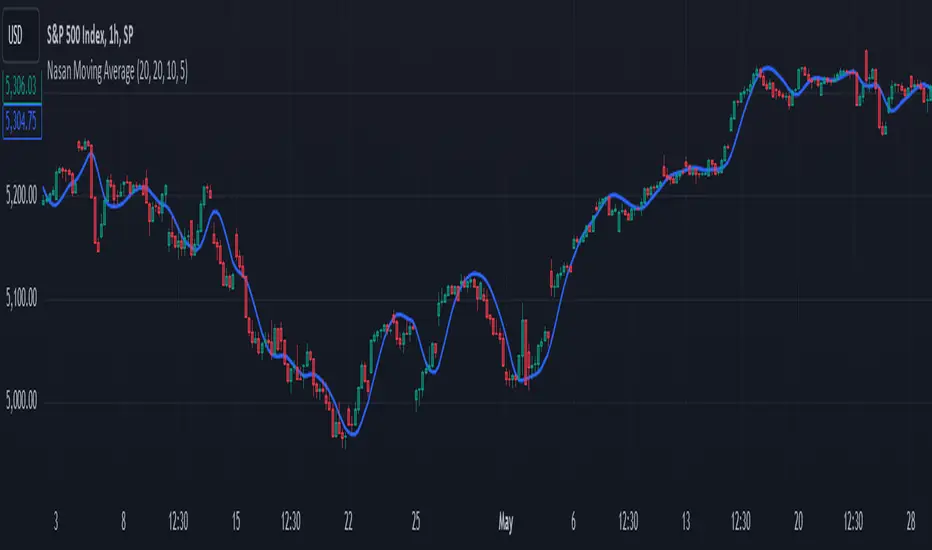
Nasan Moving AverageNasan Moving Average belong to the group of moving average which provides a high degree of smoothness with very low lag.
The calculation process involves several steps to analyze the typical price of a financial asset over specific periods. It starts by computing a simple moving average and standard deviation of the typical price. Then, it standardizes (differencing TP - Average Typical price over previous n periods) the price and applies an inverse hyperbolic sine transformation to the standardized value. The transformed values are summed cumulatively, and various weighted moving averages are calculated to adjust and smooth the data. The final output is a smoothed signal with reduced lag.
Input Parameters:
len: Differencing length (default 21, Use a minimum of 5 and for lower time frames less than 15 min use values between 300 -3000)
len1: Correction Factor Length 1 (default 21, this determines the length of the MA you want , eg. 10 MA, 50 MA, 100 MA, )
len2: Correction Factor Length 2 (default 9, this works best if it is ~ </=1/2 of len1 )
len3: Smoothing Length (default 5, I would not change this and only use if I want to introduce lag where you want to use it for cross over strategies).
Differencing and Standardization:
The code calculates the standardized price a by differencing the typical price and normalizing it using the mean and standard deviation. This step standardizes the price changes.
Transformation:
The transformation using logarithms and square roots (b) aim to stabilize the variance and make the distribution more normal-like, improving the robustness of the cumulative sum c.
Cumulative Sum:
The cumulative sum c of the transformed series helps in integrating the series over time, capturing the overall trend and movement.
Correction Factors:
Correction factors c1 and c4 adjust the cumulative sum based on weighted averages, to correct any biases or to align it with the typical price.
Smoothing:
The final result c6 is smoothed using a weighted moving average, reducing noise and making it easier to interpret trends.
MTF Bullish & Bearish Crosses of Moving Averages with AlertsIn the Table from the right center are displayed moving averages values from 4 different timeframes choosed by the user input and the moving averages crosses bullish or bearish, default timeframes values are 15 min, 60 min, 4h and Daily, users can change the values from 1 second to the values they want.
The indicator display current timeframes moving averages, default lengths are 50 ema and 200 ema and Golden and Death crosses, this can be hidden from style if the users do not want to display them.
The script comes with 7 types of moving averages that can users can chose: ALMA, DEMA, EMA, HMA, SMA, VWMA and WMA and also users are able to change the legth of the moving averages from dashboard to fit their trading style.
Users are able to set alerts for the moving averages crosses for all 4 custom timeframes, 8 alerts, one for bullish and one for bearish crosses at each timeframe.

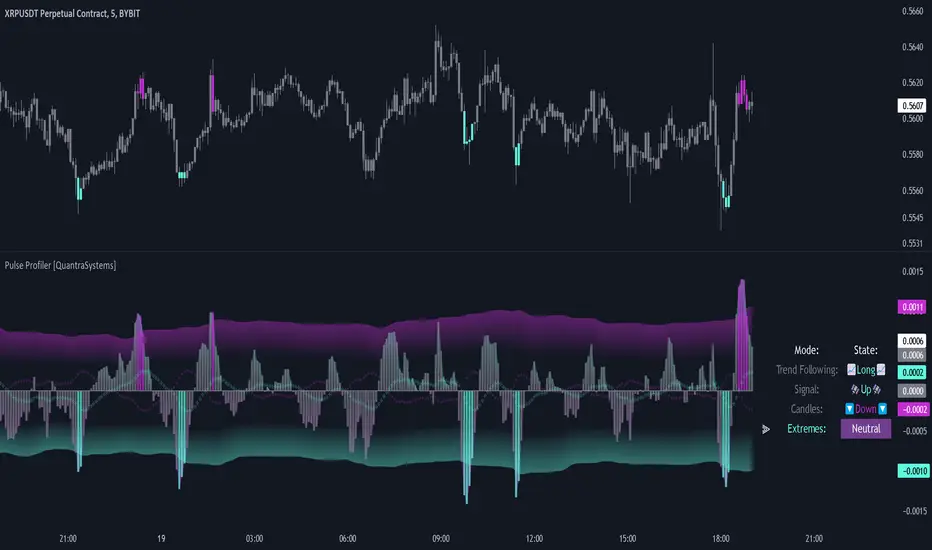
Pulse Profiler [QuantraSystems]Pulse Profiler
Introduction
The Pulse Profiler ( ℙℙ ) is specifically designed to unambiguously indicate weakening momentum after a strong impulse. The upper and lower standard deviation bands also allow the user to assess the strength of an impulse and differentiate it from general noise.
Due to the ℙℙ ’s rapid responsiveness to exhaustion in price movement it is ideally used for the trader to recognize when to start taking profit when combined with other indicators.
The novum is that by dynamically balancing its sensitivity to recent movements the ℙℙ considers the asset’s inherent volatility. By reducing noise without sacrificing signal, and by visualizing it in our typical modern QuantraAI style, the ℙℙ enhances the traders’ ability to distinguish impulses with weakening momentum from strong trending movements.
Legend
Impulse: The ℙℙ showing strength based on momentum and volume.
Dynamic standard deviation bands: Rolling probability based bands based on a rolling normal distribution. Adjustable, recommended are σ = 1.5 to σ = 2.5.
Neutral lines: Dynamic thresholds which get often respected as support or resistance.
Case Study
To properly employ the ℙℙ , the trader should use it to identify out-of-the-ordinary 𝓲𝓶𝓹𝓾𝓵𝓼𝓮𝓼 which cause a following exhaustion.
The rolling standard deviation bands incorporate the asset’s historical behavior in regards to its inherent volatility on a rolling basis. If the asset shows strong 𝓲𝓶𝓹𝓾𝓵𝓼𝓮𝓼 that go beyond the rolling standard deviation, the event has been highly improbable. The trader then needs to determine if the price change was caused by critical external factors. If not, it is highly probable that the momentum exhausts and that price movement plateaus to enter a range.
These signals indicate that it is highly probable that closing a position upon these conditions is the correct choice.
If the 𝓲𝓶𝓹𝓾𝓵𝓼𝓮 reverses and retraces into the opposite direction, while moving more than 1.5σ across just 3 bars on the 4H chart, the signal indicates that a reversal is pushing the price down – in both momentum and volume.
A sharp reversal thus becomes more probable than not.
The ℙℙ can also be calibrated to find possible trend exhaustions on a longer timeframe (1D).
Please always use multiple Quantra indicators to add confirmations to your signals.
Recommended Settings
Swing Trading (4H chart)
Standard Deviation Lookback: 150
Standard Deviation Multiplier (σ): 2.5
Display Variant: Classic
Choose Mode for Bar Coloring: Signal
Trend exhaustion (1D chart)
Standard Deviation Lookback: 200
Standard Deviation Multiplier (σ): 2.0
Display Variant: Classic
Choose Mode for Bar Coloring: Extremes
Notes
Quantra Standard Value Contents:
The Heikin-Ashi (HA) candle visualization smoothes out the signal line to provide more informative insights into momentum and trends. This allows earlier entries and exits by observing the indicator values transformed by the HA.
Various visualization options are available to adjust the indicator to the user’s preference: Aside from HA, a classic line, or a hybrid of both.
A special feature of Quantra’s indicators is that they are probabilistically built - therefore they work well as confluence and can easily be stacked to increase signal accuracy.
To add to Quantra's indicators’ utility we have added the option to change the price bars colors based on different signals:
Choose Mode for Coloring
Trend Following (Indicator above mid line counts as uptrend, below is downtrend)
Extremes (Everything beyond the SD bands is highlighted to signal mean reversion)
Candles (Color of HA candles as barcolor)
Reversions (Only for HA) (Reversion Signals via the triangles if HA candles change trend while beyond the SD bands, high probability entries/exits)
The ℙℙ is also sensitive to divergences for those interested in utilizing this feature.
Through a special combination of price, volume and momentum you get a holistic overview on the impulse strengths of movements.
The two neutral lines in the center act as dynamic, volume and volatility adjusted thresholds. Often the signal line respects them as support and resistance.
The upper and lower standard deviation lines express the rarity of an impulse based on the asset’s inherent volatility.
The indicator needs a long enough timespan to build up its probability estimation, therefore the asset needs sufficient price history.
The indicator requires thorough volume data. If the source of an asset pair does not forward it, try to find another source or exchange for the same pair.
Signal Mode on the 4H chart is a relevant part of this indicator when used in isolation and helps to analyze momentum adjusted by volatility.
Methodology
The ℙℙ combines the Arnaud Legoux Moving Average (ALMA) with a bespoke volume and momentum calculation, with a classical Exponential Moving Average (EMA) on price data.
The ℙℙ itself integrates ALMA for volume and momentum with an EMA calculation on price, creating a unique blend that expresses impulses using their three raw main components.
The indicator calculates dynamic standard deviation bands based on an adjustable lookback period and the adjustable sigma (σ), to signal when the impulse strength is just uncommon or even extraordinary when compared to the usual price movements:
σ = 1.5 the probability of similar impulse strength occuring is 13.37% / 2, hence ~ 6.69%
σ = 2.0 the probability of similar impulse strength occuring is ~ 2.28%
σ = 2.5 the probability of similar impulse strength occuring is ~ 0.62%
By detecting extremely improbable conditions the indicator can create an inversely highly probable signal to its user.
Neutral bands are calculated based on the ℙℙ alongside a rolling, dynamic multiplier. This effectively provides dynamic thresholds for approximating common volatility.
Heikin Ashi method: The indicator uses a custom function to calculate Heikin Ashi values, useful for smoothing impulse data and identifying trends.
Reversion Signals: Specifically for Heikin Ashi displays, we plot triangles as signals, useful to easily spot potential reversals.
The Signal Mode uses these different thresholds to highlight significant market moves.
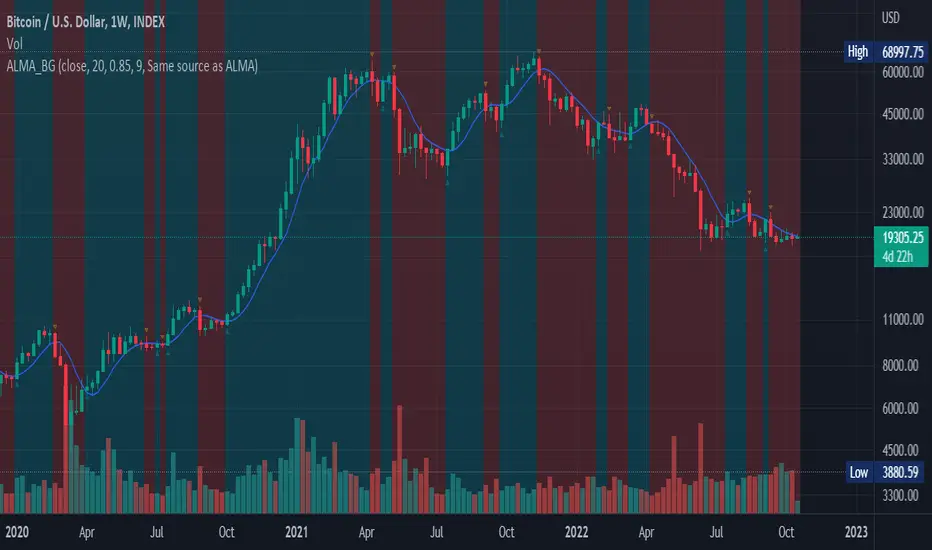
ALMA Smoothed Gaussian Moving AverageThis indicator is an altered version of the Gaussian Moving Average (GMA) (Credit to author: © LeafAlgo ). The GMA applies weights to the prices, giving more importance to the values closer to the current period and gradually diminishing the significance of older prices. The ALMA Smoothed Gaussian Moving Average (ASGMA) applies an ALMA smoothing to its price data to minimize lag and provide a more accurate representation of the underlying trend by dynamically adapting to changing market conditions. The Arnaud Legoux Moving Average (ALMA) is a specialized smoothing technique that adjusts the weights of the moving average based on market volatility. Its calculation uses Wavelet Transform techniques which enables this type of smoothing to capture both high-frequency and low-frequency components of a signal or data. The rationale for this mashup between ALMA and Gaussian filtering is to smooth the moving average line over the smoothed price data and produce stronger trend signals.
ASGMA serves as a trend-following indicator, identifying both bullish and bearish trends. It provides buy and sell signals indicated by "B" and "S" labels plotted alongside the price data. Additionally, the ASGMA's Exponential Moving Average (EMA) line alternates between green and red, indicating bullish and bearish momentum, respectively.
The ASGMA also incorporates two popular momentum indicators, the Relative Strength Index (RSI) and the Chande Momentum Oscillator (CMO). The inclusion of these indicators aims to enhance trend identification and reversal signals. For a strong buy signal, all three indicators (RSI, CMO, and ASGMA) must indicate bullish conditions, resulting in a vertical green line. Conversely, a vertical red line is plotted when all indicators indicate bearish conditions, representing a strong sell signal.
The ASGMA, with its unique combination of smoothing techniques and indicator amalgamation, provides traders and investors with powerful analytical tools. It can be applied in trend-following strategies using the regular buy and sell signals generated by labels and the EMA line. Alternatively, the vertical lines offer stronger buy and sell signals. These features aid in identifying potential entry and exit points, thereby enhancing trading decisions and market analysis. However, it is important to remember that the future performance of any trading strategy is fundamentally unknowable, and past results do not guarantee future performance.

PA Double Diamond [NawidD.]This indicator will use ALMA cross as strategy to display Buy and Sell signals. You can filter the signals with several options, like a Moving Average (MA), True Strength Index (TSI), Range Filter, and/or filter by session. You can set alerts with pre-defined Take Profit (TP) and Stoploss (SL). Please read below for more detailed information.
Plots on the chart
- ALMA Fast and ALMA Slow.
- ALMA Cross Dots on top.
- Buy/Sell signals. Show as a Diamond or as regular.
- Moving Average (MA). Available options: SMA/EMA/ZLEMA/DEMA/TEMA.
- Sessions Filter (London/New York/Tokyo/Sydney)
- Take Profit and Stoploss.
- Show Stoploss hit.
ALMA
Default is ALMA Fast set to 13 and ALMA Slow set to 50. These can be changed by input.
ALMA Cross Dots on top
This will display dots on top of the chart. It shows ALMA Fast and ALMA Slow crosses only, without MA, TSI, Range Filter, and Session filter.
- Blue dot: ALMA crossover, up direction.
- Orange dot: ALMA crossunder, down direction.
Moving Average (MA) for overall trend direction
It is possible to enable the overal trend direction using the MA.
When enabled, Buy signals will be shown when signal is above the MA, and Sell signals will be shown when signal is below the MA. The following options are available:
- SMA = Simple Moving Average
- EMA = Exponential Moving Average
- ZLEMA = Zero Lag Exponential Moving Average
- DEMA = Double Exponential Moving Average
- TEMA = Triangular Moving Average
True Strength Index (TSI)
The signals can be filtered using the True Strength Index (TSI). Please note, this indicator will use the TSI, but won't display it for visualization. Default options: Long Length 25, Short Long 13, Signal Length 13. This can be changed by input.
Range Filter
The signals can be filtered using the Range Filter. Change the input in the settings. You can also display the Range Filter from the Styles tab.
Sessions Filter
Filter signals by session. You can also select the UTC timezone, and use daylight savings time (this will add 1 hour for daylight savings time). Available options to use as session filter: London/New York/Tokyo/Sydney. You can also display the sessions without using them as filter.
Take Profit (TP) and Stoploss (SL)
The TP and SL can be set. Use the value in ticks. So 30 pips equals 300 ticks. You can enable/disable the TP and SL from settings.
Alert Option
Alerts can be set to message you with the pre-defined TP and SL when a Buy Signal or Sell Signal occurs. I recommend to use alerts with trigger "Once per bar close". When linked to your broker/metatrader it is possible to set the indicator as autotrading since it will message you:
- Entry price
- TP price
- SL price

AIR Supertrend (Average Interpercentile Range)Supertrend (ST) is a popular stop loss and trend identification script. The simplicity of seeing a clean trend on a chart makes it attractive, yet it is restricted by only allowing the source, length and multiplier to be adjusted, & these tend to have a limited effect on the properties of the identified trend.
There is a wide variety of interesting ST scripts on TradingView that give the user more control, but none to my knowledge, based on measuring the statistical dispersion of Average Interpercentile Range (AIR).
Two more levels of control:
Normally, ATR Average True Range is used to calculate the range in ST. ATR is initially calculated using RMA to smooth out True Range. This script gives the user the option of changing the MA to some more interesting varieties & modifying their parameters.
The default range setting when you load the indicator on a chart will be AIR.
The real strength of the indicator, however, and the reason I am publishing it, is to release AIR. Play round with the percentile range setting. Lowering it will allow you to stay longer in a trade in a volatile market. Raising it will make it tighter.
For comparison, you can switch back the range setting to ATR and load up RMA to see how the original, classic ST plots.
Alerts are included in this version. Alway use a stop loss.
DISCLAIMER: None of this is financial advice.
Credits to these authors, whose hard work inspired parts of this script:
@ KivancOzbilgic - SuperTrend
@ KioseffTrading - Tillson T3 MA
@ cheatcountry - Hann Window Smoothing
@ mutantdog - Interquartile Range function in his 'Blaze' script

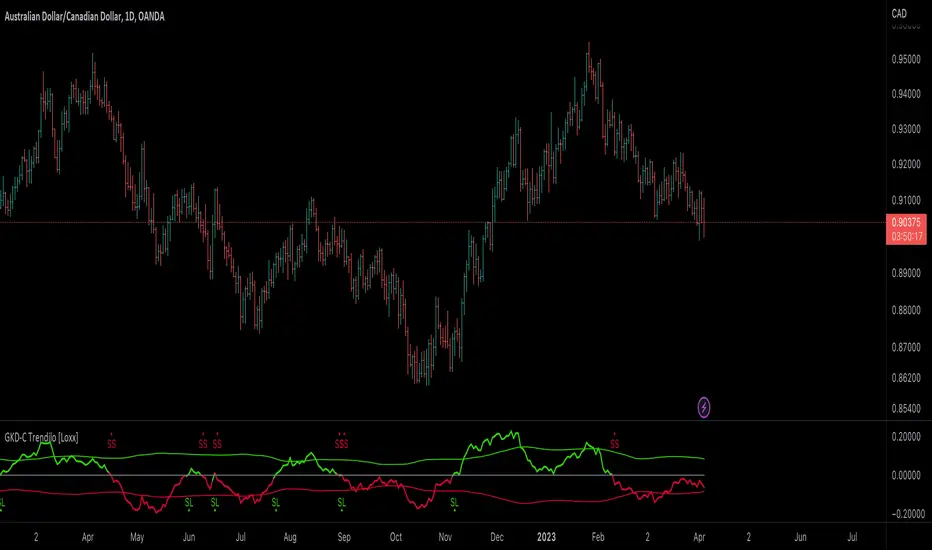
GKD-C Trendilo [Loxx]Giga Kaleidoscope GKD-C Trendilo is a Confirmation module included in Loxx's "Giga Kaleidoscope Modularized Trading System".
█ Giga Kaleidoscope Modularized Trading System
What is Loxx's "Giga Kaleidoscope Modularized Trading System"?
The Giga Kaleidoscope Modularized Trading System is a trading system built on the philosophy of the NNFX (No Nonsense Forex) algorithmic trading.
What is the NNFX algorithmic trading strategy?
The NNFX (No-Nonsense Forex) trading system is a comprehensive approach to Forex trading that is designed to simplify the process and remove the confusion and complexity that often surrounds trading. The system was developed by a Forex trader who goes by the pseudonym "VP" and has gained a significant following in the Forex community.
The NNFX trading system is based on a set of rules and guidelines that help traders make objective and informed decisions. These rules cover all aspects of trading, including market analysis, trade entry, stop loss placement, and trade management.
Here are the main components of the NNFX trading system:
1. Trading Philosophy: The NNFX trading system is based on the idea that successful trading requires a comprehensive understanding of the market, objective analysis, and strict risk management. The system aims to remove subjective elements from trading and focuses on objective rules and guidelines.
2. Technical Analysis: The NNFX trading system relies heavily on technical analysis and uses a range of indicators to identify high-probability trading opportunities. The system uses a combination of trend-following and mean-reverting strategies to identify trades.
3. Market Structure: The NNFX trading system emphasizes the importance of understanding the market structure, including price action, support and resistance levels, and market cycles. The system uses a range of tools to identify the market structure, including trend lines, channels, and moving averages.
4. Trade Entry: The NNFX trading system has strict rules for trade entry. The system uses a combination of technical indicators to identify high-probability trades, and traders must meet specific criteria to enter a trade.
5. Stop Loss Placement: The NNFX trading system places a significant emphasis on risk management and requires traders to place a stop loss order on every trade. The system uses a combination of technical analysis and market structure to determine the appropriate stop loss level.
6. Trade Management: The NNFX trading system has specific rules for managing open trades. The system aims to minimize risk and maximize profit by using a combination of trailing stops, take profit levels, and position sizing.
Overall, the NNFX trading system is designed to be a straightforward and easy-to-follow approach to Forex trading that can be applied by traders of all skill levels.
Core components of an NNFX algorithmic trading strategy
The NNFX algorithm is built on the principles of trend, momentum, and volatility. There are six core components in the NNFX trading algorithm:
1. Volatility - price volatility; e.g., Average True Range, True Range Double, Close-to-Close, etc.
2. Baseline - a moving average to identify price trend
3. Confirmation 1 - a technical indicator used to identify trends
4. Confirmation 2 - a technical indicator used to identify trends
5. Continuation - a technical indicator used to identify trends
6. Volatility/Volume - a technical indicator used to identify volatility/volume breakouts/breakdown
7. Exit - a technical indicator used to determine when a trend is exhausted
What is Volatility in the NNFX trading system?
In the NNFX (No Nonsense Forex) trading system, ATR (Average True Range) is typically used to measure the volatility of an asset. It is used as a part of the system to help determine the appropriate stop loss and take profit levels for a trade. ATR is calculated by taking the average of the true range values over a specified period.
True range is calculated as the maximum of the following values:
-Current high minus the current low
-Absolute value of the current high minus the previous close
-Absolute value of the current low minus the previous close
ATR is a dynamic indicator that changes with changes in volatility. As volatility increases, the value of ATR increases, and as volatility decreases, the value of ATR decreases. By using ATR in NNFX system, traders can adjust their stop loss and take profit levels according to the volatility of the asset being traded. This helps to ensure that the trade is given enough room to move, while also minimizing potential losses.
Other types of volatility include True Range Double (TRD), Close-to-Close, and Garman-Klass
What is a Baseline indicator?
The baseline is essentially a moving average, and is used to determine the overall direction of the market.
The baseline in the NNFX system is used to filter out trades that are not in line with the long-term trend of the market. The baseline is plotted on the chart along with other indicators, such as the Moving Average (MA), the Relative Strength Index (RSI), and the Average True Range (ATR).
Trades are only taken when the price is in the same direction as the baseline. For example, if the baseline is sloping upwards, only long trades are taken, and if the baseline is sloping downwards, only short trades are taken. This approach helps to ensure that trades are in line with the overall trend of the market, and reduces the risk of entering trades that are likely to fail.
By using a baseline in the NNFX system, traders can have a clear reference point for determining the overall trend of the market, and can make more informed trading decisions. The baseline helps to filter out noise and false signals, and ensures that trades are taken in the direction of the long-term trend.
What is a Confirmation indicator?
Confirmation indicators are technical indicators that are used to confirm the signals generated by primary indicators. Primary indicators are the core indicators used in the NNFX system, such as the Average True Range (ATR), the Moving Average (MA), and the Relative Strength Index (RSI).
The purpose of the confirmation indicators is to reduce false signals and improve the accuracy of the trading system. They are designed to confirm the signals generated by the primary indicators by providing additional information about the strength and direction of the trend.
Some examples of confirmation indicators that may be used in the NNFX system include the Bollinger Bands, the MACD (Moving Average Convergence Divergence), and the MACD Oscillator. These indicators can provide information about the volatility, momentum, and trend strength of the market, and can be used to confirm the signals generated by the primary indicators.
In the NNFX system, confirmation indicators are used in combination with primary indicators and other filters to create a trading system that is robust and reliable. By using multiple indicators to confirm trading signals, the system aims to reduce the risk of false signals and improve the overall profitability of the trades.
What is a Continuation indicator?
In the NNFX (No Nonsense Forex) trading system, a continuation indicator is a technical indicator that is used to confirm a current trend and predict that the trend is likely to continue in the same direction. A continuation indicator is typically used in conjunction with other indicators in the system, such as a baseline indicator, to provide a comprehensive trading strategy.
What is a Volatility/Volume indicator?
Volume indicators, such as the On Balance Volume (OBV), the Chaikin Money Flow (CMF), or the Volume Price Trend (VPT), are used to measure the amount of buying and selling activity in a market. They are based on the trading volume of the market, and can provide information about the strength of the trend. In the NNFX system, volume indicators are used to confirm trading signals generated by the Moving Average and the Relative Strength Index. Volatility indicators include Average Direction Index, Waddah Attar, and Volatility Ratio. In the NNFX trading system, volatility is a proxy for volume and vice versa.
By using volume indicators as confirmation tools, the NNFX trading system aims to reduce the risk of false signals and improve the overall profitability of trades. These indicators can provide additional information about the market that is not captured by the primary indicators, and can help traders to make more informed trading decisions. In addition, volume indicators can be used to identify potential changes in market trends and to confirm the strength of price movements.
What is an Exit indicator?
The exit indicator is used in conjunction with other indicators in the system, such as the Moving Average (MA), the Relative Strength Index (RSI), and the Average True Range (ATR), to provide a comprehensive trading strategy.
The exit indicator in the NNFX system can be any technical indicator that is deemed effective at identifying optimal exit points. Examples of exit indicators that are commonly used include the Parabolic SAR, the Average Directional Index (ADX), and the Chandelier Exit.
The purpose of the exit indicator is to identify when a trend is likely to reverse or when the market conditions have changed, signaling the need to exit a trade. By using an exit indicator, traders can manage their risk and prevent significant losses.
In the NNFX system, the exit indicator is used in conjunction with a stop loss and a take profit order to maximize profits and minimize losses. The stop loss order is used to limit the amount of loss that can be incurred if the trade goes against the trader, while the take profit order is used to lock in profits when the trade is moving in the trader's favor.
Overall, the use of an exit indicator in the NNFX trading system is an important component of a comprehensive trading strategy. It allows traders to manage their risk effectively and improve the profitability of their trades by exiting at the right time.
How does Loxx's GKD (Giga Kaleidoscope Modularized Trading System) implement the NNFX algorithm outlined above?
Loxx's GKD v1.0 system has five types of modules (indicators/strategies). These modules are:
1. GKD-BT - Backtesting module (Volatility, Number 1 in the NNFX algorithm)
2. GKD-B - Baseline module (Baseline and Volatility/Volume, Numbers 1 and 2 in the NNFX algorithm)
3. GKD-C - Confirmation 1/2 and Continuation module (Confirmation 1/2 and Continuation, Numbers 3, 4, and 5 in the NNFX algorithm)
4. GKD-V - Volatility/Volume module (Confirmation 1/2, Number 6 in the NNFX algorithm)
5. GKD-E - Exit module (Exit, Number 7 in the NNFX algorithm)
(additional module types will added in future releases)
Each module interacts with every module by passing data between modules. Data is passed between each module as described below:
GKD-B => GKD-V => GKD-C(1) => GKD-C(2) => GKD-C(Continuation) => GKD-E => GKD-BT
That is, the Baseline indicator passes its data to Volatility/Volume. The Volatility/Volume indicator passes its values to the Confirmation 1 indicator. The Confirmation 1 indicator passes its values to the Confirmation 2 indicator. The Confirmation 2 indicator passes its values to the Continuation indicator. The Continuation indicator passes its values to the Exit indicator, and finally, the Exit indicator passes its values to the Backtest strategy.
This chaining of indicators requires that each module conform to Loxx's GKD protocol, therefore allowing for the testing of every possible combination of technical indicators that make up the six components of the NNFX algorithm.
What does the application of the GKD trading system look like?
Example trading system:
Backtest: Strategy with 1-3 take profits, trailing stop loss, multiple types of PnL volatility, and 2 backtesting styles
Baseline: Hull Moving Average
Volatility/Volume: Hurst Exponent
Confirmation 1: Trendilo as shown on the chart above
Confirmation 2: Williams Percent Range
Continuation: Fisher Transform
Exit: Rex Oscillator
Each GKD indicator is denoted with a module identifier of either: GKD-BT, GKD-B, GKD-C, GKD-V, or GKD-E. This allows traders to understand to which module each indicator belongs and where each indicator fits into the GKD protocol chain.
Giga Kaleidoscope Modularized Trading System Signals (based on the NNFX algorithm)
Standard Entry
1. GKD-C Confirmation 1 Signal
2. GKD-B Baseline agrees
3. Price is within a range of 0.2x Volatility and 1.0x Volatility of the Goldie Locks Mean
4. GKD-C Confirmation 2 agrees
5. GKD-V Volatility/Volume agrees
Baseline Entry
1. GKD-B Baseline signal
2. GKD-C Confirmation 1 agrees
3. Price is within a range of 0.2x Volatility and 1.0x Volatility of the Goldie Locks Mean
4. GKD-C Confirmation 2 agrees
5. GKD-V Volatility/Volume agrees
6. GKD-C Confirmation 1 signal was less than 7 candles prior
Continuation Entry
1. Standard Entry, Baseline Entry, or Pullback; entry triggered previously
2. GKD-B Baseline hasn't crossed since entry signal trigger
3. GKD-C Confirmation Continuation Indicator signals
4. GKD-C Confirmation 1 agrees
5. GKD-B Baseline agrees
6. GKD-C Confirmation 2 agrees
1-Candle Rule Standard Entry
1. GKD-C Confirmation 1 signal
2. GKD-B Baseline agrees
3. Price is within a range of 0.2x Volatility and 1.0x Volatility of the Goldie Locks Mean
Next Candle:
1. Price retraced (Long: close < close or Short: close > close )
2. GKD-B Baseline agrees
3. GKD-C Confirmation 1 agrees
4. GKD-C Confirmation 2 agrees
5. GKD-V Volatility/Volume agrees
1-Candle Rule Baseline Entry
1. GKD-B Baseline signal
2. GKD-C Confirmation 1 agrees
3. Price is within a range of 0.2x Volatility and 1.0x Volatility of the Goldie Locks Mean
4. GKD-C Confirmation 1 signal was less than 7 candles prior
Next Candle:
1. Price retraced (Long: close < close or Short: close > close )
2. GKD-B Baseline agrees
3. GKD-C Confirmation 1 agrees
4. GKD-C Confirmation 2 agrees
5. GKD-V Volatility/Volume Agrees
PullBack Entry
1. GKD-B Baseline signal
2. GKD-C Confirmation 1 agrees
3. Price is beyond 1.0x Volatility of Baseline
Next Candle:
1. Price is within a range of 0.2x Volatility and 1.0x Volatility of the Goldie Locks Mean
3. GKD-C Confirmation 1 agrees
4. GKD-C Confirmation 2 agrees
5. GKD-V Volatility/Volume Agrees
█ GKD-C Trendilo
What is the ALMA?
The Arnaud Legoux Moving Average (ALMA) is a moving average variant created by Arnaud Legoux in 2009 with the goal of decreasing the lag commonly encountered with moving averages. It is designed to use a Gaussian distribution that is shifted with a calculated offset in order for the average to be biased towards more recent days, instead of being more evenly centered on the window. The ALMA indicator aims to detect trends and trend reversals and can be used similarly to other moving averages
What is the Double Smoothed Stochastic Oscillator (DSS)
Trendilo calculates the percentage change of the source data and applies an Arnaud Legoux Moving Average (ALMA) to it. The result is plotted along with positive and negative root mean square (RMS) valuesth reliable signals that confirm the strength of a trend or indicate a possible trend reversal.
Requirements
Inputs
Confirmation 1 and Solo Confirmation: GKD-V Volatility / Volume indicator
Confirmation 2: GKD-C Confirmation indicator
Outputs
Confirmation 2 and Solo Confirmation Complex: GKD-E Exit indicator
Confirmation 1: GKD-C Confirmation indicator
Continuation: GKD-E Exit indicator
Solo Confirmation Simple: GKD-BT Backtest strategy
Additional features will be added in future releases.
Munich GuppyWELCOME to the Munich Guppy!
This is a simple moving average indicator that will help you determine the trend of your chart using historical moving averages.
The indicator consists of 3 EMA's and one ALMA moving average. Using these 4 moving averages I have programmed the relationship between the moving averages to color the background of your chart.
If your background is red, this means that the alma moving average has fallen below the EMA's (EMA1 and EMA 2) as well as (EMA 1 and EMA 2) are postured in a down trending/up trending fashion
For example, the 21EMA is greater than the 55EMA, this signals that the chart has been outperforming its intermediate averages. Now if the ALMA is below both the 21ema and 55ema, in this instance, your chart background will become green.
The ALMA has color options '+CoC' and '-Coc', this simply means if the candle closes below the alma, it will turn red, if closure above it will turn green.
EMA 3 which is default set to 200, has no affect on the color of the background.
Now I hope I have thoroughly explained the simplicity of this indicator, if you have any questions leave them below or private message me for any other requests,
Good Trading!
-CheatCode1

Arnaud Legoux Moving Average (ALMA) with buy/sell signalsDescription: ALMA with background highlighting, source selection and entry/sell signals depending on price positioning relatively to the ALMA. There are two options: use price at close, or both open and close. When Open & Close is used, both open and close need to be above or below ALMA to highlight, the signal is less noisy but can be more laggy.
This is a small simple indicator that can be used for a simple trading strategy, but some users found it very helpful, so I am posting it here. Enjoy!
Adaptive Rebound Line (ARL)The Adaptive Rebound Line (ARL) focuses on the rebound of price action according to the trend.
While it does not focus on showing the trend, it does help in anticipating price rebounds.
It achieves this by adapting quickly and by reducing lag.
It is recommended to use this with a trend-identifying indicator.
It was inspired by the Hull Moving Average and the KAMA.
Additional indicator show in the chart is Tide Finder Plus .

Munich's Momentum Wave V2MUNICH'S MOMENTUM WAVE VERSION 2 IS LIVE!!!
There are a few big things to note with this one.
I decided to upload this as an entirely new script due to the number of changes differing from the first version, but as the last one, this will still work on ANY TIMEFRAME, ANY ASSET CLASS, ANY PRICE! .
This momentum wave indicator now will give you data for when trend could turn, and two momentum indicators to help you decide when to take an entry.
First off,
*I have added an alma ma (alma) that will track momentum alongside price action and further lead the indicator consisting of the Munich waves.
* The background feature will track the price using a method derived from the Bollinger bands, after calculations, it will color the background based on the average of the momentum's ema's, the alma ma, and also the alma in comparison to the alma's value pre offset ( the offset is 3, following the basis).
*There are now 5 basis values given from the increase in ema samples.
If anyone has any questions feel free to pm me or comment below. Thank you guys for the support! :)
INDEX:BTCUSD TVC:NDQ AMEX:SPY BITSTAMP:ETHUSD BINANCE:BTCUSDT FX:USDJPY NASDAQ:AAPL

EMA 21 + MacD + RSI + Alma
Setting
EMA 21 = Green
EMA 9 = yellow
MacD = 5 35 5
RSI = 10
Alma 20 0.8 8
RULES
Long:
1. EMA 9 below 21
2. RSI above 50 from Oversold
3. Macd Solid green
4. SL @ ALMA
5. Conditional buy limit order @ top wick
6. 1:3 RR
Short:
1. EMA 9 above 21
2. RSI below 50 from Overbought
3. Macd Solid red
4. SL @ ALMA
5. Conditional sell limit order @ bottom wick
6. 1:3 RR
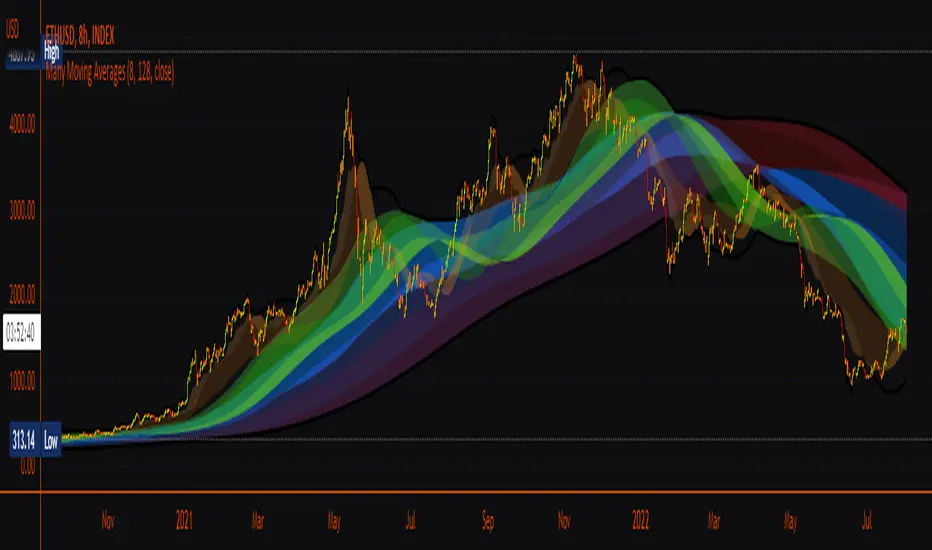
Many Moving AveragesA smooth looking indicator created from a mix of ALMA and LRC curves. Includes alternative calculation for both which I came up with through trial and error so a variety of combinations work to varying degrees. Just something I was playing around with that looked pretty nice in the end.
ALMA stdev band with fibsArnaud Legoux Moving Average with standard deviation band and standard deviation Fibonacci levels.
Standard deviation band is alma + stdev and alma - stdev.
Fibonacci levels are alma + stdev * fib ratio and alma - stdev * fib ratio (0.382 / 0.5 / 0.618 / 1.618 / 2.618).
Used like a moving average, but also shows probable price range based on past volatility, and helps to recognize support/resistance levels, trends and trend momentum based on the Fibonacci levels.

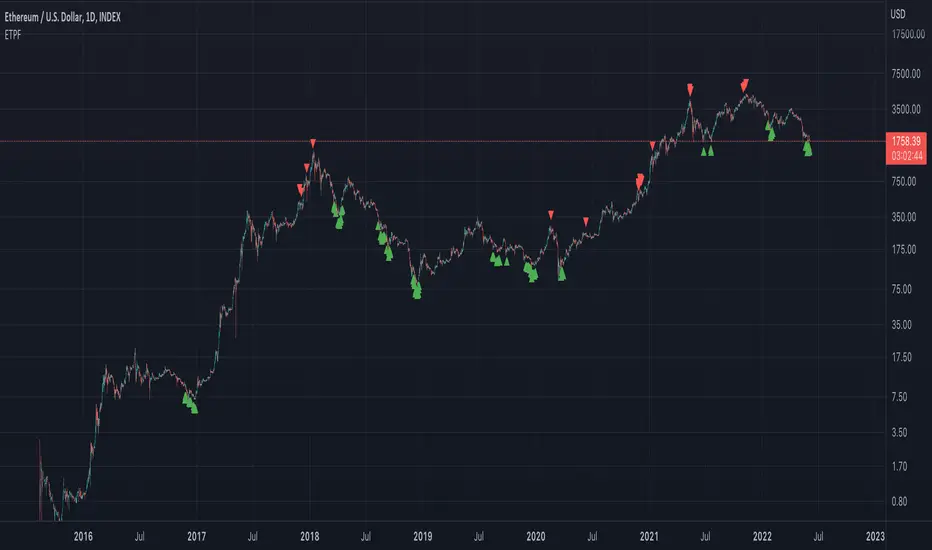
Exponential Top and Bottom FinderThis is an indicator to identify possible tops and bottoms after exponential price surges and drops, it works best on ETH 1D, but you can also use it for bitcoin and altcoins.
It's based on stochastic first and second derivatives of a close moving average
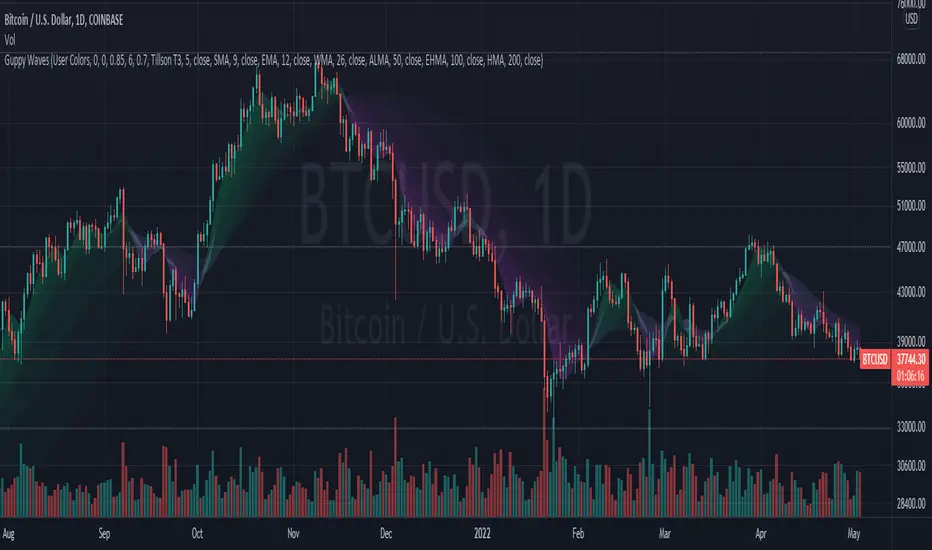
Guppy WavesA lightweight version of the popular "Moving Average Ribbon" or "Guppy" indicators where the visuals are plotted as "waves" rather than moving average lines. As is customary for my indicators, nearly everything about it is user selectable.
Visual Features:
User Customizable Colors
RSI-Based Rainbow Color Scheme
Simple Offset for adjusting transparency
Create great-looking charts very easily
Moving Average Options:
Running (SMoothed) Moving Average (RMA or SMMA ) - very slow/smooth
Simple Moving Average ( SMA )
Exponential Moving Average ( EMA )
Weighted Moving Average ( WMA )
Volume-Weighted Moving Average ( VWMA )
Triple EMA ( TEMA ) - very fast
Exponential Hull Moving Average (EHMA) - Hull with Smoothing (Slower than Hull)
Least Squares Moving Average ( LSMA ) - Simple Linear Regression
Arnaud Legoux Moving Average ( ALMA ) - Adjustable, set offset=1 to be current, offset=0.85 for good smoothing
Hull Moving Average ( HMA ) - very fast
Tillson T3 - very smooth
Donchian Moving Average - plots the average of (lowest, highest) for a given period length
The user can change the source, period, and type of moving average used for every single line on the chart.
ALMA cross signal by hk4jerry<< ALMA CROSS signal >>
*NONE REPAINT STRATEGY*
--As a result of testing for a month, using alma does not result in repainting--
--ALMA 크로스 결과는 한달간의 테스트 결과, 리페인팅되지 않습니다--
(ENGLISH description O)
==NOTE==
1. MA 크로스 지표는 잘못된 신호들이 자주 등장합니다. 정확성을 더 높일수 있는 방법은 없을까 고민을 해봤습니다. 더 낮은 가격에 매수하고, 더 높은 가격에서 매도하는 것이 중요했습니다. 우리가 흔히 저점, 고점을 알아내기 위한 지표이자, 선행지표인 RSI를 추가하는 방법을 연구했습니다.
2. 예를 들어, MA 크로스 매수 신호가 발생했을때, rsi값이 50이면 가격이 더 떨어질 가능성이 큽니다. 하지만, rsi값이 30이하인 경우에만 매수 신호가 발생한다면, 그 가격이 저점일 확률이 매우 높아지는 원리 입니다.
3. 신호는 확률입니다. 트레이딩에 100%는 없습니다. 그 확률을 높이는 것은 리스크 관리 입니다. 분할 매수 관점으로 포지션을 잡으시거나, 단기 매매로 가져가시는걸 추천드립니다.
==rsi ma source 설정==
1. 'rsi ma' 값의 소스입니다.
2. 'rsi 길이' 는 값이 클수록 더욱 정확한 시그널이 발생합니다.
3. EMA 길이가 짧을수록 더 많은 시그널이 발생합니다. 그러나, 정확도는 떨어집니다.
==rsi ma 설정==
1. rsi를 source로한 EMA입니다.
2. rsi와 유사한 성격을 가집니다.
3. 'rsi ma' 값이 30이하이면 과매도, 70이상이면 과매수 입니다.
4. ' rsi ma long value' 이 30이면 매수 신호가 rsi ma 값이 30 이하인 경우에만 발생함을 의미 합니다.
5. "rsi ma short value' 가 70이면 매도 신호가 rsi ma 값이 70 이상인 경우에만 발생함을 의미 합니다.
==rsi 설정==
1. 실제 rsi(14,close) 값을 의미합니다.
2. rsi ma value와 비슷한 기능입니다.
3. rsi 길이가 14이므로, 값은 40~50 사이가 적당합니다.
4. 30 또는 70으로 설정할 시, 신호가 거의 발생하지 않습니다.
(ENG)
==NOTE==
1. MA cross indicator often shows false signals. I was wondering if there is a way to increase the accuracy further. It was important to buy at a lower price and sell at a higher price. We studied how to add RSI, which is a leading indicator and an indicator to find lows and highs, often.
2. For example, when a buy MA cross signal occurs, if the rsi value is 50, the price is more likely to fall. However, if a buy signal occurs only when the rsi value is below 30, the probability that the price is at the bottom is very high.
3. A signal is a probability. There is no 100% in trading. Increasing that probability is risk management. It is recommended to hold a position from the perspective of a split buy or take it as a short-term trade.
==rsi ma source option==
1. The source of the 'rsi ma' value.
2. The larger the 'rsi length' value, the more accurate the signal is generated.
3. Shorter EMA lengths produce more signals. However, the accuracy is reduced.
==rsi ma options==
1. EMA with rsi as the source.
2. It has similar characteristics to rsi.
3. If the 'rsi ma' value is below 30, it is oversold, and if it is above 70, it is overbought.
4. If 'rsi ma long value' is 30, it means that a buy signal will only occur when the rsi ma value is less than or equal to 30.
5. If "rsi ma short value' is 70, it means that a sell signal will only occur when the rsi ma value is above 70.
==rsi option==
1. It means the actual rsi(14,close) value.
2. This function is similar to rsi ma value.
3. Since the rsi length is 14, a value between 40 and 50 is appropriate.
4. When set to 30 or 70, almost no signal is generated.
