BE - Spread_IndicatorSpread Indicator: An Overview Driven by the concept of forethought. The indicator predicts the range for the day and divides it into two or three Levels (upper, middle, and lower).
These ranges are drawn from possible supply and demand zones as well as potential price consolidation zones which has happend in the rolling number of days in the past.
It's true that market respects history. Which means the zones which are untested and created new in recent past shall be respected in the future days. Also the most respected Zones switch between support and resistance based on the price and volume pumped into the market.
Calucations Involved In the Indicator:
Indicator takes into account Factrol points, Fibonachi and its Retracements along with Channel and Candle Ranges to calculate the levels accordingly.
Levels Information:
Levels should be Treated and Traded the way like POC (Point Of Control). Price within the levels are basically controled by the levels above and underneath.
Converting idea to TradeOpportunity:
One can look into deploying IronCondor, while it is within the Zone also One Can deploy Long Straddle when the levels are Tested.
My personal Observation not a Trade Recommendation
With an Option Buyer view, I have been testing this indicator on the Index (BankNifty, FinNifty & Nifty) on 5 Min TF and 15 Min TF. Banknifty Works Well with Bull & Bear Spreads and FinNifty along with Nifty Works Well with Long Straddle & Long Strangle.
Happy to receive Suggesstions and feedback to improvise it with better option strategy.
Features:
1. Integrated with NLB for AlgoTrading.
2. Timely Alerts for Levels, Formation, Breach, TestOf Levels, CrossOvers.
3. Position Can be traded as CarryForward or Intraday.
Algotrading

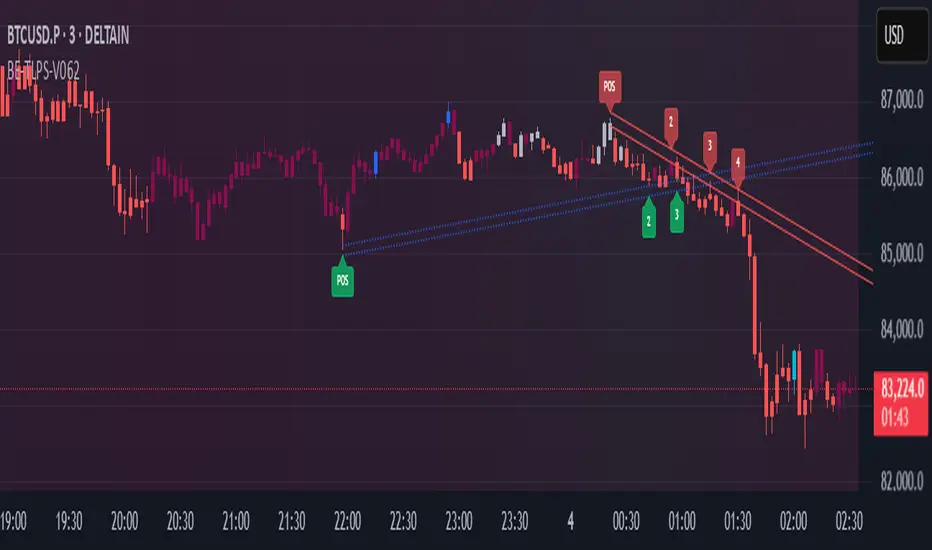
BE-TrendLines & Price SentimentsOverview
The trendline is one of the most potent and flexible tools in trading. A rising trendline indicates an upward trend, a falling trendline indicates a downward trend, and a flat trendline indicates a range-bound bond market.
Breakouts, price bounces, and reversal / Retest tactics are all types of trades that may be made using a trendline. Additionally, stop-loss and profit-trailing orders can be based on trendlines as support and resistance levels, appropriately.
Technical Calculations for Trendlines & Price Sentiments:
Pivot points for a specified time frame and the Prevailing High/Low for the most recent bars are used to derive trendlines. While Pivot Points alert us to price movements, High/Low tells us where Bulls and Bears find a middle ground. This provides a remarkable set of conditions from which to extrapolate the efficacy of the Trendlines.
The term "price sensitivity" refers to how much a change in the price of a product causes consumers to alter their purchase habits. It's the relationship between price shifts and shifts in consumer demand. So, for example, if a 30% jump in the cost of a product leads to a 10% drop in purchases, we can conclude that the item has a price sensitivity of 0.33%.
Basis the above theoretical statement, If the underlying asset's price drops, the indicator shall compute data on the amount of volume being pumped (Inflow vs Outflow) into the market (if available), or the percentage by which the price has changed. This will be compared to the recent drop rate to see if the behavior has changed at the similar value zone and non similar value zone. similar calculation shall be done if the price of the underlying rises.
Traders may benefit from hearing about Trendlines in their "Story Telling" form, which we now present. To help you comprehend it better, candles are divided into three Sentiment groups based on their color. Colors: Green (with its shades), Silver, and Red (including its shades). Green signifies a Bullish Trend, Silver a neutral trend, and Red a Brearish Trend.
Bullish Trend
Bearish Trend
Neutral Trend
Sentiment Price Cycle in Trending Market: Green (Directional Bullish), Dark Green (Bullish Trend Loosing its Strength), Silver (Neutral Trend), Red (Directional Bearish), Dark Red (Bearish Trend Loosing its Strength)
Sentiment Price Cycle in RangeBound Market: Green (Over Brought), Silver (Neutral) & Red (Over Sold)
How to Initiate Trade when price is within TL:
Fake Break Out Trade:
BreakDown Trade:
BreakOut Trade:
Couple of Other Features in the Indicator:
Single Alerts = These are the alerts where in, as and when the Event happens Alerts shall the trigerred. like On BreakOut, BreakDown, TouchOf Up TrendLine, TouchOf DownTrendLine, Retest Of Up TrendLine, Retest of DownTrendLine.
Conditional Alerts = These are those type of Alerts where in you can combine 2 or 3 conditions to trigger an Alert. Like
Sample 1 - After Down TL is tested for 3 times, If BreakOut happens and the setiment turns Bullish within 5 Candles.
Sample 2 - After Up TL is tested for 2 times, If Price Bounces backUp from TL and the setiment turns Bullish within 5 Candles.
Similarly you can customize the combination of events for getting the alert.
DISCLAIMER: No sharing, copying, reselling, modifying, or any other forms of use are authorized for our documents, script / strategy, and the information published with them. This informational planning script / strategy is strictly for individual use and educational purposes only. This is not financial or investment advice. Investments are always made at your own risk and are based on your personal judgement. I am not responsible for any losses you may incur. Please invest wisely.
Happy to receive suggestions and feedback in order to improve the performance of the indicator better.
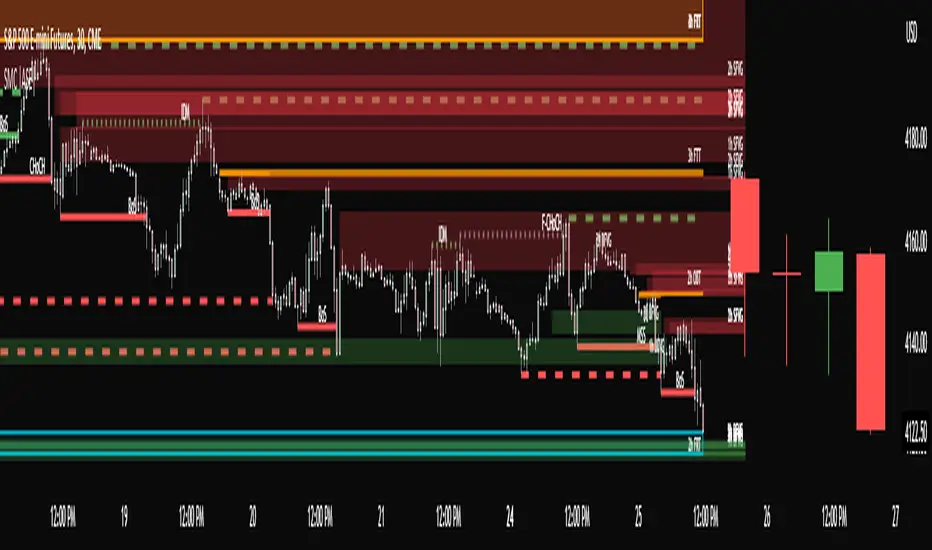
SMC Toolkit |ASE|This indicator provides 10+ features all-in-one. Focusing on price action and Smart Money concepts, we have provided automated multi-timeframe features such as Market Structure(BOS / CHoCH) to identify trends, Fair Value Gaps to identify Imbalances, and much more.
Pure price action analysis is a preferred strategy over indicators due to their lag and noise. Many traders popularized SMC or “Smart Money” concepts to identify and trade like/with institutions or Smart Money traders. We have automated these features and made them multi-timeframe to simplify your charting process and advance your trading so you can efficiently trade.
Features:
The included price action features are listed below:
- Multi-Timeframe Market Structure (BOS, CHoCH, MSS, IDM)
- Trend based Candle Coloring
- Multichart (Extra time frame on the same chart)
- Multi-Timeframe Fair Value Gaps & Balanced Price Ranges
- Trapped Market Participants (Multi-Time Frame based on Orderblocks)
- SMT Divergences
- Volume Imbalances
- Premium Discount Array
- Displacement Candles
- Previous OHLC (Daily, Weekly, Monthly)
- VWAP and Std.Dev. Waves
Benefits & Examples:
In the image below we can see plenty of trade setups that formed in confluence with the features we were using. Displayed we have higher timeframe FVGs as our point of interests, Market Structure (Trend Bar Coloring) as our entry confirmation, and Liquidity Levels as our targets.
In this image we can see the same setup as before, higher timeframe FVG with Market Structure reversal targeting a Liquidity Level. In addition we can see the Trapped Market Participants feature showing trapped sellers at the low which provides additional confluence for our long position and offers a cleaner and safer entry on the pullback.
Our goal is to provide as many useful features as possible, automating the process to make it easier and quicker for us as traders. We want to spend less time charting and more time planning proper trades.
Model Indicator |ASE|The purpose of this indicator is to allow the user to build their own model. Each feature works cohesively together and depending on the filters you enable, the model gives less and more specific entries. This benefits the trader because they have complete control over the kinds of trades they want to take, while maintaining its automatic form.
We want to be as customizable as possible while still meeting our users’ needs. We started this indicator to propel us into our ultimate project, the ASE Algo.
Features:
SMC Display
Current Structure:
Liquidity Levels:
Daily Premium Discount Array
SMT Divergence
Displacement Candles:
Entry Factors
FVG
Continuation FVGs
MTF FVGs
Order Blocks
MTF Order Blocks
Confluence Filters
MS Reversal
Liquidity Level Raid
Inducement
Daily Prem/Disc Array
Target Factors
Liquidity Level Targets
Current Structure Targets
Trade Management
Trade Overlay
Risk:Reward Target
Benefits & Examples:
In the image below the indicator signaled multiple entries based on two simple confluence filters, a MS reversal (CHoCH/MSS) and a Liquidity Raid. Going from left to right we can see a short entry at the highs with a supporting Order Block. Liquidity levels are taken before we see a double IDM right below the respected OB that leads to the next signaled entry. In the middle of the chart we see a long entry that leads right into a short entry showing the effectiveness of such a simple model.
In this supporting image we are showcasing the first implementation of the Trade Overlay feature. This feature displays the Entry and Stop Loss to make it more visible and adds a risk to reward target. Additionally displayed is the SMC Toolkit indicator showing us additional confirmation with our signaled entries playing right out of a higher timeframe FVG.
An additional entry feature is the MTF zone. Setups can form on all timeframes and subjecting yourself to only one may lead you to miss out on some perfect setups or a larger move. In the image below we are on the 1 minute timeframe. We can see the Initial Reversal Entry which played out beautifully and filled a higher timeframe SFVG. With the MTF zone we can see a 3 minute and 5 minute Zone which produces the rest of the trend reaching another higher timeframe SFVG after filling the previous one. Once again showing the benefit of the Toolkit indicator but the plotted entries from such a simple model.
In addition to the model indicators filtered out entry zone, we can use additional confluences to confirm these entries. In the image below we can see a short entry printed after a move out of the Std. Dev. vwap wave which shows over extension. Taking the entry we can have a tight stop loss at the vwap wave or the recent high where we have a liquidity level, targeting a lower liquidity level or higher timeframe FVG.
For this example we are only filtering based on MS Reversals (CHoCH/MSS) to get our entries. Because of this we need additional confirmation to be confident in taking the plotted entry. In the image below you can see a long signal printed, confirmation being the previous Failed Reversal.

BE - OBV MACD█ Overview
BE - OBV MACD - Algo Trading is an indicator developed to analyze volume , MACD and PSAR simultaneously in order to understand how they are co-related to each other. This tool calculates the likelihood of strength for buying or selling within the market direction.
█ Calculations
The algorithm individually computes the likelihood of flow of volumes (OBV, MACD & PSAR). A positive score is assigned for events where the Buyers volume is rising over the candle, MACD on the price is rising and MACD on the OBV is providing positive output and the PSAR is Below the close price thus generating the Buy Signal, and a negative score for the vise versa thus generating the Sell Signal.
Note: Since this indicator is an overlay indicator MACD and OBV is not shown on the chart. One can add them on the chart if you wish to analyze the impact of the same.
█ Settings
Customization of settings is possible for risk management concepts like setting the initial SL level, Trail SL Level, Day Max Level.
Hide or Show plots and Table is possible from the indicator settings.
-----------------
Disclaimer
The information contained in my Scripts/Indicators/Ideas/Algos/Systems does not constitute financial advice or a solicitation to buy or sell any securities of any type. I will not accept liability for any loss or damage, including without limitation any loss of profit, which may arise directly or indirectly from the use of or reliance on such information.
All investments involve risk, and the past performance of a security, industry, sector, market, financial product, trading strategy, back-test, or individual's trading does not guarantee future results or returns. Investors are fully responsible for any investment decisions they make. Such decisions should be based solely on an evaluation of their financial circumstances, investment objectives, risk tolerance, and liquidity needs.
My Scripts/Indicators/Ideas/Algos/Systems are only for educational purposes!

BE - Golden Cross Crude KeyTraders, i have been observing crude oil for about 3 months now and somehow I can see that crude is respecting 42 days Moving average and crosses have created massive spikes most of the time.
However you need to be mindful of the time to trade and timeframe since not all crosses creates spikes.
Note: I have been testing on a 15min timeframe.
Keeping this in mind, this indicator is a automated solution which takes trade entries on crosses plus buffer and exits based on the specified Sl type.
Enjoy!
DISCLAIMER: No sharing, copying, reselling, modifying, or any other forms of use are authorized for our documents, script / strategy, and the information published with them. This informational planning script / strategy is strictly for individual use and educational purposes only. This is not financial or investment advice. Investments are always made at your own risk and are based on your personal judgement. I am not responsible for any losses you may incur. Please invest wisely.
Happy to receive suggestions and feedback in order to improve the performance of the indicator better.

BE - Pr_DayLowHigh_BreakoutScreener AlgoHerewith presenting the Screener based indicator which supports Algo trade on the NSE stocks. The idea behind this indicator is when the Current day stock breaks out of Yesterday's high or Low with promising volumes (Using MA's and POC of Volume Profile) along with formation of candle Pattern. Initiates the Trade entries.
Note: Indicator is designed to take an entry even before the candle is closed as soon as the entry level is crossed and it shall exit the trade as soon as the SL is hit even before candle is close.
How to Work with this Indicator.
You can map up to 15 Scripts in this indicator. However you may decide if you wish to load all 15 are few of them. if you wish to load only 10, below settings should help you ignore the rest 10 symbols from screening it for setups
Updating Symbol Script.
This is an important part is used for Algo trades. Read the tooltip for better understanding of the format. Acceptable format is Broker Name followed with : and space with Symbol mapping Name followed with / and Instrument token provided by broker if no token alloted for the script then you may keep 0 against symbol name followed with / and Qty in terms of absolute value or in terms of percentage.
Trade and Scan Settings
Symbol List Mapping
For Improvements in Results - Use Events and keep a track of it / use Nudges etc.

Most Power V5 Most Power V5
The MOST indicator is an indicator used as a Moving Stoploss. The MOST indicator also generates a buy signal in case the prices rise, unlike the traditional indicators that allow you to make stop losses.In the MOST POWER V5 indicator, stoploss generates its signals using moving averages such as 'SMA', 'EMA', 'WMA', 'VWMA', 'HMA', 'SMMA', 'DEMA' rather than just the current price. In this way, it aims to prevent false signals that may be produced by excessive price movements during the day.
MOST POWER Indicator follows the average by preserving the stop loss distance in the movement of the moving average in the same direction.
The second variable that creates the MOST POWER curve is the stop loss distance that gives power to MOST with the moving average used and the shift rate that provides the stop signal. In this version, this distance is prepared with 2 separate inputs for both buy and sell.You can set these values as "percentage for long trend" and "percentage for short trend" in the indicator input properties.
You can also enter your Take Profit-1, Take Profit-2-, Take Profit-3- and Stop Loss levels in the indicator input properties, especially if you are interested in algo trading or to take advantage of the wonderful alarm setup features of tradingview and get the chance to get maximum profit. (If you enter Take Profit-1, Take Profit-2-, Take Profit-3- and Stop Loss levels as 0. Only buy and sell labels will appear on the indicator.)
Also, activate the amplitude filter option from the indicator input settings to get less signal and filter our inputs.
In addition, the entry price, take profit1, take profit2, take profit3 values for the last transaction opened to make things easier are located in the upper right corner of your graph as a table.
Important note: No indicator guarantees investment. That's why the tests you will do before real trades are very important in this indicator. I wish you all successful trades.
i will show how works with examples
Example 1
If you enter Take Profit-1, Take Profit-2-, Take Profit-3- and Stop Loss levels greater than 0
Example 2
If you enter Take Profit-1, Take Profit-2-, Take Profit-3- and Stop Loss levels as 0 (u will see only buy - sell labels)
Example 3
if select Amplitude Filter is on . you will see less signal
how works Amplitude Filter whats logic ?
if Amplitude Filter is active the signal from mostpower will be combined with Amplitude Filter.
for example, if the amplitude value is 2, the highest price and the lowest price of the last 2 bars are calculated. then this amplitude value is calculated for sma with its source high and low. Based on these values, the trend is determined in the amplitude of the price movement.
Important note: No indicator guarantees investment. That's why the tests you will do before real trades are very important in this indicator. I wish you all successful trades.

BE- InsideOut Explosion - Trade the Benefit Of DoubtDear Traders,
Here with presenting the new Indicator which is primarily built based on the the concept Contraction & Explosion.
Idea behind this Indicator: I am sure every trader would have heard about consolidation and Expansion. When we we look deep inside the consolidation zone it leaves a mark
on the direction most of the time and just explode breaking the consolidation zone. What if the explosion is to trap the retailers like me!!. That's why I call this as Benefit of doubt. If the direction of is right I just sail with the trade right inside the consolidation zone. If I am on the wrong side ! No worries My Money management rules and Protection Legs kicks in and saves my capital.
This Indicator Analyses the Volume, and Chart Patterns inside the Zones and if the price breaks the patterns, initiate the trades. You can trade with Dhan HQ or Algoji.
What this indicator is providing:
Based on the chart patterns and using the inputs provided for RISK and Money Management options, Indicator continuously scans for trading opportunities and provides alerts for possible trades. I have tried to capture some analytical inputs for one to think and take control over the Reward, Risk and Money management parameters to tweak the indicator accordingly.
Note: Indicated PNL is calculated on the Futures Chart with 2 Lots taken per trade.
If you are a Options Traders:
1. Auto Strike is inbuilt and can be traded only if you are trading via AlgoJi.
You will constantly be informed about trade summary, PNL and SL updates as per your preferred choice.
Enjoy!
DISCLAIMER: No sharing, copying, reselling, modifying, or any other forms of use are authorized for our documents, script / strategy, and the information published with them. This informational planning script / strategy is strictly for individual use and educational purposes only. This is not financial or investment advice. Investments are always made at your own risk and are based on your personal judgement. I am not responsible for any losses you may incur. Please invest wisely.
Happy to receive suggestions and feedback in order to improve the performance of the indicator better.

BE - Volume Scalping ProDear Traders,
Here with presenting the new Indicator (Strategy) for scalping which is primarily built based on the the Volume Analysis.
Idea behind this Indicator: I am sure every trader would agree that Volume is one of the Leading indicator along with Price, and hence thought to use the same for scalping the trades. There is a direct co-relation between the price and volume and thereby used this as a base for arriving at strength of the volume pumped in. Indicator is working on the Logic of "What is the ROC in price for the volume dumped in and does ROC quantify the same which is happened in the recent past of x candles." In order to be successful in scalping trade, Accuracy, Risk to reward and Money Management is very much crucial and hence thought so much on this to make it happen.
Note: Accuracy here being profitable in the trade and not hitting the bulls eye all the time.
What this indicator is providing:
Based on the volume, ROC & Candle Thresholds and using the inputs provided for RISK and Money Management options, Indicator continuously scans for trading opportunities and provides alerts for possible trades.
Alerts & Notifications:
There are basically 3 types of Alerts provided one with General Notification and Other with Dhan HQ notifications to support Algo Trades and AlgoJi for supporting Algo trades too.
Self Declaration:
I have been testing the performance in 30 seconds and 1 min chart and I haven't faced any issues yet. I strongly recommend users to use the same in timeframe less than 10 Min only.
Enjoy!
DISCLAIMER: No sharing, copying, reselling, modifying, or any other forms of use are authorized for our documents, script / strategy, and the information published with them. This informational planning script / strategy is strictly for individual use and educational purposes only. This is not financial or investment advice. Investments are always made at your own risk and are based on your personal judgement. I am not responsible for any losses you may incur. Please invest wisely.
Happy to receive suggestions and feedback in order to improve the performance of the indicator better.

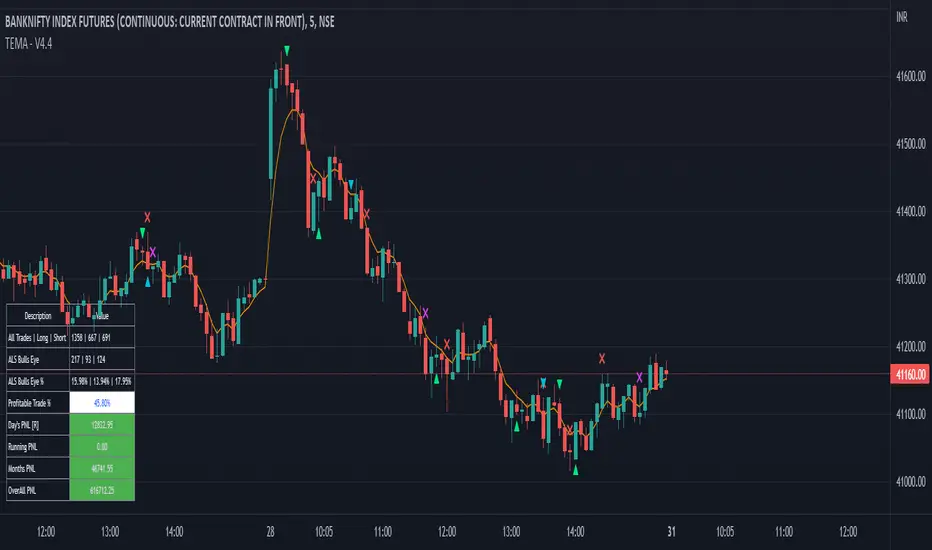
Tripple EMA Strategy - Dhan HQDear Traders,
Here with presenting the new Indicator (Strategy) which is primarily built based on the the EMA moving Average and Candlestick Pattern.
Idea behind this Indicator: I am sure every trader would have traded using Moving average one day or the other. And Moving average is theoretically they are Lagging and the EMA are used in place of Moving average just to avoid a bit of Lag to take advantage of those accuracy while avoiding the Lag. In order to be successful in trading Money Management and Risk Management is very much crucial and should be part of every trade we place.
What this indicator is providing:
Based on the EMA and candlestick patterns and using the inputs provided for RISK and Money Management options, Indicator continuously scans for trading opportunities and provides alerts for possible trades. I have tried to capture some analytical inputs for one to think and take control over the Reward, Risk and Money management parameters to tweak the indicator accordingly.
Below are the Analytical outputs provided:
1. Total Trades taken (History till present) and its profitability % & appx PNL
2. Current Dates & Yesterday's Trades along with its appx PNL
3. Long Trades performance vs Short Trades performance
4. Retrieve PNL values post specified Date in the Input settings.
5. Last 7 Days PNL
6. Month's PNL
Note: There is known BUG in the calculation where the first date of the month for Monthly PNL value is a trading Holiday then Monthly PNL is being displayed as 0. similarly this Bug is flowed for Last 7 Days PNL. This will be addressed in upcoming version along with planned release.
Alerts & Notifications:
There are basically 2 types of Alerts provided one with General Notification and Other with Dhan HQ notifications to support Algo Trades for Dhan HQ Baskets.
Overview for Dhan HQ Trade Alerts:
1. When the Day Beginning (At Session Start) Hedge Position can be placed and shall be squared off post Closing the session
2. During the course of the Day Buy & Sell Baskets shall be executed
3. Can map the Trade Level SL values
4. Can map Daily Limit for SL to avoid excessive Loss. Upon Loss you could stop trades for the complete day or you may restart the trade post completion of X no of hours.
Enjoy!
DISCLAIMER: No sharing, copying, reselling, modifying, or any other forms of use are authorized for our documents, script / strategy, and the information published with them. This informational planning script / strategy is strictly for individual use and educational purposes only. This is not financial or investment advice. Investments are always made at your own risk and are based on your personal judgement. I am not responsible for any losses you may incur. Please invest wisely.
Happy to receive suggestions and feedback in order to improve the performance of the indicator better.
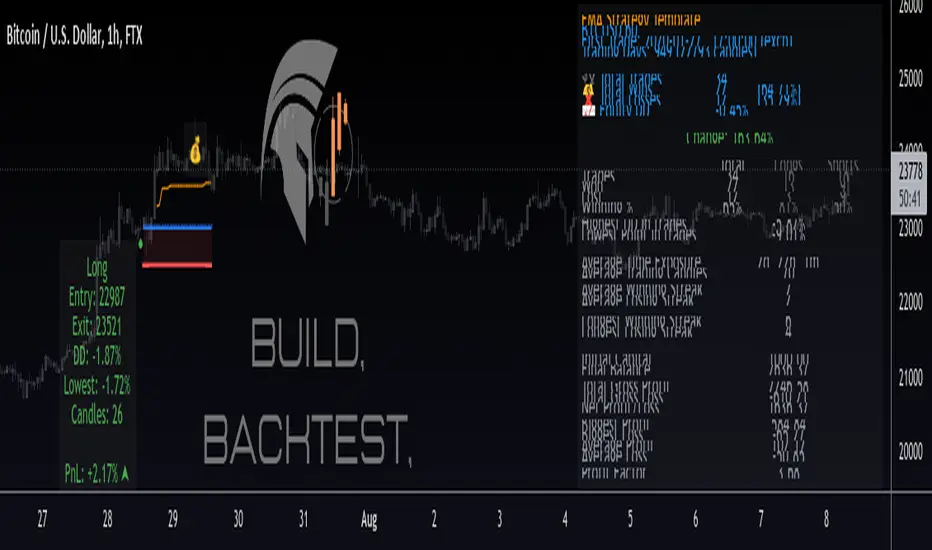
Protervus Trading ToolkitHi Traders! Welcome to Protervus Trading Toolkit (PTT) , a comprehensive set of tools to help you building, backtesting, and even automating your strategy.
Important : the data and screenshots I publish are solely for presentation and explanation purposes and must not be intended as recommendations or guarantees. Please consider eventual backtesting results seen here as almost-random. My goal is not to provide ready-made strategies, signals, or infallible methods, but rather indicators and tools to help you focus on your own research and build a reliable trading plan based on discipline.
BUILD, BACKTEST, AUTOMATE
The first step is to link a chained indicator which will send Entry signals and, optionally, Exit signals: to integrate your own triggers with this toolkit, check out my tutorial and use this code as a template.
Then, in the Trading Settings you can set the Trading Mode (Full - Long and Short, Long only, or Short only) as well as Starting Capital, Drawdown Limit, Risk per Trade, Fees, and the date range in which trading will be enabled and backtested.
Go further by tweaking your strategy with built-in Take Profit and Stop Loss conditions, and keep it under control thanks to the Statistics Panel.
Trades will be shown on the chart, including TP\SL levels (according to the ones you enable) and per-trade statistics:
Tip: point the cursor over TP or SL icon to open the tooltip, showing additional details about the trade.
BUILT-IN CONDITIONS
Note: all conditions already account for fees.
Take Profit \ Stop Loss percentage
Take Profit or Stop at Loss when a fixed percentage is reached.
Limit \ Hard Stop: the trade will be considered closed when that specific price is reached - otherwise, the candle closing price will be used.
Trailing Take Profit
Trail the price and close the trade in profit when it reverses for the chosen percentage.
Engage and Disengage: activate trailing when the price is above the entry price for the chosen percentage, and de-activate it if price goes past the disengage percentage.
Safety TP: close the trade at Break-Even if the price sharply reverses from engaged area to BE level. A specific Alert is available in order to create a separate trigger with immediate effect.
Note: using TP Safety with an Engage % of zero might result in many early exits, so it is recommended to add some margin to Engage % to avoid that.
Exit \ Stop on Opposite Signal
Close the trade when another, contrary signal is received (e.g. close a Long position when a signal to go Short is received).
Exit \ Stop after X candles
Close the trade after X candles, as soon as the condition is met (e.g. for Take Profit condition, it will close the trade after X candles as soon as the trade is in profit).
Bind to TP \ SL: only validate the condition if the current PnL is above (TakeProfit cond.) or below (Stop Loss cond.) the specified percentage.
ATR Stop
Classic ATR Stop Loss.
Trailing ATR
Chase the price by the defined ratio and close the position when the candle closes past the ATR line.
Bind to TP \ SL: only validate the condition if the current PnL is above (TakeProfit cond.) or below (Stop Loss cond.) the specified percentage.
External Signal (sent from your indicator)
Close the position basing on your own triggers, defined in the chained indicator.
- Bind to TP \ SL: only validate the condition if the current PnL is above (TakeProfit cond.) or below (Stop Loss cond.) the specified percentage.
PANEL CUSTOMIZATION AND ADDITIONAL OPTIONS
A strategy name can be assigned in the settings and will show it at the top of the Statistics Panel, so you can better identify and label your tests and live instances.
The panel can be customized in terms of colors, text size and height. It can be also "split" in modular panels that will appear at the bottom of the chart.
It is also possible to show \ hide prices and live data labels as well as position and Break-Even levels. In some cases you will need to limit the display of those plots in order to avoid PineScript calculation issues.
If you limited the plots but you are checking very old trades, you can enable the Legacy position tracker to see basic markers for positions (position is active, and profit \ loss marker).
In the case you will be sending webhook alerts to a trading bot , "Position Alert Failover" will come in aid to prevent situations where the initial trade closing alert is either not sent or missed: it will keep sending the position closing signal for X candles.
PLUGINS
Thanks to the modular nature of PTT, plugins will eventually be available to provide additional features and extend functionalities even further. Make sure to keep an eye on updates.
CREATING ALERTS
To create alerts you must first select the PTT indicator from the "Condition" drop-down menu, then the whole list of available alerts will appear. When creating alerts, please make sure to set "Once Per Bar Close" for the normal conditions, and "Once Per Bar" for safety conditions (Limit and Hard Stop simulation, Trailing TP Safety Trigger).
Besides positions opening and closing alerts, you also have the option to add extra alerts for when a position is open or not open (e.g. Active Long position, No Long Position) - that might come handy when dealing with trading bots and automation tools. Also, as mentioned earlier, you have the chance to create a special alert as failover in order to repeat the closing alert.
TIPS AND RECOMMENDATIONS
Set Visual Order > Bring to front for PTT to avoid other indicators or candles covering up labels.
If you receive errors like "Referencing too many candles" or "Too many drawings", use the " Limit to last candles " function in the Settings panel to lower the number of candles.
If the Statistics Panel or labels are not appearing, and no errors are shown (red circled exclamation mark next to indicator's name), try changing any value in the settings to trigger a new calculation.
The Lowest Point in Trades refers to the maximum movement against your position. However, if the price never goes negative against the Entry level, it will be calculated from the Break-Even level.
Differently from TradingView's Strategy Tester, PTT calculates DrawDown from the Equity line (the starting balance).
Remember that Backtests only show past results, and although very useful to understand if your strategy makes sense, the market can completely change at any moment and ruin your dreams: make sure to avoid over-fitting (using very specific values) in your settings and to prefer more generic values in order to factor broader market situations.
After many successful backtests of your newly created strategy, let it run live without actually trading it for some time (paper trading), and see if it remains valid.
You can use multiple Conditions as safeguard. For example, main Stop condition can be Trailing ATR and secondary Stop condition can be Stop Loss % with Hard Stop, so you will be protected in case of sudden big price moves.
Refracted EMARefracted EMA is a price based indicator with bands that is built on moving average.
The price range between the bands directly depends on relationship of Average True Range to Moving Average. This gives us very valuable variable constant that changes with the market moves.
So the bands expand and contract due to changes in volatility of the market, which makes this tool very flexible exposing psychological levels.

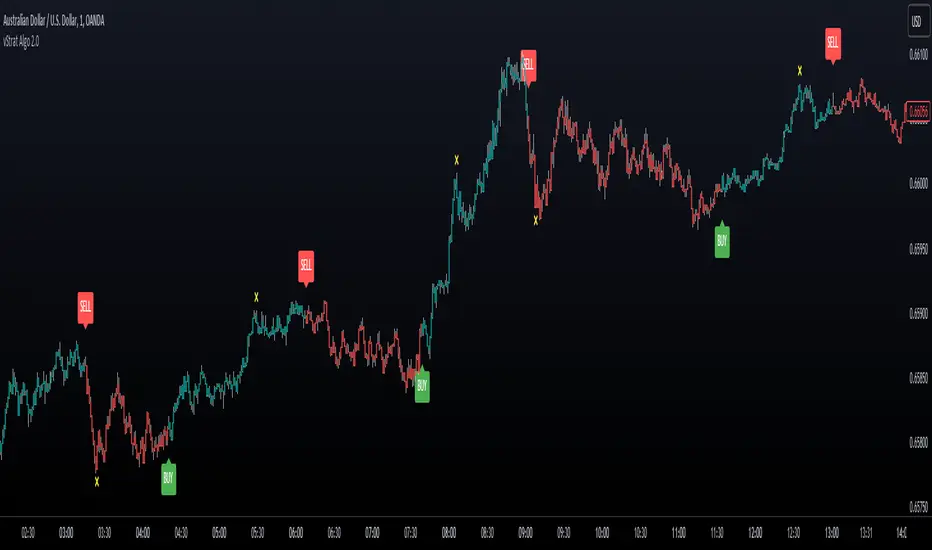
vStrat Algo 2.0vStrat Algo 2.0 is a Non-Repainting toolkit that works on any market such as stocks, crypto, forex, indices, commodities, etc. There are 8 advanced features that traders can use to help them create their own strategies. vStrat Algo 2.0 offers 10 sensitivity presets that they can choose from, making this toolkit suitable for every trading style whether it's scalping, day trading, swinging, or position trading.
I. Non-Repainting
When an indicator is Repainting , it changes its values as new data arrives, making it an unreliable indicator especially for Buy and Sell signals but this does not necessarily mean that the indicator is less accurate. vStrat Algo 2.0 does not repaint so the signals that were triggered in real time will stay the same during backtesting. If Non-Repainting is disabled, the signal that was triggered on a candle might disappear as new data arrives and once that candle closes, the signal might not even be there anymore, but it could get triggered on the next candle instead.
II. Signal Sensitivity
The Buy and Sell signals are highly accurate but the placement of each signal will differ for each selected preset. The higher the sensitivity (3.0 - 5.0), the more signals will be displayed on the chart. This setting works well when scalping using lower timeframes (1 min - 5 min). As the sensitivity lowers (0.5 - 2.5), less signals are displayed on the chart. If you are day trading or swinging, the lower presets are recommended as they are smoothed and will have less noise. Lower sensitivity works well on any timeframe.
III. Safe Mode
This feature hides any Buy and Sell signals that are triggered within the Consolidation Zones. The signals can still vary depending on the sensitivity, CZ Smoothing and CZ Length. The default setting is "3" and "7". "Unfiltered" must be unchecked for the signals to disappear.
IV. Unfiltered Signals
All Buy and Sell signals are displayed on the chart. This feature must be disabled if "Safe Mode" is enabled.
V. Trend Candle Colouring
This changes the bar colors depending on its trend. Green if it's trending up and red if it's trending down.
VI. Trend Cloud
Trend Cloud indicates the current market trend. This can also be used as a confluence to the Buy and Sell signals. Wider cloud indicates a strong momentum on either direction. As the cloud narrows, it could mean a possible reversal.
VII. Pivot Points
Pivot Points are useful for identifying significant support and resistance levels as well as identifying entry, exit, stop loss, and target profit levels.
VIII. Consolidation Zones
Consolidation Zones can be used to identify if the market is ranging. If enabled, it changes the colors of the bars that have low momentum to yellow. It is best to wait for a breakout to enter a trade but you can still be profitable when the market is ranging by trading based off Support and Resistance Levels and Imbalance Zones. Default setting is: Smoothing "3" and Length "7".
IX. Take Profit Levels
Take Profit signals are displayed on the chart as yellow "x". Once the algo detects a potential reversal, a Take Profit signal will be triggered so the user can lock in their profits. The signals can appear more than once so you have the option to keep holding as long as you know the risks. The lower the Length is, the more signals appear.
X. Alerts
Buy and Sell signal alerts can be created by clicking the three dots in the vStrat Algo 2.0 indicator tile.
Disclaimer:
All information found here, including any ideas, opinions, views, predictions, forecasts, commentaries, suggestions, or stock picks, expressed, or implied herein, are for informational, entertainment or educational purposes only and should not be construed as personal investment advice. While the information provided is believed to be accurate, it may include errors or inaccuracies. Conduct your own due diligence or consult a licensed financial advisor or broker before making any and all investment decisions. Any investments, trades, speculations, or decisions made on the basis of any information found on this site, expressed, or implied herein, are committed at your own risk, financial or otherwise.
Unicorn X-AlgoUnicorn X-Algo is a multifunctional trading indicator. It is designed to help traders make real-time decisions using quantitative models.
Its core is a trend trading strategy based on our enhanced Trailing Stop-Loss algorithm. This strategy provides the user with position entry and exit signals. It is customizable and has a built-in instant backtesting feature.
For those who have difficulty with finding the good settings the indicator has the Automatic Mode. In this mode, there is no need for the user to adjust any settings. The indicator calculates optimized trading signals automatically.
In addition, the indicator provides a number of useful tools that aim to provide additional confirmation to the trading signals. They include: support and resistance levels forecast, price range prediction and institutional activity detection.
The script can send real-time alerts to the user’s Email and to the cell phone via notifications in the TradingView app.
The indicator can be used for various types of trend and swing trading, including positional trading, day trading and scalping.
Unicorn X-Algo allows users to:
forecast direction of trends with BUY and SELL signals;
determine the right time to close a position;
detect institutional activity in the market;
forecast key support and resistance levels;
predict the future price range for any market;
customize any settings and do a backtest with one click;
see historical trades on the chart;
use the fully Automatic Mode where the algorithm optimizes all its settings itself.
When using this script, keep in mind that past results do not necessarily reflect future results and that many factors influence trading results.
FEATURES
Trading signals
The feature calculates trend or swing entry and exit signals. The underlying strategy does not use fixed Take-Profit levels. It trails the price with a Trailing Stop-Loss to get as many pips as possible from price movements.
The feature is based on our custom Volatility Stop algorithm. It uses linear regressions instead of averaging. As our practice shows, this helps to reduce signal lag while keeping the number of false signals low.
Trading signals are customizable with Sensitivity and Trade Length parameters which determine the trading signals frequency and width of the Trailing-Stop levels, respectively.
Automatic Mode
The Trading Signals function has an automatic mode. When it is turned on, you do not need to adjust the trading signals settings. The algorithm tries to calculate the best settings automatically using an optimization algorithm.
In this mode, Buy and Sell signals are displayed as green and red triangles respectively. There are two types of exit signals displayed as circles and crosses. A circle signal means that a price reversal is expected and you can partially close the position. A cross signal means that a trading signal in the opposite direction is expected soon and you can partially or completely close your position.
Support and Resistance Levels
Support/Resistance levels forecasting model. The forecasted levels are non-repainting. Once calculated for a specified period in the future (day, week, month, etc.), they don't change during this period.
The feature allows the trader to plan trades and use the forecasted levels as entry levels and targets for opening and closing positions. Both intraday and higher timeframes are supported.
The forecasting model analyses the distribution of the price time series to find clusters in the data. These clusters are then used to make the key price levels forecast.
Big Money Activity detection
The Big Money Activity tool identifies areas on the price chart associated with instructional traders' activity in the market.
Institutional activity in a trending market can be a leading signal for upcoming reversal. Institutions could be fixing their profit, causing the price to move against the current trend.
Institutional activity in a sideways market can be due to positions accumulation and signal a new trend formation.
The algorithm uses tick volume, volume, and volatility data to forecast activity of institutional investors. The method develops the idea described in the Daigler & Wiley (2015) and Shalen (1993) works. It says that when institutional traders actively open or close their positions in the market, a divergence between volume and volatility time-series arises. It can be due to their use of position-splitting algorithms that reduce the impact of their positions on the market.
Trading Range Forecast
Trading Range Forecast feature predicts the price range of an asset for a selected period of time in the future, called Forecast Horizon. It can be the next day or 12-hour trading session. This function works if your chart timeframe is intraday (i.e. the timeframe below "D"). It shows the upper and lower bounds between which the price is going to stay in the upcoming Forecast Horizon period.
Instant Backtesting
After changing any settings, you can immediately see the performance of the strategy on the Instant Backtesting panel. Two metrics are displayed there - the percentage of profitable trades and the total return. This information, as well as the historical trades shown on the chart, will help you quickly and easily evaluate any settings you make.
SETTINGS
TRADING SIGNALS
Trade Length - defines the length of the trades the algorithm tries to make. Recommended values are from 1.0 to 6.0.
Sensitivity - controls the sensitivity of the trading signals algorithm. The sensitivity determines the density of trading signals and how close the trailing-stop levels follow the price. The higher the value of this parameter is, the less sensitive the algorithm is. High values of the Sensitivity parameters (100-500) can help to withstand large price swings to stay in longer price moves. Lower values (10-100) work well for short- and medium-term trades.
TRADING TOOLS
Big Money Activity - turns on and off the identification of the areas associated with institutional traders activity.
SUPPORТ AND RESISTANCЕ LEVELS
Show Support And Resistance Levels - turns on and off support and resistance levels calculation.
TRADING RANGE FORECAST
Show Trading Range Forecast - turns on/off trading range forecasting
Forecast Horizon - sets the period for which the trading range forecast is made
Forecasting Method - allows to choose a forecasting algorithm for the trading range forecast.
BACKTESTING
Use Starting Date - turns on/off the starting date for the strategy and backtests. When off, all available historical data is used.
Starting Date - sets the starting date for the strategy and backtests.
Show Instant Backtesting Dashboard - turns on/off a dashboard that shows the current strategy performance: the percentage of profitable trades and total return.
Leverage - sets the leverage that the strategy uses.

Unicorn QuantDeeply customizable trading algorithm with instant backtesting. It emulates real trading and displays all the actions it takes on the chart. For example, it shows when to enter or partially close a position, move Stop-Loss to breakeven, etc. The user can replicate these actions in their trading terminal in real time. The algorithm uses up to three Take-Profit levels, and a Stop-Loss level that can move in a trade to protect the floating profit.
The script can send real-time alerts to the user’s Email and to the cell phone via notifications in the TradingView app.
The indicator is designed to be used on all timeframes, including lower ones for intraday trading and scalping.
HOW TO USE
Set the Stop-Loss and up to three Take-Profit levels. Choose the rules for moving the Stop-Loss level in a trade. Adjust the sensitivity of the trading signals. And check the backtest result in the Instant Backtesting dashboard. If the performance of the strategy satisfies you, proceed with the forward testing or live trading.
When using this script, please, keep in mind that past results do not necessarily reflect future results and there are many factors that influence trading results.
FEATURES
Trading Signals
The feature calculates Buy and Sell signals for trend or swing trading. The user can change the Sensitivity parameter to control the frequency of the signals. This allows them to be adjusted for different markets and timeframes.
Position Manager
To make the Position Manager setup as easy as possible, the algorithm calculates Stop-Loss and Take-Profit levels in Average True Range (ATR) units. They are self-adjusting for any market and timeframe, since they account for its average volatility .
You don't have to worry about what market you are trading - Forex, Stocks, Crypto, etc. With the self-adjusting Stop-Loss and Take-Profit, you can find settings that work for one market and use the same numerical values as a starting point for a completely different market.
Instant Backtesting
After changing any settings, you can immediately see the performance of the strategy on the Instant Backtesting panel. Two metrics are displayed there - the percentage of profitable trades and the total return. This information, as well as the historical trades shown on the chart, will help you quickly and easily evaluate the settings.
SETTINGS
TRADING SIGNALS
Sensitivity - controls the sensitivity of the trading signals algorithm. It determines the frequency of the trading signals. The higher the value of this parameter, the less trading signals you get and the longer trends the algorithm tries to catch. The lower the sensitivity value, the more signals you receive. This can be useful if you want to profit from small price movements.
POSITION MANAGER
SL - sets the Stop-Loss level measured in ATR units.
TP1, TP2, TP3 - set the Take-Profit levels measured in the ATR units.
Close % at TP1, Close % at TP2, Close % at TP3 - set portions of the open position (as a percentage of the initial order size) to close at each of the TP levels.
At TP1 move SL to, At TP2 move SL to - set the rules for moving the Stop-Loss level in an open trade to protect the floating profit.
Show Open Position Dashboard - turns on/off a dashboard that shows the current Stop-Loss and Take-Profit levels for the open position.
BACKTESTING
Use Starting Date - turns on/off the starting date for the strategy and backtests. When off, all available historical data is used.
Starting Date - sets the starting date for the strategy and backtests.
Show Instant Backtesting Dashboard - turns on/off a dashboard that shows the current strategy performance: the percentage of profitable trades and total return.
Leverage - sets the leverage that the strategy uses.

New York Happy HourNew York Happy Hour
Script inspired by Stacey Burke’s 'Trading New York Open 1 Hour a Day'. You know where to search. The algos run on New York time. You’ll be looking to trade from 9.30 AM NY EST using a full day of trading data behind you.
Instruments:
- Gold, major currency pairs, indexes, metals and crypto
Timing: 15 Min
Best Trade Setups:
- 3 Levels (HOD/LOD)
- Trend Trades
- Reversal Trades
- Trading Range
- Or what you see best fit
Script Breakdown:
Sessions:
Asia: 8-11 PM
London: 2-5 AM
New York: 8-11 AM
Other lines:
New York Midnight Open
New York Open
London and NY vertical lines
Previous daily and weekly high and low

Ebb N Flo Trend [Signals]Ebb n Flo Trend is a trend indicator that makes use of higher time frame High - Low pivots to determine when a trend has changed
In order to reduce over trading, and to reduce fake outs, the script relies on a clever combination of Fib ratio expansions and an averaged candle close
By combining the above strategies, the trend indicator forms a trailing trend indicator
The script determines when the current market condition has crossed over or under the trailing trend, and based on the closing conditions will change the trend of the script signaling a change. If the trend indicator is below the current market and green, the trend is bullish. If the trend is above the market and red, the trend is bearish
The indicator does not repaint, as such, once a signal has been received, the condition has been met on a previous candle and is final
Trend indicator can be used on any markets, for both Long and Short swings, however is best suited for long term trading on certain crypto markets (based on backtesting results). Be on the lookout for pairs with decent volume on reputable exchanges. It is not a holy grail type script for all markets. The key is to find enough to diversify your trades.
As can be seen in the backtester results, the script performs exceptionally well when trading using the 1W higher time frame (selection in the script settings), in the 1D current time frame (selecting the chart time frame)
The script is ideal for the beginner trader that cannot spend hours everyday looking at charts.
The backtesting results are based on allocating 10% of your portfolio to a single trade - this should be determined by your risk appetite.
There are risks associated with any form of investing. Never invest more than you are willing to lose. Past performance is not a guarantee or predictor of future performance. Do your own due diligence before making any investment decisions.
Configuration:
The dropdown in the script selects the time frame for Highs and Lows that the script must consider, and the chart time frame is the time frame of which closing conditions the script should use
Alerts:
The indicator comes with 2 off alerts: open_LONG and open_SHORT, which in itself is self explanatory, however, due to the slow trading nature of the script, alerts are generally not needed
Once you receive access to the trial version, you will also receive a link to a video that will show you exactly how to set up the script
Happy trading

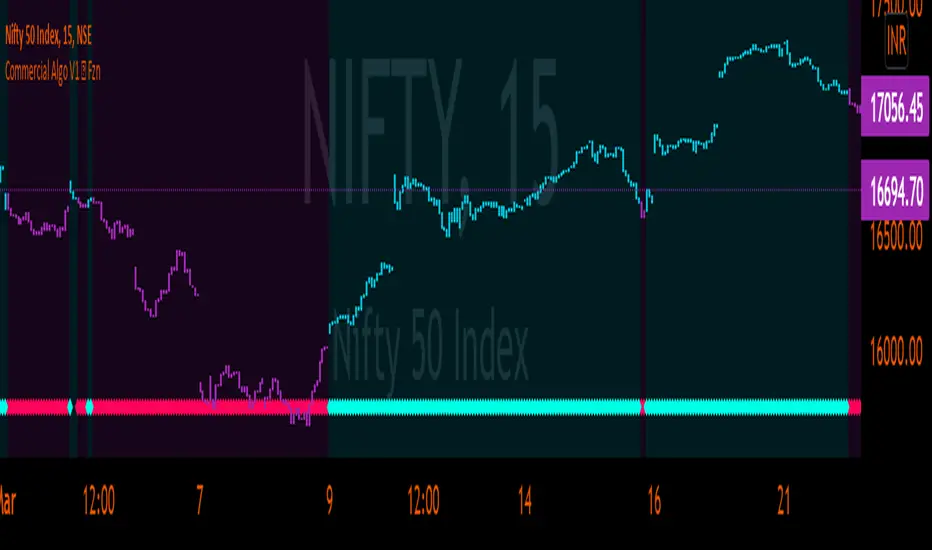
Commercial Algo Trend © Fzn V1Hello Traders,
Here i bring to you my 2nd Price Action Atr based Indictor combined with fib entry and exit trailing levels with minimum risk and maximum profit , as we must have seen at times as we enter the trend reverse and hits our stop losses . Keeping that in mind as i too struggled and made losses so i decided and focused more on minimizing the stop loss and only on confirmation of Long or Short trade is been initiated with proper Stop loss as explained in the images below , why should we give market our money ;) as we are here to make money :D .. There is no holy grail as Stop loss wont be hit but yes it will be way less and all alerts are based on candle close . One can use this on any chart and any timeframe and its very good for scalping too .ATR Trailing SL is added too just incase you want to enter and exit trend manually . Better results are on 15m and above . Hope you guys will like it and comment if you have any doubts..
-----------------
Disclaimer
Copyright by FaizanNawazz.
The information contained in my scripts/indicators/strategies/ideas does not constitute financial advice or a solicitation to buy or sell any securities of any type. I will not accept liability for any loss or damage, including without limitation any loss of profit, which may arise directly or indirectly from the use of or reliance on such information.
All investments involve risk, and the past performance of a security, industry, sector, market, financial product, trading strategy, or individual’s trading does not guarantee future results or returns. Investors are fully responsible for any investment decisions they make. Such decisions should be based solely on an evaluation of their financial circumstances, investment objectives, risk tolerance, and liquidity needs.
My scripts/indicators are only for educational purposes!
Happy Trading!
Maddrix_club I - Scalper (3commas)Maddrix club I Scalper (3commas version). The code is very different from the ALERTATRON version.
It really is not the same!
Maddrix Club I is a simple, straightforward trading algorithm that goes long or short, based on user’s choice. It is considered to be a scalper, because it aims to capture small profits that accumulates and compound over time.
The theory behind it is based on trend following and DCA .
Strategy type one uses momentum to generate signals.
Strategy type two uses price action only
Very good results have been observed on the 1 min time frame though it technically works on all timeframe (5 min for example, 1 hour also). The most important part of this algorithm is risk management and capital preservation.
You can run this with very little capital, and always make sure that in the worst case scenario, meaning when the market goes against you and all your SO (Safety Orders) are filled, you are using less than your account balance.
If you are in a trending up phase on the weekly time frame, you can go long. If this is a definite trend down, of course go short. During a bear market, stay long, during a bull market, evidently long as well.
For totally new traders, I would recommend to LONG only, and set super low risk settings (cover a 50% drop for example), and see how it runs. Then, as you become a more experienced trader, you can identify trends and short as well, and/or increase your risk.
It works on all markets as long as there is volatility .
The best way to go about changing the settings, is to start off the default values. I’d run it and see how it fits your risk preferences.
There are absolutely no guarantees about this algorithm and past results are not indicative of future performance.
Fees, slippage and API delay: for any algorithm you will use (from me or others), please keep in mind that fees add up, slippage and delay creates differences between algo theory and reality. We can put in place systems to circumvent that, but we will always have them.
*** This one is SPECIAL 3COMMAS**

Level 1 - Learn to code simply - PineScriptThe goal of this script is honestly to help everyone learn about trading with bots and algos.
At least, to get started.
Level 1:
10 lines of code.
learn to plot 2 moving averages on your chart.
learn to create a signal from a crossover.
learn the very basics of Pine Script algo.

Responsive Magnetic Moving Average - BreatEasyTraders,
It's pretty difficult to judge which moving average is holding the price at present (Holding = Prices Respecting the moving average). some times prices respects 20 MA, 50MA or some other MA or EMA or HMA. Its dynamic in nature and changes based on the script we apply and the timeframe we use.
Having all these different types of moving averages added on to chart may sometime create a clutter. Hence I came up with an idea to summarize into one value which price is respecting.
Important options provided to help adjusting the strength value.
1. No Of Candles = set the number of candles to analyze for the strength. Note: setting the value too less will improve the performance but accuracy is depleted. setting the value to too high may improve accuracy but performance may be depleted.
Performance = calculation time.
2. Close By% = in order to check whether price is respecting the trendline set the % of ATR. This means that when prices are close to any of the moving averages then it checks for the strength of the moving average.
Plz do suggest for any feedback for improvements.
Regards

Market Rhythm Trading Algo with Super SignalsThe Market Rhythm trading algo is designed using many different confluence data points that gives you a virtually unlimited combination of settings to manage risk on any given underlying asset. Designed with flexibility in mind, Market Rhythm can be used on futures, stocks, options, and even crypto.
The current settings are what give you the most buy and sell signals. Be sure to change the 'Rate of Change' source to something like hl2 instead of close where it's set to get even more signals.
How to Use:
Regular vs Super - Market Rhythm includes a set of regular signals, which are given on many price bars. Super signals are a combination of regular signals based on a length of bars you set. This is an effective way to clean up the chart and give more reliable buy and sell signals.
The idea behind so many points of confluence is to give you many different ways to filter out the signals you don't want to trade, or just don't like trading. With built in filters using rate of change, rsi, and chop index, you can customize the feel of your signals based on your risk. You can even use the Settings1 and Settings2 and ADX to separate your risk management into 2 different market conditions. For lower ADX settings you can manage risk much tighter for choppier, less trending markets. For higher ADX settings you will be able to set your risk management based on stronger trends.
The Adaptive Average included also changes based on Settings1/2 to give you a better idea of changing market conditions.
The Moving Average Ribbon can be used to temper your decisions for entering or exiting a trade. For instance, if you receive a red (sell signal) during a strong up trend, and the Adaptive Average is green, and the MA Ribbon is all green, then you have a pretty good idea of whether or not its safe to stay in the trade or go ahead and take profit.
Depending on your favorite time frame, Market Rhythm can be used for intraday scalping, as well as, daily swing trading. Not sure if your favorite discord pump stock is ready to go up? Check it against Market Rhythm and you'll have a much better idea of whether it's still going up or if you've missed the move. Trade safer and happier with Market Rhythm.
The small green triangles are 'regular buy signals' and the larger green triangles are 'super buy signals'.
The small red triangles are 'regular sell signals' and the larger red triangles are 'super sell signals'.
Use this indicator against your levels or main strategy for maximum effectiveness.
Limitations:
This script does not mark reversals. It will only identify safe trade zones during periods of strong momentum.
Disclaimer:
The information contained in my scripts/indicators/ideas does not constitute financial advice or a solicitation to buy or sell any securities of any type. I will not accept liability for any loss or damage, including without limitation any loss of profit, which may arise directly or indirectly from the use of or reliance on such information.
All investments involve risk, and the past performance of a security, industry, sector, market, financial product, trading strategy, or individual’s trading does not guarantee future results or returns. Investors are fully responsible for any investment decisions they make. Such decisions should be based solely on an evaluation of their financial circumstances, investment objectives, risk tolerance, and liquidity needs.
My scripts/indicators/strategies/ideas are only for educational purposes!
