Adaptive Machine Learning Trading System [PhenLabs]📊Adaptive ML Trading System
Version: PineScript™v6
📌Description
The Adaptive ML Trading System is a sophisticated machine learning indicator that combines ensemble modeling with advanced technical analysis. This system uses XGBoost, Random Forest, and Neural Network algorithms to generate high-confidence trading signals while incorporating robust risk management features. Traders benefit from objective, data-driven decision-making that adapts to changing market conditions.
🚀Points of Innovation
• Machine Learning Ensemble - Three integrated models (XGBoost, Random Forest, Neural Network)
• Confidence-Based Trading - Only executes trades when ML confidence exceeds threshold
• Dynamic Risk Management - ATR-based stop loss and max drawdown protection
• Adaptive Position Sizing - Volatility-adjusted position sizing with confidence weighting
• Real-Time Performance Metrics - Live tracking of win rate, Sharpe ratio, and performance
• Multi-Timeframe Feature Analysis - Adaptive lookback periods for different market regimes
🔧Core Components
• ML Ensemble Engine - Weighted combination of XGBoost, Random Forest, and Neural Network outputs
• Feature Normalization System - Advanced preprocessing with custom tanh/sigmoid activation
• Risk Management Module - Dynamic position sizing and drawdown protection
• Performance Dashboard - Real-time metrics and risk status monitoring
• Alert System - Comprehensive alert conditions for entries, exits, and risk events
🔥Key Features
• High-confidence ML signals with customizable confidence thresholds
• Multiple trading modes (Conservative, Balanced, Aggressive) for different risk profiles
• Integrated stop loss and risk management with ATR-based calculations
• Real-time performance metrics including win rate and Sharpe ratio
• Comprehensive alert system with entry, exit, and risk management notifications
• Visual confidence bands and threshold indicators for easy signal interpretation
🎨Visualization
• ML Signal Line - Primary signal output ranging from -1 to +1
• Confidence Bands - Visual representation of model confidence levels
• Threshold Lines - Customizable buy/sell threshold levels
• Position Histogram - Current market position visualization
• Performance Tables - Real-time metrics display in customizable positions
📖Usage Guidelines
Model Configuration
• Confidence Threshold: Default 0.55, Range 0.5-0.95 - Minimum confidence for signals
• Model Sensitivity: Default 0.9, Range 0.1-2.0 - Adjusts signal sensitivity
• Ensemble Mode: Conservative/Balanced/Aggressive - Trading style preference
• Signal Threshold: Default 0.55, Range 0.3-0.9 - ML signal threshold for entries
Risk Management
• Position Size %: Default 10%, Range 1-50% - Portfolio percentage per trade
• Max Drawdown %: Default 15%, Range 5-30% - Maximum allowed drawdown
• Stop Loss ATR: Default 2.0, Range 0.5-5.0 - Stop loss in ATR multiples
• Dynamic Sizing: Default true - Volatility-based position adjustment
Display Settings
• Show Signals: Default true - Display entry/exit signals
• Show Threshold Signals: Default true - Display ±0.6 threshold crosses
• Show Confidence Bands: Default true - Display ML confidence levels
• Performance Dashboard: Default true - Show metrics table
✅Best Use Cases
• Swing trading with 1-5 day holding periods
• Trend-following strategies in established trends
• Volatility breakout trading during high-confidence periods
• Risk-adjusted position sizing for portfolio management
• Multi-timeframe confirmation for existing strategies
⚠️Limitations
• Requires sufficient historical data for accurate ML predictions
• May experience low confidence periods in choppy markets
• Performance varies across different asset classes and timeframes
• Not suitable for very short-term scalping strategies
• Requires understanding of basic risk management principles
💡What Makes This Unique
• True machine learning ensemble with multiple model types
• Confidence-based trading rather than simple signal generation
• Integrated risk management with dynamic position sizing
• Real-time performance tracking and metrics
• Adaptive parameters that adjust to market conditions
🔬How It Works
Feature Calculation: Computes 20+ technical features from price/volume data
Feature Normalization: Applies custom normalization for ML compatibility
Ensemble Prediction: Combines XGBoost, Random Forest, and Neural Network outputs
Signal Generation: Produces confidence-weighted trading signals
Risk Management: Applies position sizing and stop loss rules
Execution: Generates alerts and visual signals based on thresholds
💡Note:
This indicator works best on daily and 4-hour timeframes for most assets. Ensure you understand the risk management settings before live trading. The system includes automatic risk-off modes that halt trading during excessive drawdown periods.
Algorithmictrading

Cumulative Intraday Volume with Long/Short LabelsThis indicator calculates a running total of volume for each trading day, then shows on the price chart when that total crosses levels you choose. Every day at 6:00 PM Eastern Time, the total goes back to zero so it always reflects only the current day’s activity. From that moment on, each time a new candle appears the indicator looks at whether the candle closed higher than it opened or lower. If it closed higher, the candle’s volume is added to the running total; if it closed lower, the same volume amount is subtracted. As a result, the total becomes positive when buyers have dominated so far today and negative when sellers have dominated.
Because futures markets close at 6 PM ET, the running total resets exactly then, mirroring the way most intraday traders think in terms of a single session. Throughout the day, you will see this running total move up or down according to whether more volume is happening on green or red candles. Once the total goes above a number you specify (for example, one hundred thousand contracts), the indicator will place a small “Long” label at that candle on the main price chart to let you know buying pressure has reached that level. Similarly, once the total goes below a negative number you choose (for example, minus one hundred thousand), a “Short” label will appear at that candle to signal that selling pressure has reached your chosen threshold. You can set these threshold numbers to whatever makes sense for your trading style or the market you follow.
Because raw volume alone never turns negative, this design uses candle direction as a sign. Green candles (where the close is higher than the open) add volume, and red candles (where the close is lower than the open) subtract volume. Summing those signed volume values tells you in a single number whether buying or selling has been stronger so far today. That number resets every evening, so it does not carry over any buying or selling from previous sessions.
Once you have this indicator on your chart, you simply watch the “summed volume” line as it moves throughout the day. If it climbs past your long threshold, you know buyers are firmly in control and a long entry might make sense. If it falls past your short threshold, you know sellers are firmly in control and a short entry might make sense. In quieter markets or times of low volume, you might use a smaller threshold so that even modest buying or selling pressure will trigger a label. During very active periods, a larger threshold will prevent too many signals when volume spikes frequently.
This approach is straightforward but can be surprisingly powerful. It does not rely on complex formulas or hidden statistical measures. Instead, it simply adds and subtracts daily volume based on candle color, then alerts you when that total reaches levels you care about. Over several years of historical testing, this formula has shown an ability to highlight moments when intraday sentiment shifts decisively from buyers to sellers or vice versa. Because the indicator resets every day at 6 PM, it always reflects only today’s sentiment and remains easy to interpret without carrying over past data. You can use it on any intraday timeframe, but it works especially well on five-minute or fifteen-minute charts for futures contracts.
If you want a clear gauge of whether buyers or sellers are dominating in real time, and you prefer a rule-based method rather than a complex model, this indicator gives you exactly that. It shows net buying or selling pressure at a glance, resets each session like most intraday traders do, and marks the moments when that pressure crosses the levels you decide are important. By combining a daily reset with signed volume, you get a single number that tells you precisely what the crowd is doing at any given moment, without any of the guesswork or hidden calculations that more complicated indicators often carry.

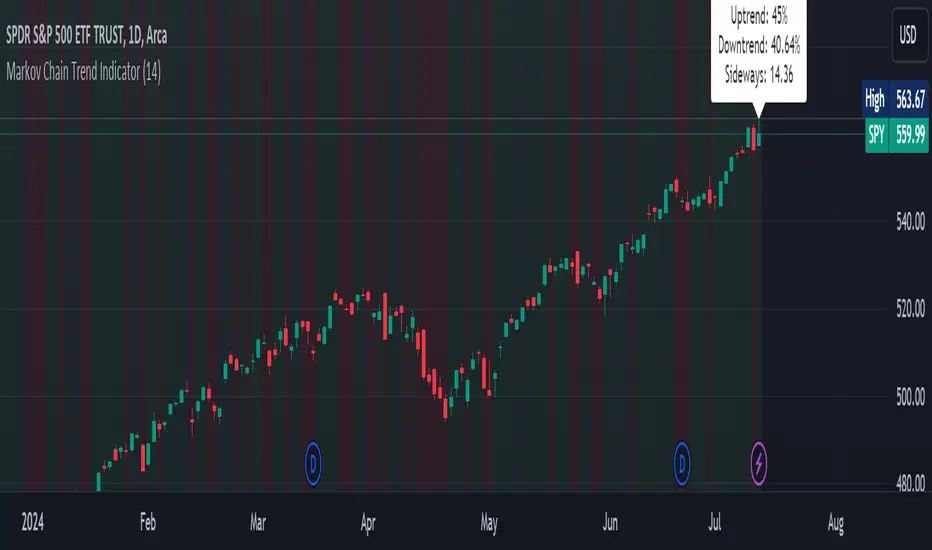
Markov Chain Trend IndicatorOverview
The Markov Chain Trend Indicator utilizes the principles of Markov Chain processes to analyze stock price movements and predict future trends. By calculating the probabilities of transitioning between different market states (Uptrend, Downtrend, and Sideways), this indicator provides traders with valuable insights into market dynamics.
Key Features
State Identification: Differentiates between Uptrend, Downtrend, and Sideways states based on price movements.
Transition Probability Calculation: Calculates the probability of transitioning from one state to another using historical data.
Real-time Dashboard: Displays the probabilities of each state on the chart, helping traders make informed decisions.
Background Color Coding: Visually represents the current market state with background colors for easy interpretation.
Concepts Underlying the Calculations
Markov Chains: A stochastic process where the probability of moving to the next state depends only on the current state, not on the sequence of events that preceded it.
Logarithmic Returns: Used to normalize price changes and identify states based on significant movements.
Transition Matrices: Utilized to store and calculate the probabilities of moving from one state to another.
How It Works
The indicator first calculates the logarithmic returns of the stock price to identify significant movements. Based on these returns, it determines the current state (Uptrend, Downtrend, or Sideways). It then updates the transition matrices to keep track of how often the price moves from one state to another. Using these matrices, the indicator calculates the probabilities of transitioning to each state and displays this information on the chart.
How Traders Can Use It
Traders can use the Markov Chain Trend Indicator to:
Identify Market Trends: Quickly determine if the market is in an uptrend, downtrend, or sideways state.
Predict Future Movements: Use the transition probabilities to forecast potential market movements and make informed trading decisions.
Enhance Trading Strategies: Combine with other technical indicators to refine entry and exit points based on predicted trends.
Example Usage Instructions
Add the Markov Chain Trend Indicator to your TradingView chart.
Observe the background color to quickly identify the current market state:
Green for Uptrend, Red for Downtrend, Gray for Sideways
Check the dashboard label to see the probabilities of transitioning to each state.
Use these probabilities to anticipate market movements and adjust your trading strategy accordingly.
Combine the indicator with other technical analysis tools for more robust decision-making.
Hybrid EMA AlgoLearner⭕️Innovative trading indicator that utilizes a k-NN-inspired algorithmic approach alongside traditional Exponential Moving Averages (EMAs) for more nuanced analysis. While the algorithm doesn't actually employ machine learning techniques, it mimics the logic of the k-Nearest Neighbors (k-NN) methodology. The script takes into account the closest 'k' distances between a short-term and long-term EMA to create a weighted short-term EMA. This combination of rule-based logic and EMA technicals offers traders a more sophisticated tool for market analysis.
⭕️Foundational EMAs: The script kicks off by generating a 50-period short-term EMA and a 200-period long-term EMA. These EMAs serve a dual purpose: they provide the basic trend-following capability familiar to most traders, akin to the classic EMA 50 and EMA 200, and set the stage for more intricate calculations to follow.
⭕️k-NN Integration: The indicator distinguishes itself by introducing k-NN (k-Nearest Neighbors) logic into the mix. This machine learning technique scans prior market data to find the closest 'neighbors' or distances between the two EMAs. The 'k' closest distances are then picked for further analysis, thus imbuing the indicator with an added layer of data-driven context.
⭕️Algorithmic Weighting: After the k closest distances are identified, they are utilized to compute a weighted EMA. Each of the k closest short-term EMA values is weighted by its associated distance. These weighted values are summed up and normalized by the sum of all chosen distances. The result is a weighted short-term EMA that packs more nuanced information than a simple EMA would.
