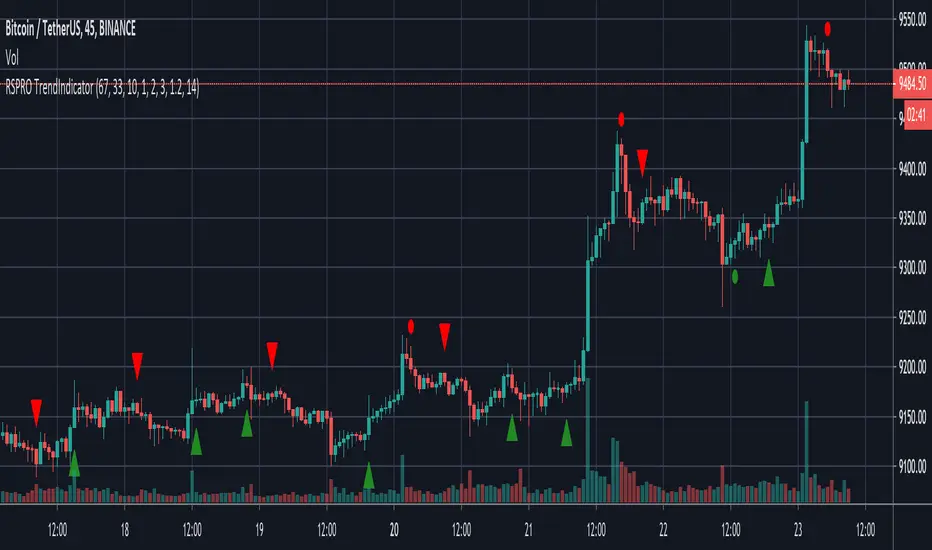
RSPRO TrendIndicatorBased on resistance/support and bollinger band fluctuations this indicator also has filter with x bars after RSI overbought/oversell zones from settings.
Indicator has alerts for LONG(BUY)/SHORT(SELL) signals with green/red squares/triangles. You can setup alerts to use different types of entries.
There are two types of entries and signals: early (usually before trend changes) and main (when trend started to reverse)
Fits for BTC and any altcoins. And any assets. Good for both scalping and position trading (depends on timeframe that you use)
Best use it with big timeframes: 45 and 90min, 2 and 4 hours for position trading.
For scalping 5-30min timeframes are good too.
In Script settings you can specify:
1) RSI period, 14 by default.
2) Show early entries (squares), enabled by defaults.
3) Show main entries (triangles), enabled by defaults.
4) Enable/Disable filter to show main entries only after RSI overbought/oversell regions
Disabled by defaults and RSI is 67 for upper zone and 33 for lower zone.
You can also specify how many bars back before current bar this filter must do. It's 10 by default, you can vary it up to 90.
You can also use only early entries (squares)
Or only main entries (triangles)
Or both (by defaults and i recommend)
This is invite only script. PM me if you want to test it.
Alerts
Cyatophilum Levels [ALERTSETUP]Cyatophilum Levels - Version 1.0 - Alert setup
This indicator allows you to build your own strategy based on Fibonacci levels, and create automated alerts for long & short entries and exits.
This study also has a backtest version. See my previous script.
The Fibonacci levels are printed automatically in real time and without repainting on the chart.
You configure your own strategy in the indicator parameters. You can choose to go long or to go short, or both, on which Fib levels to enter Long/Short, and on which Fib levels to exit (up to 2 entry levels and exit levels).
Detailed Guide:
This is a guide that can be useful if you do not understand the strategy or an indicator parameter. Instructions on how to get access are at the bottom.
To configure your strategy, you need to open the indicator settings. You can either right-click on the indicator and click "settings", or click the settings button near the indicator's name.
You should know that the Fibonnaci levels are calculated from the support and resistance levels, which are calculated using the last swing high and swing low. This behavior can be tweaked in the settings with the first 2 parameters:
· Noise reduction
Dropdown menu. Options are "NONE", "SMALL", "MEDIUM", "HUGE". Used to get a smoother level behavior. The higher it is, the less often the support and resistance levels will move. Can be useful to cut off fakeouts.
· Swings lookback
This is the number of historical bars used to calculate the last swing high and swing low.
In TradingView, we usually wait bar close to validate a signal (trade entry or exit), in order to avoid repainting. But since this indicator is purely based on price action, there is an option called Alert Type if you want to receive intra-bar alerts or not.
· Entry Alert Type
2 options : "Once Per Bar Close", "Once Per Bar". These correspond to the alerts options. You must use the same alert type in the indicator settings and in the alert options. When using "Once Per Bar", the candle high and low are used for the cross conditions, otherwise, candle close is used.
· Exit Alert Type
Same but for exit alerts.
The long trades setup can be configured independantly from the short trade setup, but the parameters are the same.
■ Go Long/Short
Check this box to enable/disable long/short trades.
· Long/Short Entry Condition
Dropdown menu from which you can pick the condition for your entry. Options available are "Cross Over","Cross Under" and "Just Cross".
· Long/Short Entry 1
Dropdown menu from which you can pick the level for your entry n°1. Options available are "Support","FIB 23", "FIB 38", "FIB 50","FIB 61","FIB 78" and "Resistance".
· Long/Short Entry 2
Additional FIB level entry.
· Long/Short Exit 1
Dropdown menu from which you can pick the level for your exit. Options available are "Support","FIB 23", "FIB 38", "FIB 50","FIB 61","FIB 78" and "Resistance".
· Long/Short Exit 2
Additional FIB level exit.
■ Trend Filter
Optionnal Tilson T3 TrendLine to make the strategy go long only when price is above T3 (green) and short only when price is below (red). The length in bars is configurable.
· Configuration Panel
It should appear on the left of the chart. This panel displays the whole indicator settings in a compact and easy-to-read way. You can replicate a strategy from just this info panel. Can be turned off if needed.
· Graphic options
A red/green background corresponding to the strategy position (short/long) can be turned off.
The Fib levels labels can be turned off all at once.
Risk management:
Place your secondary exit one or two levels above/below your entry to act as a stop loss.
Availabe alerts:
To create an alert, right-click on the indicator and click "Add alert".
The LONG alerts corresponds to the green labels on chart, while the SHORT are in red.
Select one of the following signals in order to create your strategy:
· LONG/SHORT ENTRY : Alert to enter a long/short. Make sure to select "Once Per Bar" or "Once Per Bar Close" according to the "Entry Alert Type" parameter.
· LONG/SHORT EXIT : Alert to exit a long/short. Make sure to select "Once Per Bar" or "Once Per Bar Close" according to the "Exit Alert Type" parameter.
Default settings are set for 15m.
Use the link below to obtain access to this indicator

HFT Momentum IndicatorDefault Settings are meant to be used in XBT/USD chart on 1 hour time frame. If you want to use for another asset on another time frame YOU MUST CHANGE THE SETTINGS
This is momentum-based strategy designed by HFT Research in order to take advantage of volatile, trending markets.
Use ADX
ADX stands for average directional index . It is an indicator that measures volatility in the market. Unfortunately, the worst market condition for this strategy is sideways market. ADX becomes a useful tool since it can detect trend. If the volatility is low and there is no real price movement, ADX will pick that up and will not let you get in trades during a sideways market. It will allow you to enter trades only when the market is trending.
Use MA CrossOver
This strategy’s main driver is the moving average cross over however, unlike many other indicators, this strategy has ALL the moving averages that are on trading view. Total of 13 different moving averages all calculated in a different fashion available in a drop-down menu. You are able to choose two different moving averages to cross for your entry as well as being able to adjust the length of each individual moving average.
Use MA Spread % Filter
As an extra protection, we introduced MA spread % filter. We all know that momentum strategy works when there is actually a trend that has momentum. When there is no trend and market side choppy, we get a lot of noisy signals. In order to battle that we have introduced MA spread % filter. Using this piece of setting, you will be able to chose how strong the cross over actually is. If price is moving sideways, the moving averages will cross each other barely. If the price has actually any steam and momentum, MA 1 will cross over MA 2 aggressively because it will be trending market.
First you chose what the minimum % difference there should be between your 2 moving averages. If you keep this too tight, it won’t be as useful and if you keep this too large then the script will not generate any signals. Trust us, there is a fine balance in between! Then you proceed to chose your moving averages that the bot should keep track of.
Check our website for more information.

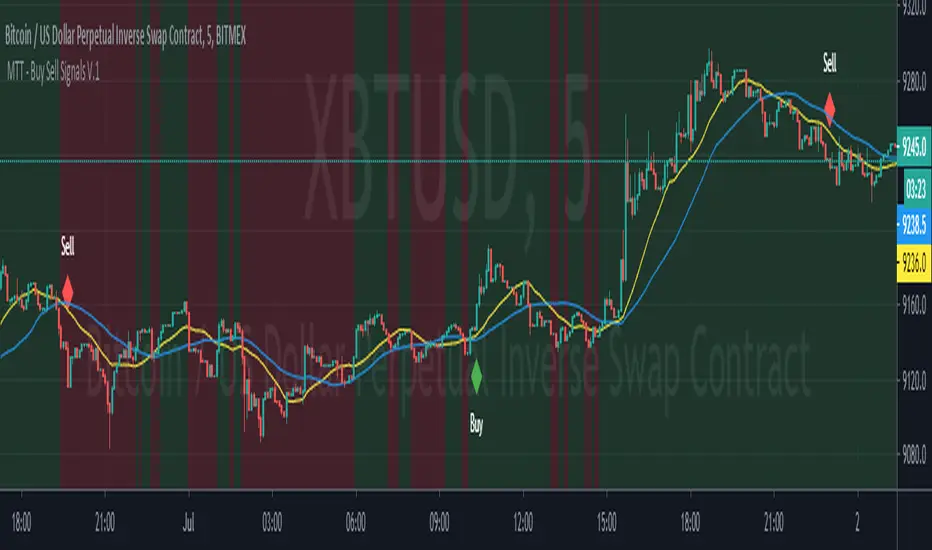
Market Trading Tools - Buy Sell SystemOur Buy Sell System indicator generally works on a modified version of the ATR ( Average True Range ) formula. The Buy Sell System is a trading method that generates Buy and Sell signals when conditions are met. These conditions include Exponential Moving Averages, ATR and depends on price action as well. Our indicator also shows a green/red background that indicates the trend on a chosen time frame.
** Our Indicator does not repaint.
** It can be used on any financial market; crypto, stocks or forex. We also encourage using time frames as the 15 minutes and above. The use of a higher than 4hr time frame requires special settings and once you have access to it, you can change the parameters as you want. We have enabled our users to freely use the settings as they wish and to their on discretionary.
Once you are granted access to use it, add it from going into the scripts >> invite only scripts >> enable the indicator. Once the indicator is added to your chart you will see the indicator popping up on your chart.
We are happy to announce that our trading indicator is special and unique from different ones because it firstly eliminates noise coming out from an average ATR indicator. We believe we are providing a service second to none and we are happy with our product.We believe that we have not seen a similar indicator, and we are proud of our work and we will continue updating the indicator when we believe it is necessary according to market changes. We have also enabled a function for our users to get a better view of the trend when they add the indicator to their chart. You can now view the trend background color (red&green) depending on if the price is above the EMA of your choice. you can also check whichever time interval you want that does not limit you to the time interval chosen on your chart itself.
Hope you enjoy it, Good luck and stay safe!
** If you are interested in this indicator. please use the link below to obtain access to this indicator
HFT Scalper IndicatorThis strategy is a scalper strategy developed by HFT Research. Scalper is highly customizable and provides endless opportunities to find profitable setups in the market.
Use Bollinger Bands
This piece of the settings will turn and off Bollinger band’s input in the decision making. BB Length will determine the Moving average you are using to take the standard deviation off of which is named as BB Multiplier. Default settings will use 20 moving average and take standard deviation of 2 to create lower and upper bands. Increasing the Multiplier will give you fewer but safer entries.
Use Bollinger Bands %
This setting will allow the user to determine at what Bollinger band width %, he wants to take start looking to take trades. It is known that when prices are stable and moving sideways, Bollinger bands contract and it becomes more reactive to small moves in the market. Using this setting, you can ignore the signals that would be generated while Bollinger bands are contracted. This setting will allow the user to weed out the noise in the market and really allow them to make the most out of Bollinger bands.
Use RSI
You can also turn on and off the RSI as well. Alternatively, there is an option to use RSI on a different time frame than you are currently on. For example, if you are looking at the 5min chart to use Bollinger bands but you would like to look at the RSI value on the 15min chart. You can do so by selecting the custom RSI timeframe as well as adjusting the Oversold and Overbought value.
Use STOCH
For those who want extra protection on their entry can throw STOCH into their decision making. STOCH acts like RSI but it is more prone to small moves. It will help the users to get a better entry if used correctly. Stoch may not be in the buy zone when RSI is at say 35, however, if price dips a little more and STOCH might be in the buy zone when RSI is at say 20. This way it will help you have better entries than just using RSI. In a way, you can use STOCH to scalp RSI.
Use VWAP
VWAP stands for volume weighted average price. It is an extremely useful indicator when trading intra-day. It does reset every trading session which is at 00:00 UTC. Instead of looking at x number of candles and providing an average price, it will take into consideration volume that’s traded at a certain price and weigh it accordingly.
Use ADX
ADX stands for average directional index. It is an indicator that measures volatility in the market. Unfortunately, the worst market condition for this strategy is sideways market. ADX becomes a useful tool since it can detect trend. If the volatility is low and there is no real price movement, ADX will pick that up and will not let you get in trades during a sideways market. It will allow you to enter trades only when the market is trending.
Use MA Filters
Lookback: It is an option to look back x number of candles to validate the price crossing. If the market is choppy and the price keeps crossing up and down the moving average you have chosen, it will generate a lot of “noisy” signals. This option allows you to confirm the cross by selecting how many candles the price needs to stay above or below the moving average. Setting it 0 will turn it off.
MA Filter Type: There is a selection of moving averages that is available on TradingView currently. You can choose from 14 different moving average types to detect the trend as accurate as possible.
Filter Length: You can select the length of your moving average. Most commonly used length being 50,100 and 200.
Filter Type: This is our propriety smoothing method in order to make the moving averages lag less and influence the way they are calculated slightly. Type 1 being the normal calculation and type 2 being the secret sauce.
Reverse MA Filter: This option allows you to use the moving average in reverse. For example, the strategy will go long when the price is above the moving average. However, if you use the reserve MA Filter, you will go short when the price is above the moving average. This method works best in sideways market where price usually retraces back to the moving average. So in an anticipation of price reverting back to the moving average, it is a useful piece of option to use during sideway markets which is the worst market condition for scalper.
Please visit our website for more information

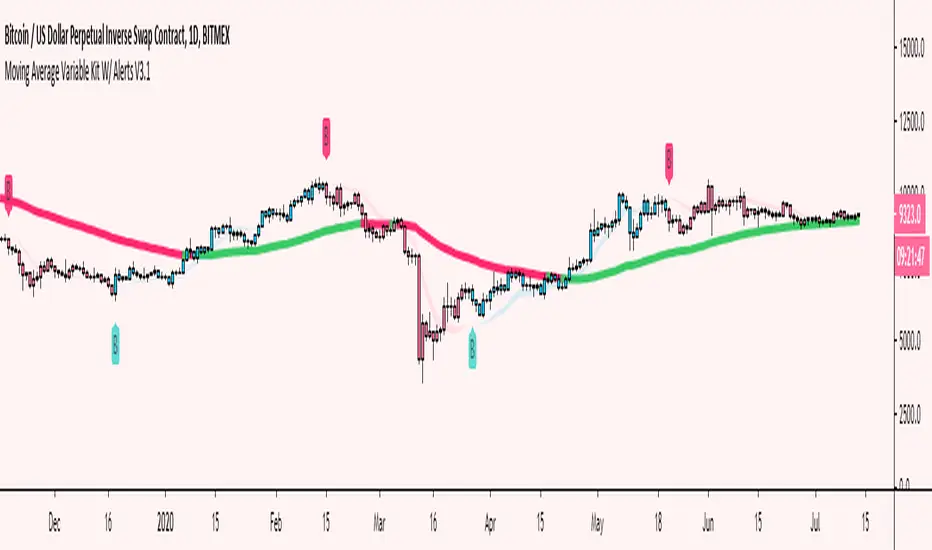
Moving Average Variable Kit W/ Alerts V3 [Moon]Create your own MA system
5 basic kinds of Moving Average types available for now
DEMA
EMA
SMA
TEMA
WMA
Mix and match moving average types and lengths.
Create your own alerts built into Tradingview.
Turn alerts or MAs off or on with 1 click.
Choose visual transparency and alert coloration - everything is customizable.
Trend candles on crossovers.
Choose your MA input source.
Create your own MA cloud or cloud ribbons.
Trend MA coloration on candle or bar interactions.
It really empowers you to experiment and create your own trading system or strategy.
Don't be afraid to use Renko or Heikin Ashi for trend spotting or reversals.
Copy built in exchange bands or indicators for an edge up on the competition or exchange users (these are heavily watched and in my opinion do affect the price action especially on smaller coins like alts).
This is Binance's default kit that you can easily make (7/25/99) SMAs.
Works well on traditional markets or Forex | Should be cross compatible on any asset or timeframe.
Turn off a majority of signals except for "buy" or "sell" alerts. Use these clusters to DCA, short, long or take profit.
Use it to monitor classic "Golden" or "Death" crosses - Set a TV alert to get a notification when it official goes off.
These are just a few of the things you can create. I encourage you to explore further.
Send me a DM if interested.
Vertical Horizontal Moving Average [AneoPsy & alexgrover] Moving average adapting to the strength of the trend, this is made possible by using the square of the vertical-horizontal filter as a smoothing factor. Alerts are included with two different types of conditions available to the user.
Settings
Length : Period of the moving average
Src : Input data for the indicator
Alerts : Types of conditions to be used in the alerts, when set to "VHMA Direction Change" alerts are triggered once the VHMA is either rising or declining, else the alerts are based on the crosses between Src and the VHMA
Usage
The VHMA can be used as a fast or slow-moving average in a moving average crossover system, or as input for other indicators.
VHMA of with length = 25 and sma with length = 200.
VHMA with length = 25 used as input for the RSI with length = 14.
Details
The vertical-horizontal filter is a measure of the strength of the trend and lay in a (0,1) range, to calculate it you just need to divide the rolling range over with the rolling sum of the absolute price changes, squaring the result allow to get lower results with higher values of length .
Squared vertical horizontal filter with length = 50, the value is low when the market is ranging and high when trending.
To set the alerts go in the alert panel, click on create alert, and select VHMA in "condition", choose between the buy or sell alert. If Src = closing price or another indicator dependant on the closing price select in options "once per bar close", if the indicator using the opening or lagged closing prices values as input select "One per bar" instead.
Thanks
Thanks to AneoPsy for adding the color change, the idea to use two kinds of conditions for the alert, and for its feedback, you can follow him
www.tradingview.com
and finally thanks to you for reading and for your support, only one last script left for the month, then we'll start July with some pretty interesting indicators, I hope you'll like them ^^/

ck - EMA Cross with AlertsDisplays 5 popular EMAs (you can hide any you don’t want to see from the “Styles” screen when editing the config).
Set the values for your EMAs by clicking the cog after adding this indicator to your chart.
A Long or Short signal is fired when EMA1 crosses EMA2 - a cross up is a Long signal, a cross down is a Short signal.
Connect to your Bots (3commas / 3C.exchange recommended) to automate buys and sells!

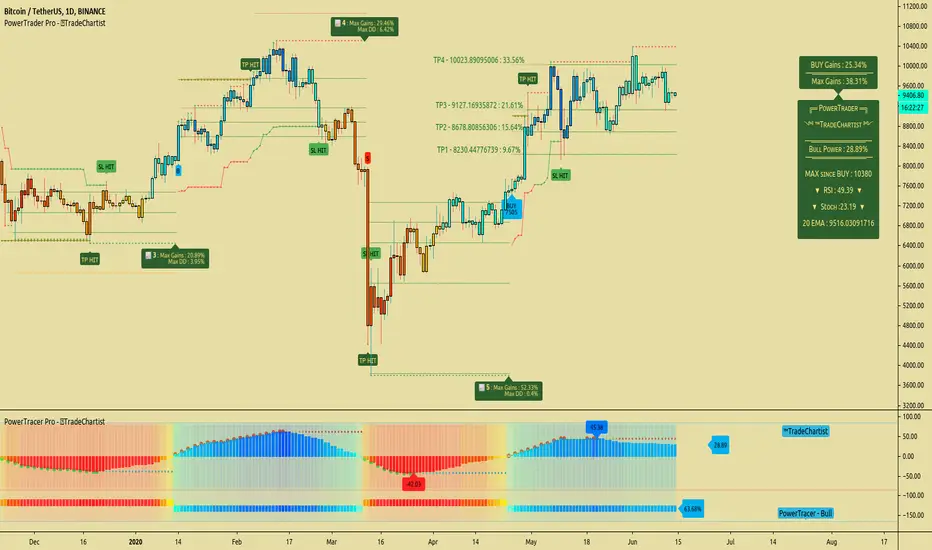
TradeChartist PowerTrader ProTradeChartist PowerTrader Pro is a versatile Signal generator and Signal plotter on the main price chart based on signals from other compatible scripts like TradeChartist PowerTracer Pro . This elegantly designed script plots the following based on user preference.
BUY and SELL signals based on external compatible signal source
Automatic Targets if opted from settings
Trailing or Fixed Stop Loss based on user input
Take Profit % and Quantity to trade based on user input
PowerTrader Dashboard displaying 14 period RSI, Stoch and 20 EMA
Real-Time Gains Tracker displaying Max Gains and open PnL
Past Performance labels displaying Max Gains and Max Drawdown for each trade
Higher Highs since BUY and Lower Lows since SELL
Once the external Signal is connected to the script, the results based on signal backtester ( TradeChartist PowerTracer Pro Backtester ) can be used to optimise the settings to generate plots and also to set Alerts for the following.
Long and Short Signals
Long and Short Stop Loss Hit
Long and Short TP Hit
Move up/down Trailing SL
To create alerts, the user must choose PowerTrader Pro from the alert condition drop-down and choose the required alert. Since the signals are generated only after confirmation, "Once per bar" must be used for Alerts.
===================================================================================================================
This is not a free to use indicator. Get in touch with me (PM me directly if you would like trial access to test the indicator)
Premium Scripts - Trial access and Information
Trial access offered on all Premium scripts.
PM me directly to request trial access to the scripts or for more information.
===================================================================================================================
PROFIT+ V3 ALERTThis is an alert indicator for PROFIT+ V3 strategy .
Add it to your chart with the strategy and create alerts to
receive notifications when Buy and Sell signals are generated.
To receive access for the strategy and this indicator, please pm me or contact
me at telegram from the link below.
----------------------------------------------------------------------------
Это алерт индикатор к стратегии PROFIT+ V3 .
Используйте индикатор со стратегией и создавайте алерты
для получения уведомлений когда генерируются сигналы
на покупку и продажу.
Для получения доступа к стратегии и к данному индикатору,
пожалуйста, напишите мне в лс или в телеграм через ссылку ниже.

Trend Follow with kijun-sen/tenkan sen for 1 Hour SPX
This script determines, plots and alerts on probable trend initiation and continuation points, using tenkan-sen(conversion line of ichimoku), kijun-sen(baseline of ichimoku) and stochastic RSI, for 1 H SPX.
New long/short trend initiates when prices cross above/below kijun sen. The trend continues when prices cross above/below tenkan-sen or stochastic RSI crosses up/down its signal line, while prices are above/below kijun-sen.
It is good to take partial profit between 10-15 points gain and trail the left with stops below kijun-sen line.
While placing the order, using 2-3 points buffer above/below of signal bars is recommended. Additionally, please be careful about clouds and do not place long/short orders below/above clouds.

BigBendFX Ichimoku Cloud | Cloud BreakoutCloud breakout is an enhancement of TradingView's built-in Ichimoku Cloud Indicator. By default, only the cloud is visible. The other Ichimoku lines can be toggled on if needed. This indicator focuses on the breakout of the Kumo cloud. An additional simple moving average filter can be added as well.
Breakout Condition
2 candlesticks are part of the breakout condition
Candlestick 1: 'open' price is still within the cloud and 'close' price breaks out of the cloud
Candlestick 2: 'open' price confirms that candlestick 1 'close' remains as a breakout
There are 4 possible breakout conditions: 2 bullish direction moves crossing each senkou span and 2 bearish direction moves crossing each senkou span
Note: ranging markets will cause false breakouts, so a moving average is integrated to help filter this out
Moving Average Integration
A simple moving average can easily be toggled on/off to filter out cloud breakout signals
The SMA length and color can be adjusted in the settings
Alerts
There are 2 alert options: bullish or bearish
Alerts will confirm if the Moving Average Integration is activated
To add to your chart simply search for the title "BigBendFX Ichimoku Cloud" in indicators & strategies.
If you would like any added features or functionalities, please comment/share below. Be sure to check out our website (link below)!
Thank you!

GOAT Signals - Real Time Baby! Custom Alert ScriptWELCOME to GOAT Signals - Real Time Baby! Custom No Repaint Buy Sell Moving Average (MA) Alert Script!
This script can be set to send GOAT Signals Custom Indicator Alerts.
The Step input gives price action some breathing space if desired. Steps can be added or subtracted.
The strategy tester does not calculate in trading fees, therefore in most cases will work better on longer time frames.
Personally, I use the Daily and Weekly charts except during high volatility , and use a one or two bar trail depending on price action.
Past performance does NOT guarantee future gains but keep in mind Bitcoin , Litecoin and a few others are on deflationary cycles.
Access included with GOAT Signals Custom No Repaint Buy Sell Arrow Strategy Tester.
For full invite only access please contact DogeyBlaze.
Not Certified Financial Advice.
RSI LookbackChecks RSI High/Low X candles in the past
Displays Green/Red circles at bottom of chart
Sends alerts

Alert Intervals and Delays Framework [BigBitsIO]Simply explained, this script, when modified to each specific use case, can allow you to specify that alert conditions are only checked every X seconds (AKA Intervals - as fast as every single second) and that alerts can not occur quicker than the user-specified delay (in seconds)
Explained:
- This will work on any resolution, but for the best results/fastest alerts a premium plan with 1s resolution will work best.
- Be mindful of which alert option you choose when setting up corresponding alerts. On 1s resolution with alerts once per bar you can get alerts up to every second.
- The scan for alerts every X seconds will be when the script can scan, by default every 5th second. If you want it to scan on any and all updates, set it to 1 for 1 second
- The delay between alerts will just require than that many seconds have passed since the last alert was fired (whether it was an actual alert in TradingView or just as recognized by this script)
- To have a custom alert condition met, do your normal indicator logic and check your conditions during the scanning period after the delay has been met, as marked by comments in the code
FAQ
- Why is this script useful?
- Many people do not want to constantly monitor for alerts, and may only want alerts to trigger at certain times, or after certain periods of time
- What is an example?
- You want a 1min resolution RSI alert, but you don't want to see it every minute, or only once.
- By setting your alert to once per bar, or once per minute on a 1min or less resolution chart you can get alerts only every 2min 30sec for example when setting your delay to 150 (seconds)
Warning: Since the scan time and alert times on larger resolutions can not be accessed from previous candles when first added to the chart it should be pretty important that you operate on a chart with a smaller resolution than your delay.

Vendredi's Daily SmashSpecial Thanks to Vendredi for helping me tweak and improve this indicator. It is now fully functional in TV to open both Long or Short Positions.
THIS INDICATOR WILL NOT WORK WITH DEFAULT C1, BASELINE, AND EXIT CONFIG. Think of it as a learning lesson. Put in a little effort to find proper config to use them :-D.
Long Entry Criteria
- Price must close above C1 indicator
- Price must remain above the C1 indicator in the current candle and be heading above the previous candle close
- Price must do the same as the two points above for the BASELINE indicator
- C2OPEN indicator criteria must be met for both the current candle and the previous closed candle (just like C1 indicator)
- Price must not be actively exceeding the upper bollinger band
- RSI must be above 70
- Closed candles are not limited to, but should absolutely apply to, C1, C2OPEN, and BASELINE
Short Entry Criteria
- Price must close below C1 indicator
- Price must remain below the C1 indicator in the current candle and be heading below the previous candle close
- Price must do the same as the two points above for the BASELINE indicator
- C2OPEN indicator criteria must be met for both the current candle and the previous closed candle (just like C1 indicator)
- Price must not be actively exceeding the upper bollinger band
- RSI must be below 30
- Closed candles are not limited to, but should absolutely apply to, C1, C2OPEN, V1 and BASELINE
Alert Config
- Select the Indicator and Select the VDS Buy or VDS Sell for Long or Short
The rest is up to you.
Excessive Munehisa Signals 2This script builds an EMA (Exponential Moving Average) on special price conditions using the following:
Averaged price if the current bar (c.=1/4(o.+c.+l.+c.)
Midpoint of the previous bar (o.=1/2(o. of prev. bar+ c. of prev. bar)
and
h.=max(h.,o.,c.)
l.=min(l.,o.,c.)
It gives alerts on price crossing the EMA (breakout/breakdown) and plots OUT and IN when the event occurs and the trigger is activated. Script works in real time.
It is used only in trending markets like bullish trends and/or bearish trends and never in flat. It can get very bad results so pay attention!
Feel free to test it and add comments.
I am open to answer any questions.
I would like to know what you think and how can we improve this study.
Thank you & enjoy!

Surf's Up Alerts 1.0Optimal Markets - USDT/ BTC -USD/ BTC all major exchanges
Optimal Chart - 4H
Average trades - 1-2/week
YTD Profit (0 leverage) = 62%
This script was designed to give new traders confidence and some guidance when entering into the crypto trading industry.
When added to the USD/ BTC 4H (optimal) charts of any high volume exchange, three new alert conditions will appear under the Surf's Up indicator alerts. Turn on the "Buy Signal" and "Sell Signal" to be alerted of potential large price increases. This script analyzes multiple data pieces to determine points in which the price has the highest probability of moving up, along with a sell alert that will alert the user of either: the point at which the trend is dying and to take profit OR that the trend is not happening, and to cut your losses. "Secure Profit" can be set to alert you of given profit target, at which time you can set a stop loss just above break even, essentially making a risk-free trade! This is OPTIONAL as it could cause you to a leave a large winning trade too early as well :)
Buy and Sell conditions have been programmed to know when the user is already in a trade, so multiple alerts will not fire, allowing full integration of auto trading as well.
Surf's Up is a back-tested strategy turned study in order to give high potential trade alerts. This way, anyone can easily add the script to the BTC/USD 4H chart, and simply turn on/off any of the 3 alerts: Buy, Sell, or Secure Profit.
You can get more information along with access to this script/alert system by clicking the link in the signature, or sending us a PM here on Tradingview.
Happy Trading!
Fixed Percent Stop Loss & Take Profit % - For Study Scripts===========
Fixed Percent Stop Loss & Take Profit % - { FOR STUDY SCRIPTS! }
===========
A neat example of how to set up Fixed Stops and Take Profit as a percent of the entry price - This is for setting Alerts within your own Study Script for when either your SL or TP get hit.
Yup, that's about it!
You can ignore the actual entry/exit orders - they're based on a simple MA cross and are therefore NOT relevant, NOT profitable and NOT recommended!
You should be using this code as a way of adding Stops and Takes to your own scripts - hope it helps!
Set your "Open Long/Short" Alerts to be triggered "Once per Bar Close" - Set your "SL/TP" Alerts to trigger "Once per Bar".
--
We wrote this with a bit of a rush on! ~ If you spot any mistakes/bugs just let us know and we'll get round to them asap!
-----------
Good Luck and Happy Trading!

Breakout Machine V2 - Alerts - Bitcoin BeatsHello, Hello, Hello and welcome back to Bitcoin Beats.
As the title suggests, this is Version 2 of The Breakout Machine Alerts version.
Unlike the previous version, this one has been fine-tuned to work best on Binance Futures ( BTCUSDT ).
PLEASE BE CAREFUL WITH YOUR LEVERAGE AND DON'T GET REKT.
Trade at your own risk! Good luck!
This strategy takes MACD and Volume spikes to calculate pumps and dumps in the bitcoin market.
I've also added custom backtesting inputs and leverage for you all to experiment with and see the profitability of the Strategy.
Alerts version coming soon...
Thank you, And goodbye, from Bitcoin Beats.

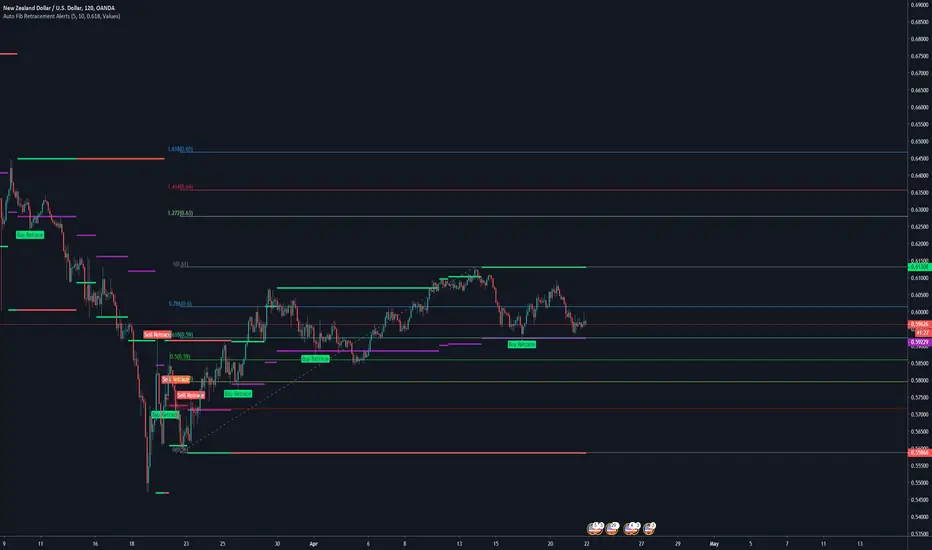
Auto Fib Retracement AlertsFor the fibonacci traders.
The Auto Fib Retracement Is a good indicator for tradingview to show you the current alerts and points to watch in the market
IMPORTANT SETTING => Retracement
This controls your alert levels
I have modified it to deliver the following
+Custom Fib retracement level alerts
+Drawing of old levels and retracement levels
+Backtesting Old Alerts
There are two shapes drawn on the chart;
Shown When the fib end is attained and market retraces back to your level
1. Buy retracement -
2. Sell retracement
How are they detected?
When we have new levels in the market; this is when the red or gree line changes, we calculate the new fib level that we will be watching for retracement
This is the purple level drawn on the chart
When the market first crosses below or above this level, The alert will be fired.
Consequent crosses are not updated
Enjoy! 😍
Originally requested by trade atechproduction
Crypto Scalper Pro Study / Alerts===========
Crypto Scalper Pro Study Script with Alerts
===========
Our Crypto Scalper Pro Study with Alerts Script is a carbon copy of our tried and tested Crypto Scalper Pro Strategy , but now with the option of setting TradingView Alerts for your chosen trading plan. Making missing trades a thing of the past, and helping you to automate your own trading strategy using AutoView, 3Commas or similar 3rd party Auto Trading Software.
-----------
Crypto Scalper Pro is a scalping strategy developed to work alongside our Crypto Tipster Strategy, now you can trade the D markets with our Tipster, and Intra-Day markets with our Scalper!
This strategy works very well on shorter time frames across multiple crypto pairs, everything from 4H all the way down to a 5m chart, our Crypto Scalper will find the best Entry and Exit points for consistent and reliable returns.
We've added a few variables for you to play with to fine tune this scalper to suit your chosen trading plan - however, these will only adjust the strategy to a certain degree, as there are many algorithms and indicators doing their thing hidden in the background that take precedence.
-----------
What's Included?
Crypto Scalper Pro comes with a host of features and is being continually updated, these features include (but are not limited to):
- Date Range Settings
Setting custom Start/End dates can help hone your strategy to suit the current times, or get a general overview of the market over the years.
- Heikin Ashi Confirmation
We added HA confirmation for both Entry & Exit of trades. This started as a form of "Safe Mode", we have since adapted our safe mode far beyond Heikin Ashi; but kept this confirmation as an added extra.
- Variable Indicator Settings
As well as our Fixed Indicators and Price Action analysis going on in the background of the strategy, we've also included some Variable Indicators that you have access to edit.
Lookback Period will help establish how far back you'd want to be confirming price indications on the strategy - the higher the number the further back it will look, making the Scalping Strategy appear smoother with less trades during choppy times, the downside with a higher lookback is you might miss the start of a potentially epic trade, and only be shown an Entry after the event has already happened.
We find Lookback Lengths of between 5 and 100 could work depending on various other settings, the market being traded, and the timeframe being used.
MA Length (Length of Moving Average) - We use a few MA's to best determine various factors involved with successfully scalping a market, overall trend direction, current price movements and fake-out detection to name just a few. You've got the option of determining a good average length for a few of these variables.
Again, a short MA Length will catch every big move right at the start, but you're almost guaranteed a Negative Expected Value with that method, due to the vast quantity of losing trades in times of chop/ranging markets. A Higher MA Length will remove a lot of chop, reduce the quantity of trades, and therefore (should) result in a higher Percent of Trades Profitable; it will however add a certain lag to the strategy, meaning those highly profitable trades we're looking for may turn out to be not so highly profitable!
- Safe Mode
Enabling Safe Mode will add a couple more confirmation indicators to the strategy - the aim of Safe Mode is, in essence, to remove any trading signals that would end of being false/bad moves. Usually resulting in less Overall Trades, a higher Net Profit, higher % Profitable, higher Profit Factor AND a lower Drawdown. Use Safe Mode to help eliminate orders that would otherwise be placed in choppy markets.
- Stop Loss/Take Profit Settings
This is where Crypto Scalper Pro really proves itself, Money Management. We have an editable Fixed SL/TP, as well as Trailing Stops for Long or Short orders, all of which you can use on their own, or combined with each other. Playing with these settings can turn an un-profitable system into a very-profitable trading plan!
-----------
What's Included within Crypto Scalper Study / Alerts Script?
Our Study script will find Entry and Exit points exactly as our Pro Strategy would find them. The same indicators, methods and chart reading techniques are used, there are 2 big differences however...
The first difference is that our Pro Strategy has the ability to manage your money, Fixed Stops, Take Profit and Trailing Stops to name just a few. Our Study does not (yet) have these functions added due to the way TradingView's charting platform operates.
That's the bad news, the good news for our Crypto Scalper Study Script is that you can add Alerts to your trading plan! This is super handy if you decide to implement our methods into different time frames across various markets and are looking for Intra-day Alerts, or if you're looking to Automate your trading strategy using external software.
Help and Advice for setting up Alerts or to Automate your Strategy can be found on our website.
----------
For more information on the Crypto Scalper Pro Strategy visit the link in our signature.
Good Luck and Happy Trading!

888 BOT #alerts█ 888 BOT #alerts
This is an Expert Advisor 'EA' or Automated trading script for ‘longs’ and ‘shorts’, which uses only a Take Profit or, in the worst case, a Stop Loss to close the trade.
It's a much improved version of the previous ‘Repanocha’. It doesn`t use 'Trailing Stop' or 'security ()' functions (although using a security function doesn`t mean that the script repaints) and all signals are confirmed, therefore the script doesn`t repaint in alert mode and is accurate in backtest mode.
Apart from the previous indicators, some more and other functions have been added for Stop-Loss, re-entry and leverage.
It uses 8 indicators, (many of you already know what they are, but in case there is someone new), these are the following:
1. Jurik Moving Average
It's a moving average created by Mark Jurik for professionals which eliminates the 'lag' or delay of the signal. It's better than other moving averages like EMA, DEMA, AMA or T3.
There are two ways to decrease noise using JMA. Increasing the 'LENGTH' parameter will cause JMA to move more slowly and therefore reduce noise at the expense of adding 'lag'
The 'JMA LENGTH', 'PHASE' and 'POWER' parameters offer a way to select the optimal balance between 'lag' and over boost.
Green: Bullish, Red: Bearish.
2. Range filter
Created by Donovan Wall, its function is to filter or eliminate noise and to better determine the price trend in the short term.
First, a uniform average price range 'SAMPLING PERIOD' is calculated for the filter base and multiplied by a specific quantity 'RANGE MULTIPLIER'.
The filter is then calculated by adjusting price movements that do not exceed the specified range.
Finally, the target ranges are plotted to show the prices that will trigger the filter movement.
Green: Bullish, Red: Bearish.
3. Average Directional Index (ADX Classic) and (ADX Masanakamura)
It's an indicator designed by Welles Wilder to measure the strength and direction of the market trend. The price movement is strong when the ADX has a positive slope and is above a certain minimum level 'ADX THRESHOLD' and for a given period 'ADX LENGTH'.
The green color of the bars indicates that the trend is bullish and that the ADX is above the level established by the threshold.
The red color of the bars indicates that the trend is down and that the ADX is above the threshold level.
The orange color of the bars indicates that the price is not strong and will surely lateralize.
You can choose between the classic option and the one created by a certain 'Masanakamura'. The main difference between the two is that in the first it uses RMA () and in the second SMA () in its calculation.
4. Parabolic SAR
This indicator, also created by Welles Wilder, places points that help define a trend. The Parabolic SAR can follow the price above or below, the peculiarity that it offers is that when the price touches the indicator, it jumps to the other side of the price (if the Parabolic SAR was below the price it jumps up and vice versa) to a distance predetermined by the indicator. At this time the indicator continues to follow the price, reducing the distance with each candle until it is finally touched again by the price and the process starts again. This procedure explains the name of the indicator: the Parabolic SAR follows the price generating a characteristic parabolic shape, when the price touches it, stops and turns (SAR is the acronym for 'stop and reverse'), giving rise to a new cycle. When the points are below the price, the trend is up, while the points above the price indicate a downward trend.
5. RSI with Volume
This indicator was created by LazyBear from the popular RSI.
The RSI is an oscillator-type indicator used in technical analysis and also created by Welles Wilder that shows the strength of the price by comparing individual movements up or down in successive closing prices.
LazyBear added a volume parameter that makes it more accurate to the market movement.
A good way to use RSI is by considering the 50 'RSI CENTER LINE' centerline. When the oscillator is above, the trend is bullish and when it is below, the trend is bearish.
6. Moving Average Convergence Divergence (MACD) and (MAC-Z)
It was created by Gerald Appel. Subsequently, the histogram was added to anticipate the crossing of MA. Broadly speaking, we can say that the MACD is an oscillator consisting of two moving averages that rotate around the zero line. The MACD line is the difference between a short moving average 'MACD FAST MA LENGTH' and a long moving average 'MACD SLOW MA LENGTH'. It's an indicator that allows us to have a reference on the trend of the asset on which it is operating, thus generating market entry and exit signals.
We can talk about a bull market when the MACD histogram is above the zero line, along with the signal line, while we are talking about a bear market when the MACD histogram is below the zero line.
There is the option of using the MAC-Z indicator created by LazyBear, which according to its author is more effective, by using the parameter VWAP (volume weighted average price) 'Z-VWAP LENGTH' together with a standard deviation 'STDEV LENGTH' in its calculation.
7. Volume Condition
Volume indicates the number of participants in this war between bulls and bears, the more volume the more likely the price will move in favor of the trend. A low trading volume indicates a lower number of participants and interest in the instrument in question. Low volumes may reveal weakness behind a price movement.
With this condition, those signals whose volume is less than the volume SMA for a period 'SMA VOLUME LENGTH' multiplied by a factor 'VOLUME FACTOR' are filtered. In addition, it determines the leverage used, the more volume, the more participants, the more probability that the price will move in our favor, that is, we can use more leverage. The leverage in this script is determined by how many times the volume is above the SMA line.
The maximum leverage is 8.
8. Bollinger Bands
This indicator was created by John Bollinger and consists of three bands that are drawn superimposed on the price evolution graph.
The central band is a moving average, normally a simple moving average calculated with 20 periods is used. ('BB LENGTH' Number of periods of the moving average)
The upper band is calculated by adding the value of the simple moving average X times the standard deviation of the moving average. ('BB MULTIPLIER' Number of times the standard deviation of the moving average)
The lower band is calculated by subtracting the simple moving average X times the standard deviation of the moving average.
the band between the upper and lower bands contains, statistically, almost 90% of the possible price variations, which means that any movement of the price outside the bands has special relevance.
In practical terms, Bollinger bands behave as if they were an elastic band so that, if the price touches them, it has a high probability of bouncing.
Sometimes, after the entry order is filled, the price is returned to the opposite side. If price touch the Bollinger band in the same previous conditions, another order is filled in the same direction of the position to improve the average entry price, (% MINIMUM BETTER PRICE ': Minimum price for the re-entry to be executed and that is better than the price of the previous position in a given %) in this way we give the trade a chance that the Take Profit is executed before. The downside is that the position is doubled in size. 'ACTIVATE DIVIDE TP': Divide the size of the TP in half. More probability of the trade closing but less profit.
█ STOP LOSS and RISK MANAGEMENT.
A good risk management is what can make your equity go up or be liquidated.
The % risk is the percentage of our capital that we are willing to lose by operation. This is recommended to be between 1-5%.
% Risk: (% Stop Loss x % Equity per trade x Leverage) / 100
First the strategy is calculated with Stop Loss, then the risk per operation is determined and from there, the amount per operation is calculated and not vice versa.
In this script you can use a normal Stop Loss or one according to the ATR. Also activate the option to trigger it earlier if the risk percentage is reached. '% RISK ALLOWED' wich is calculated according with: '%EQUITY ON EACH ENTRY'. Only works with Stop Loss on 'NORMAL' or 'BOTH' mode.
'STOP LOSS CONFIRMED': The Stop Loss is only activated if the closing of the previous bar is in the loss limit condition. It's useful to prevent the SL from triggering when they do a ‘pump’ to sweep Stops and then return the price to the previous state.
█ ALERTS
There is an alert for each leverage, therefore a maximum of 8 alerts can be set for 'long' and 8 for 'short', plus an alert to close the trade with Take Profit or Stop Loss in market mode. You can also place Take Profit limit and Stop Loss limit orders a few seconds after filling the position entry order.
- 'MAXIMUM LEVERAGE': It is the maximum allowed multiplier of the % quantity entered on each entry for 1X according to the volume condition.
- 'ADVANCE ALERTS': There is always a time delay from when the alert is triggered until it reaches the exchange and can be between 1-15 seconds. With this parameter, you can advance the alert by the necessary seconds to activate it earlier. In this way it can be synchronized with the exchange so that the execution time of the entry order to the position coincides with the opening of the bar.
The settings are for Bitcoin at Binance Futures (BTC: USDTPERP) in 30 minutes.
For other pairs and other timeframes, the settings have to be adjusted again. And within a month, the settings will be different because we all know the market and the trend are changing.
█ 888 BOT (SPANISH)
Este es un Expert Advisor 'EA' o script de trading automatizado para ‘longs’ y ‘shorts’, el cual, utiliza solo un Take Profit o, en el peor de los casos, un Stop Loss para cerrar el trade.
Es una versión muy mejorada del anterior ‘Repanocha’. No utiliza ‘Trailing Stop’, ni funciones ‘security()’ (aunque usar una función security no significa que el script repinte) y todas las señales son confirmadas, por consiguiente, el script no repinta en modo alertas y es preciso en en el modo backtest.
Aparte de los anteriores indicadores se han añadido algunos más y otras funciones para Stop-Loss, de re-entrada y apalancamiento.
Utiliza 8 indicadores, (muchos ya sabéis sobradamente lo que son, pero por si hay alguien nuevo), son los siguientes:
1. Jurik Moving Average
Es una media móvil creada por Mark Jurik para profesionales la cual elimina el ‘lag’ o retardo de la señal. Es mejor que otras medias móviles como la EMA, DEMA, AMA o T3.
Hay dos formas de disminuir el ruido utilizando JMA. El aumento del parámetro 'LENGTH' hará que JMA se mueva más lentamente y, por lo tanto, reducirá el ruido a expensas de añadir ‘lag’
Los parámetros 'JMA LENGTH', 'PHASE' y 'POWER' ofrecen una forma de seleccionar el equilibrio óptimo entre ‘lag’ y sobre impulso.
Verde : Alcista, Rojo: Bajista.
2. Range filter
Creado por Donovan Wall, su función es la de filtrar o eliminar el ruido y poder determinar mejor la tendencia del precio a corto plazo.
Primero, se calcula un rango de precio promedio uniforme 'SAMPLING PERIOD' para la base del filtro y se multiplica por una cantidad específica 'RANGE MULTIPLIER'.
A continuación, el filtro se calcula ajustando los movimientos de precios que no exceden el rango especificado.
Por último, los rangos objetivo se trazan para mostrar los precios que activarán el movimiento del filtro.
Verde : Alcista, Rojo: Bajista.
3. Average Directional Index (ADX Classic) y (ADX Masanakamura)
Es un indicador diseñado por Welles Wilder para medir la fuerza y dirección de la tendencia del mercado. El movimiento del precio tiene fuerza cuando el ADX tiene pendiente positiva y está por encima de cierto nivel mínimo 'ADX THRESHOLD' y para un periodo dado 'ADX LENGTH'.
El color verde de las barras indica que la tendencia es alcista y que el ADX está por encima del nivel establecido por el threshold.
El color Rojo de las barras indica que la tendencia es bajista y que el ADX está por encima del nivel de threshold.
El color naranja de las barras indica que el precio no tiene fuerza y seguramente lateralizará.
Se puede elegir entre la opción clásica y la creada por un tal 'Masanakamura'. La diferencia principal entre los dos es que en el primero utiliza RMA() y en el segundo SMA() en su cálculo.
4. Parabolic SAR
Este indicador, creado también por Welles Wilder, coloca puntos que ayudan a definir una tendencia. El Parabolic SAR puede seguir al precio por encima o por debajo, la particularidad que ofrece es que cuando el precio toca al indicador, este salta al otro lado del precio (si el Parabolic SAR estaba por debajo del precio salta arriba y viceversa) a una distancia predeterminada por el indicador. En este momento el indicador vuelve a seguir al precio, reduciendo la distancia con cada vela hasta que finalmente es tocado otra vez por el precio y se vuelve a iniciar el proceso. Este procedimiento explica el nombre del indicador: el Parabolic SAR va siguiendo al precio generando una característica forma parabólica, cuando el precio lo toca, se para y da la vuelta (SAR son las siglas en inglés de ‘stop and reverse’), dando lugar a un nuevo ciclo. Cuando los puntos están por debajo del precio, la tendencia es alcista, mientras que los puntos por encima del precio indica una tendencia bajista.
5. RSI with Volume
Este indicador lo creo un tal LazyBear de TV a partir del popular RSI.
El RSI es un indicador tipo oscilador utilizado en análisis técnico y creado también por Welles Wilder que muestra la fuerza del precio mediante la comparación de los movimientos individuales al alza o a la baja de los sucesivos precios de cierre.
LazyBear le añadió un parámetro de volumen que lo hace más preciso al movimiento del mercado.
Una buena forma de usar el RSI es teniendo en cuenta la línea central de 50 'RSI CENTER LINE'. Cuando el oscilador está por encima, la tendencia es alcista y cuando está por debajo la tendencia es bajista.
6. Moving Average Convergence Divergence (MACD) y (MAC-Z)
Fue creado por Gerald Appel. Posteriormente se añadió el histograma para anticipar el cruce de medias. A grandes rasgos podemos decir que el MACD es un oscilador consistente en dos medias móviles que van girando en torno a la línea de cero. La línea del MACD no es más que la diferencia entre una media móvil corta 'MACD FAST MA LENGTH' y una media móvil larga 'MACD SLOW MA LENGTH'. Es un indicador que nos permite tener una referencia sobre la tendencia del activo sobre el cual se está operando, generando de este modo señales de entrada y salida del mercado.
Podemos hablar de mercado alcista cuando el histograma del MACD se sitúe por encima de la línea cero, junto con la línea de señal, mientras que hablaremos de mercado bajista cuando el histograma MACD se situará por debajo de la línea cero.
Está la opción de utilizar el indicador MAC-Z creado por LazyBear que según su autor es más eficaz, por utilizar el parámetro VWAP (precio medio ponderado por volumen) 'Z-VWAP LENGTH' junto con una desviación standard 'STDEV LENGTH' en su cálculo.
7. Volume Condition
El volumen indica el número de participantes en esta guerra entre toros y osos, cuanto más volumen más probabilidad de que se mueva el precio a favor de la tendencia. Un volumen bajo de negociación indica un menor número de participantes e interés por el instrumento en cuestión. Los bajos volúmenes pueden revelar debilidad detrás de un movimiento de precios.
Con esta condición se filtran aquellas señales cuyo volumen es inferior a la SMA de volumen para un periodo 'SMA VOLUME LENGTH' multiplicado por un factor 'VOLUME FACTOR'. Además, determina el apalancamiento utilizado, a más volumen, más participantes, más probabilidad de que se mueva el precio a nuestro favor, es decir, podemos utilizar más apalancamiento. El apalancamiento en este script lo determina las veces que está el volumen por encima de la línea de la SMA.
El apalancamiento máximo es de 8.
8. Bollinger Bands
Este indicador fue creado por John Bollinger y consiste en tres bandas que se dibujan superpuestas al gráfico de evolución del precio.
La banda central es una media móvil, normalmente se emplea una media móvil simple calculada con 20 períodos. ('BB LENGTH' Número de periodos de la media móvil)
La banda superior se calcula sumando al valor de la media móvil simple X veces la desviación típica de la media móvil. ('BB MULTIPLIER' Número de veces la desviación típica de la media móvil)
La banda inferior de calcula restando a la media móvil simple X veces la desviación típica de la media móvil.
la franja comprendida entre las bandas superior e inferior contiene, estadísticamente, casi un 90% de las posibles variaciones del precio, lo que significa que cualquier movimiento del precio fuera de las bandas tiene especial relevancia.
En términos prácticos, las bandas de Bollinguer se comporta como si de una banda elástica se tratara de manera que, si el precio las toca, éste tiene mucha probabilidad de rebotar.
En ocasiones, después de rellenarse la orden de entrada, el precio se devuelve hacia el lado contrario. Si toca la banda de Bollinger se rellena otra orden en la misma dirección de la posición para mejorar el precio medio de entrada, (% MINIMUM BETTER PRICE': Precio mínimo para que se ejecute la re-entrada y que sea mejor que el precio de la posición anterior en un % dado) de esta manera damos una oportunidad al trade de que el Take Profit se ejecute antes. La desventaja es que se dobla el tamaño de la posición. 'ACTIVATE DIVIDE TP': Divide el tamaño del TP a la mitad. Más probabilidad de que se cierre el trade pero menos ganancias.
█ STOP LOSS y RISK MANAGEMENT.
Una buena gestión de las pérdidas o gestión del riesgo es lo que puede hacer que tu cuenta suba o se liquide en poco tiempo.
El % de riesgo es el porcentaje de nuestro capital que estamos dispuestos a perder por operación. Este se aconseja que debe estar comprendido entre un 1-5%.
% Risk = (% Stop Loss x % Equity per trade x Leverage) / 100
Primero se calcula la estrategia con Stop Loss, después se determina el riesgo por operación y a partir de ahí se calcula el monto por operación y no al revés.
En este script puedes usar un Stop Loss normal o uno según el ATR. También activar la opción de que salte antes si se alcanza el porcentaje de riesgo. '% RISK ALLOWED' que se calcula según el porcentaje de tu capital para 1X '% EQUITY ON EACH ENTRY'.
'STOP LOSS CONFIRMED': Solamente se activa el Stop Loss si el cierre de la barra anterior se encuentra en la condición de límite de pérdidas. Es útil para evitar que se dispare el SL cuando hacen un ‘pump’ para barrer Stops y luego se devuelve el precio a la normalidad.
█ ALERTAS
Hay una alerta por cada apalancamiento por consiguiente como máximo se pueden poner 8 alertas para 'long' y 8 para 'short', más una alerta para cerrar el trade con Take Profit o Stop Loss en modo market. Tambien puedes colocar las ordenes Take Profit limit y Stop Loss limit unos segundos despues de rellenar la orden de entrada de la posición.
- 'MAXIMUM LEVERAGE': Es el máximo multiplicador permitido de la cantidad introducida para 1X según la condición de volumen.
- 'ADVANCE ALERTS': Siempre existe un retardo de tiempo desde que se activa la alerta hasta que llega al exchange y que puede ser de entre 1-15 segundos. Con este párametro se puede adelantar la alerta los segundos necesarios para que se active antes. De este modo se puede sincronizar con el exchange para que el tiempo de ejecución de la orden de entrada a la posición coincida con la de apertura de la barra.
Los settings son para Bitcoin en Binance Futures (BTC:USDTPERP) en 30 minutos.
Para otro pares y otras temporalidades se tienen que ajustar las opciones de nuevo. Además para dentro de un mes, los ajustes serán otros distintos ya que el mercado y la tendencia es cambiante.
