BOSS Smooth Stochastic Bull/Bear Oscillator With Alerts THE BEST FOREX, BINARY OPTIONS, AND CRYPTO INDICATORS FOR TRADINGVIEW.COM
Short Entry
During a price downtrend and you get a sell signal (red dot) enter short when the "K" line (green line) drops below 65 (mid upper band).
Long Entry
During an uptrend, buy when you get a long signal (green dot) and "D" line (red line) rises above 35 (mid lower band) .
Bull/Bear
Green background indicates bullish price action (uptrend)
Red background indicates bearish price action (downtrend)
Available At bosscripts.com
Website bosscripts.com
Alerts

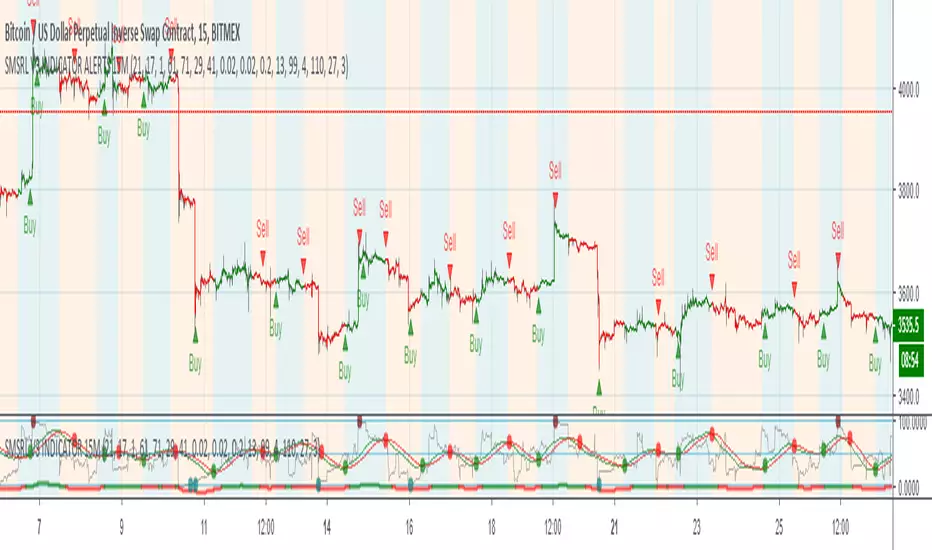
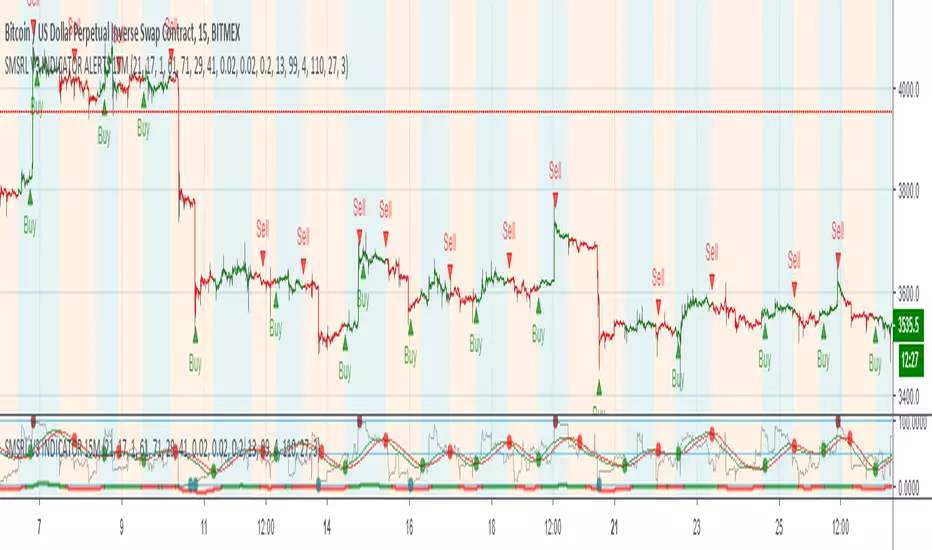
Boring Indicator [ALERTS] [Pretty cool tho]Umm, it's pretty boring indicator, you just buy/long when you see buy and you sell/short when you see sell.
Kinda it's like Market God indicator except that it's better and it took me like 10 minutes to figure it out.
Does it repaints?
I mean... kinda yes and kinda not, signal may start blinking but usually it stays in same place, so even if it disappers for few seconds it should come back.
If you want to be 100% sure, wait for close of candle where it appears.
* Works best on Heikin Ashi candles, so try them.
* Alerts are fine, just set them, probably you will figure out how.
* Should work on crypto mostly, probably stocks too (though remember that they are slower so try on 1day? up to you)
* Should work on any timeframe but 45m BITMEX:ETHUSD is nice for me and I trade there, consider that market doesn't moves 1435236 dollars every candle so well, its better if you wait on longer candle than try to trade on 1m.
Enjoy.
If you want to give me some more money for energy drinks and pizza:
BTC address: 3BMEXhXUAFj39D799zzfU1UAhx4NYSqCog
Oh and share it to friends and family.

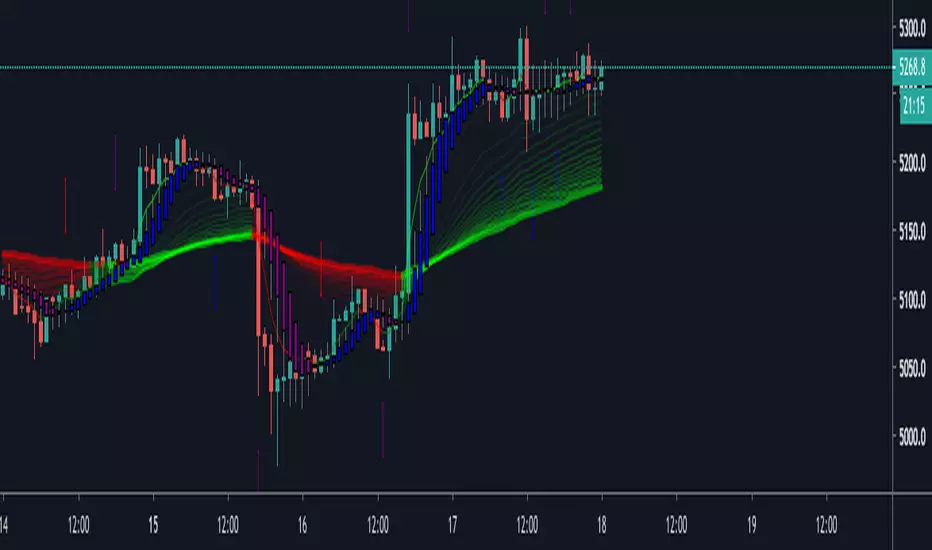
5 MAs w. alerts [LucF]Is this gazillionth MA indicator worth an addition to the already crowded field of contenders? I say yes! This one shows up to 5 MAs and 6 different marker conditions that can be used to create alerts, among many other goodies.
Features
MAs can be darkened when they are falling.
MAs from another time frame can be displayed, with the option of smoothing them.
Markers can be filtered to Longs or Shorts only.
EMAs can be selected for either all or the two shortest MAs.
The background can be colored using any of the marker states except no. 3.
Markers are:
1. On crosses between any two user-defined MAs,
2. When price is above or below an MA,
3. On Quick Flips (a specific setup involving a cross, multiple MA states and increasing volume, when available),
4. When the difference between two MAs is within a % of its high/low historic values,
5. When an MA has been rising/falling for n bars,
6. When the difference between two MAs is greater than a multiple of ATR.
Some markers use similar visual cues, so distinguishing them will be a challenge if they are used concurrently.
Alerts
Alerts can be created on any combination of alerts. Only non-consecutive instances of markers 5 and 6 will trigger the alert condition. Make sure you are on the interval you want the alert to run at. Using the “Once Per Bar Close” trigger condition is usually the best option.
When an alert is created in TradingView, a snapshot of the indicator’s settings is saved with the alert, which then takes on a life of its own. That is why even though there is only one alert to choose from when you bring up the alert creation dialog box and choose “5 MAs”, that alert can be triggered from any number of conditions. You select those conditions by activating the markers you want the alert to trigger on before creating the alert. If you have selected multiple conditions, then it can be a good idea to record a reminder in the alert’s message field. When the alert triggers, you will need the indicator on the chart to figure out which one of your conditions triggered the alert, as there is currently no way to dynamically change the alert’s message field from within the script.
Background settings will not trigger alerts; only marker configurations.
Notes
MAs are just… averages. Trader lure would have them act as support and resistance levels. I’m not sure about that, and not the only one thinking along these lines. Adam Grimes has studied moving averages in quite a bit of detail. His numbers point to no evidence indicating they act as support/resistance, and to specific MA lengths not being more meaningful than others. His point of view is debated by some—not by me. Mean reversion does not entail that price stops when it reaches its MA; rather, it makes sense to me that price would often more or less oscillate around its MA, which entails the MA does not act as support/resistance. Aren’t the best mean reversion opportunities when price is furthest away from its MA? If so, it should be more profitable to identify these areas, which some of this indicator’s markers try to do.
I think MAs can be much more powerful when thought of as instruments we can use to situate price events in contexts of various resolutions, from the instantaneous to the big picture. Accordingly, I use the relative positions and slopes of MAs in both discretionary and automated trading; but never their purported ability to support/resist.
Regardless of how you use MAs, I hope you will find this indicator useful.
Biased References
The Art and Science of Technical Analysis: Market Structure, Price Action, and Trading Strategies, Adam Grimes, 2012.
Does the 200 day moving average “work”?
Moving averages: digging deeper

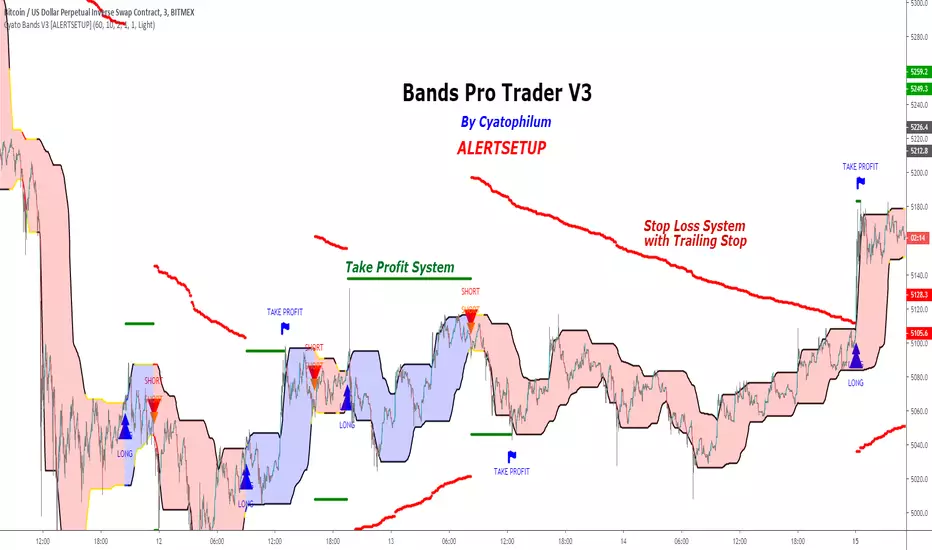
Cyatophilum Bands Pro Trader V3 [ALERTSETUP]An Original Automated Strategy that can be used for Manual or Bot Trading, on any timeframe and market.
>> Presentation <<
This script comes with a Backtest Version
How it works
No, these are NOT Bollinger Bands..
The Cyatophilum Bands are an original formula that I created. You will probably never find it anywhere else.
Their behavior is the following:
When they are horizontal it means the trend is going sideways and they represent supports (lower band) and resistances (upper band).
When they are climbing or falling it means the trend is either bullish or bearish and they represent Trend Lines.
The strategy enters Long on a Bull Breakout and enters Short on a Bear Breakout.
The exits are triggered either on a Trend Reversal, a Stop Loss or a Take Profit.
FEATURES
Take Profit System
Stop Loss System
Show Net profit Line
More features here
Finding a profitable configuration is GUARANTEED
0. Choose your symbol and timeframe. Then add the Backtest version to your chart. If at any time you decide to change your timeframe, go back to step 1.
1. Open the strategy tester and look at the buy & hold line.
If it is mostly climbing (last value greater than 0) then it means we are in a bull market. You should then opt or a long only strategy.
If it is mostly dropping (last value lower than 0) then it means we are in a bear market. You should then opt or a short only strategy.
Note : This first step is really important. Trading against the market has very little chances to succeed.
2. Go into the Strategy Input Parameters:
check "Enable Long Results" and uncheck "Enable Short Results" if you are in a long only strategy.
check "Enable Short Results" and uncheck "Enable Long Results" if you are in a short only strategy.
3. Open the Strategy Tester and open the Strategy Properties.
We are going to find the base parameters for the Bands.
The "Bands Lookback" is the main parameter to configure for any strategy. It corresponds to how strong of a support and resistance the bands will behave. The lower the timeframe, the higher lookback you will need. It can move from 10 to 60. For example 60 is a good value for a 3 minute timeframe. Try different values, and look at the "net profit" value in the Overview tab of the Strategy Tester. Keep the Lookback value that shows the best net profit value.
Then play with the "Bands Smoothing" from 2 to 20 and keep the best net profit value.
The "Band Smoothing" is used to reduce noise.
Usually, the default value (10) is what gives the best results.
From this point you should already be able to have a profitable strategy (net profit>0), but we can improve it using the Stop Loss and the Take Profit feature.
4. To activate the Stop Loss feature, click on the "SECURITY" checkbox
You should see horizontal red lines appear.
A Long/short exit alert will be triggered if the price were to cross this line. (A red Xcross will appear)
Choose the Stop Loss percentage.
On top of that, you can enable the feature "Trailing Stop". It will make the red line follow the price, at a speed that you can configure with the "Trailing Speed" parameter.
Now, sometimes a stop is triggered and it was just a fakeout. You can enable "Re-entries after a stop" to avoid missing additional opportunities.
5. To activate the Take Profit feature, click on the "TAKE PROFIT" checkbox
You should see horizontal green lines appear.
A Long/short exit alert will be triggered if the price were to cross this line. (A flag will appear)
Choose the Take Profit percentage.
A low takeprofit will provide a safer strategy but can reduce potential profits.
A higher takeprofit will increase risk but can provide higher potential profits.
6. Money Management
You can configure the backtest according to your own money management.
Let's say you have 10 000 $ as initial capital and want to trade only 5%, set the Order Size to 5% of Equity.
You can increase net profit by increasing the order size but this is at your own risk.
How to create alerts explained here
Sample Uses Cases
Use it literally anywhere
This indicator can be used on any timeframe and market (not only cryptocurrencies).
About the Backtest below
The Net Profit (Gross profit - Gross loss) is calculated with a commission of 0.05% on each order.
No leverage used. This is a long strategy.
Each trade is made with 10 % of equity from an inital capital of 10 000$. The net profit can be bigger by increasing the % of equity but this a trader's rule to minimise the risk.
I am selling access to all my indicators on my website : blockchainfiesta.com
To get a 2 days free trial, just leave a comment , thanks !
Join my Discord for help, configurations, requests, etc. discord.gg
SHA & MMAR Strategy Alert IndicatorIndicator w/ alerts for 'Slow-Heiken Ashi & Madrid Moving Average Strategy'.
High win-percentage with cryptocurrencies on a 1H timechart.
Dragon-Bot - Default ScriptDragon-Script is a framework to make it as easy as possible to test your own strategies and set alerts for external execution bots. This is the alerts version of the script.
The script has many features build in, like:
1) A ping/pong mechanism between longs and shorts
2) A stop-loss
3) Trailing Stops with several ways to calculate them.
4) 2 different ways to flip from long to short.
The script is divided into several parts.
The first part of the script is used to set all the variables. You should normally never change the first part except for the comments at the top.
The second part of the script is the part where you initialise all your indicators. Several indicators can be found on Tradingview and on other sites. Please keep in mind that all the variable names used in the indicator should be unique. (all the … = … parts)
The third part of the script, is the most important part of the script. Here you can create the entry and exit points.
Let’s look at the OPENLONG function to explain this part: The first variables are all the possible entries; These are longentry1 till longentry5. You can add many more if you like.
The variables are all initialised as being false. This way the script can set a value to true if an entry happens.
The if function is the actual logic: You could say “if this is true” then (the line below the if function) longentry1 := (becomes) true.
In this case we have said: “if this is true” then (the line below the if function) longentry1 := (becomes) true when the current close is larger than the close that is 1 back.
The last part is the makelong_funct. This part says that if any of the entries are true, the whole function is true.
The last part of the script is the actual execution. Here the alerts are plotted and the back test strategies are opened and closed.
We hope you guys like it and all feedback is welcome!


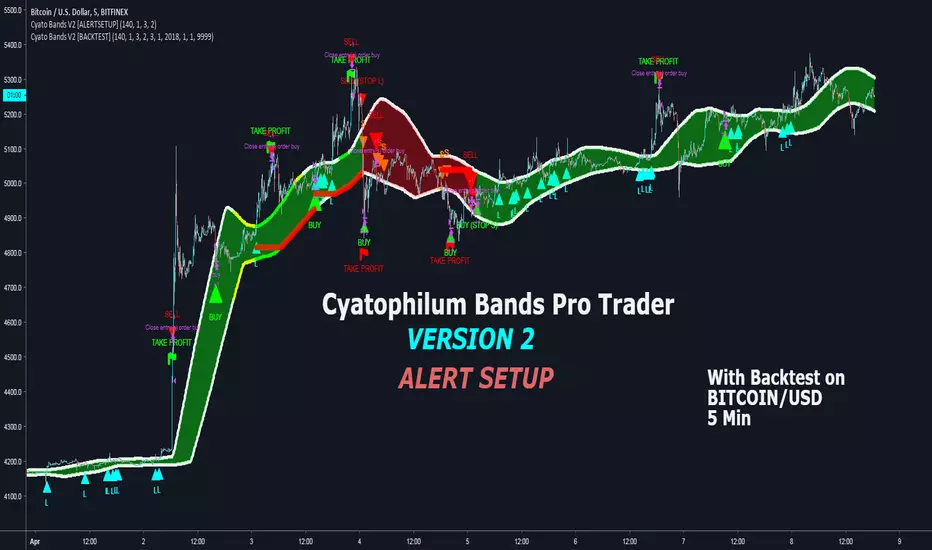
Cyatophilum Bands Pro Trader V2 [ALERTSETUP]An Original Automated Strategy that can be used for Manual or Bot Trading, on any timeframe and market.
Presentation page with video
How it works
The Cyatophilum Bands behave as either Trend Lines during a bear or bull market, or Support and Resistance during a Flat Market. Buy and Sell signals trigger upon Trend Reversal Breakouts.
Stop Loss System
An integrated Stop Loss System. Helps reducing risk by creating buy and sell signals when the price breaks through the red line.
Trailing Stop
Transform your Stop Loss into a Trailing Stop Loss. The red line will increase/decrease to secure profits.
Take Profit
Secure your profits using this new feature! When a flag appears, a buy/sell signal will trigger.
Re-Entries
A feature that can be helpful when using Take Profit or for manual trading in case you missed a trade.
Use it literally Anywhere
This indicator can be used on any timeframe and market (not only cryptocurrencies).
Backtest Below
Note: can be easily automated with Autoview
Get the indicator today!
Turtles Modified AlertsAlerts for famous Turtle Trading Rules. Based on work from tmr0 and ossettia . It can be used with Autoview.
If you have any advice on how to further improve the script, please let me know by PM or comment below. Thanks!
Please hit on "Like" if you find this script useful so that others can find it easier. Thanks!
*** The information and script provided here are no recommendation to buy or sell. They are just an idea for educational and discussion purposes. ***

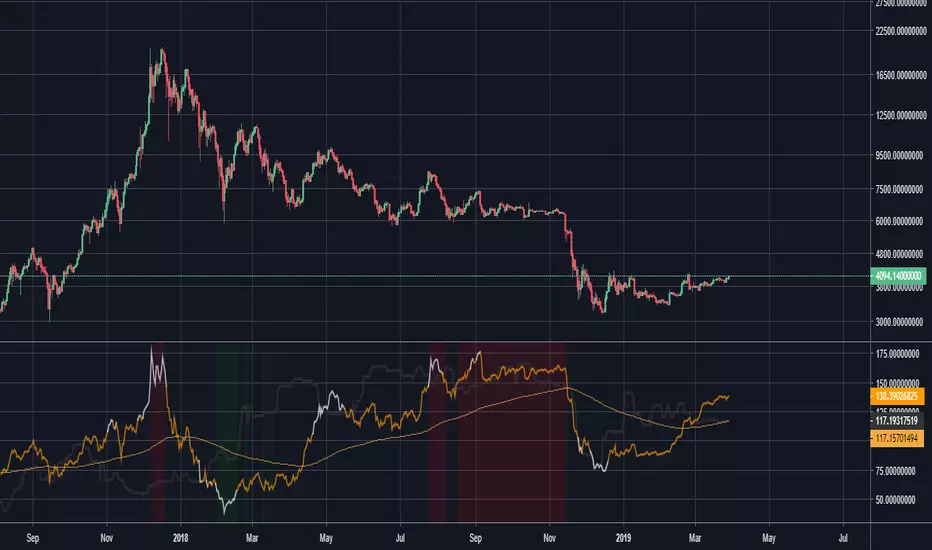
NVT Signal with RMA and thresholds [alertable]NVT Signal, or NVTS, is an indicator that compares the market cap of Bitcoin to the aggregate USD value of daily transactions on the Bitcoin blockchain. It is a value indicator that shows a multiple of Bitcoin price against the actual usage of its blockchain. When the NVTS is low, it suggests Bitcoin price is low relative to the amount of utility the network provides, and vice versa.
For more information on NVTS, visit medium.com
This indicator aims to provide the following:
1. An open-source implementation of NVTS on Tradingview, as the most popular one currently is closed-source.
2. To provide two simple ways to define and visualize "overbought" or "oversold" conditions using the NVTS. Here, we have absolute value of NVTS & deviation from a long-term moving average.
3. Crude integration into Tradingview's alert system.
What this indicator CANNOT do:
1. Timeframes below 1d.
2. Signals based on statistical analyses, such as seen in Bollinger Bands et al. (However, with the appropriate type of account, you can add BBands on top of this indicator.)
I would like to express my gratitude to Willy Woo, Chris Burniske and Dimitry Kalichkin for their work on NVT Ratio and NVT Signal, without which my indicator would not have been created.
Feel free to fork & improve, or experiment with settings. I hope this indicator will be useful to someone.
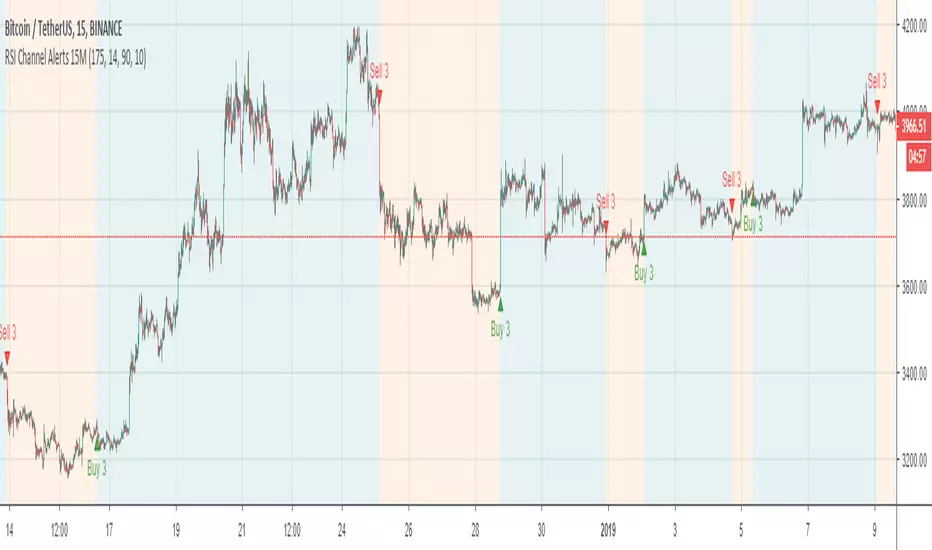
Ichimoku Cloud Daily Offset with Alerts The Skript uses Offsets in both positive and negative direction to give buy and sell alerts.
Use the Script on a daily Timeframe
- No financial advice -
There are 3 Buy and 3 Sell alerts in the Skript.
Buy 1 - B1: Buy e.g. 3%
Buy 2 - B2: Buy e.g. 10%
Buy 3 - B3: Buy e.g. 50%
Sell 1 - S1: Sell e.g. 5%
Sell 2 - S2: Sell e.g. 30%
Sell 3 - S3: Sell e.g. 90%


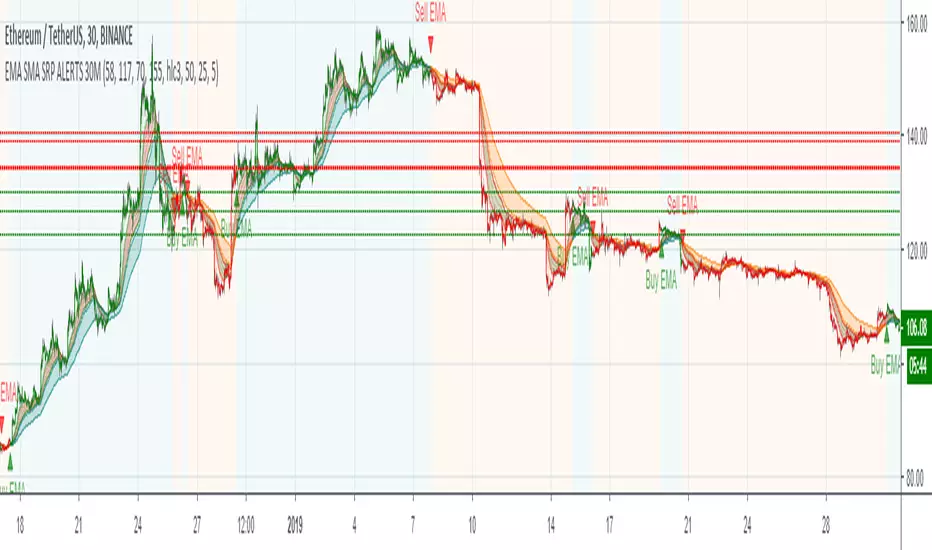
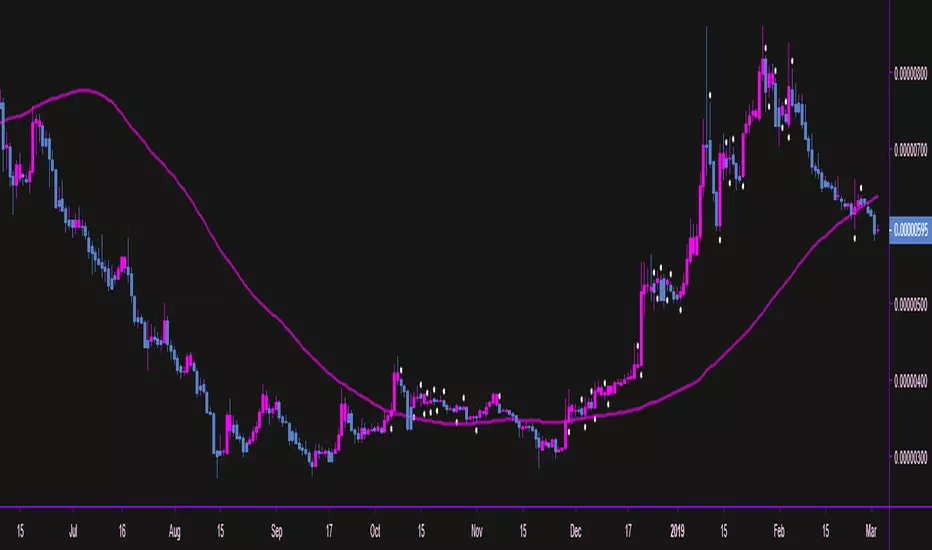
EMA SMA SRP ALERTS 30MThe Alerts is based on indicators:
Exponential Moving Average ( EMA )
Simple Moving Average ( SMA )
Support and Resistance Levels
Allows to find entry/exit points
Adapted for:
Chart: 30 minutes
Up Down Alerts with MA Control - v2.0this update is meant for use with regular candles, but it will mimic the color pattern of heikin ashi candles and allow alerts based on the heikin ashi patterns. Also there are alerts for when the price is above a set moving average.
was going to just update the original script but there are a lot of changes to make it smoother etc, original script:
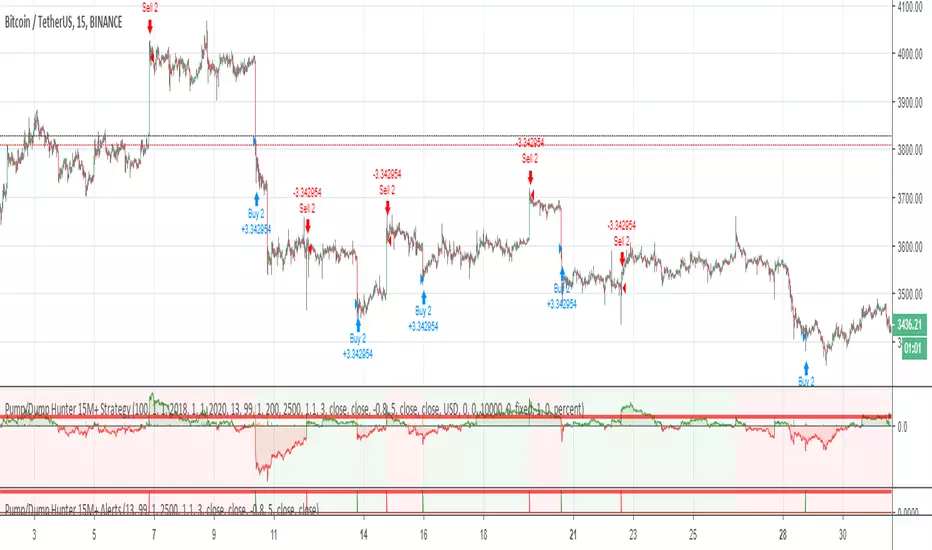
Pump/Dump Hunter 15M+ Alerts//The Alerts is based on the pumps and dumps strategy, as well as a sudden change in market volumes
MACD Enhanced System MTF with optional TSL and Alerts [LTB]This script is developed to analyse MACD, MACD Signal, MACD Histogram movements by using current and higher time frame. Script calculates higher time frame automatically, no manuel entry. there is trailing stop loss line that is optional.
You can change the parameters as you wish.
btw. you should know that MACD is more successful when there is a trend.
I already shared this as a strategy script. Some ppl wanted to see the code.
You might want to see strategy test =>
by LonesomeTheBlue

[ALERTS] CMYK-RMI-SMA
▼ This is the study version of the script, For usage with Autoview
◊ Introduction
This script makes use of three RMI's and SMA's, that indicate Overbought/Oversold on different Periods that correspond with Frequency’s that move the market.
◊ Origin
This is an update on █▓▒░ CMYK ♦ RMI ♦ TRIPLE ░▒▓█
◊ Usage
This script is intended for Automated Trading on the 1-5 minute chart.
◊ Features Summary
Two Part Indicator
Strategy Type Selection
Three RMI's SMA's
Trend adjustment
Pump/Dump Entry Delay
Pyramiding
Ignore first entries
Take Profit
Interval between Entries
Multiring Fix
Alert signal Seperation
◊ Community
Wanna try this script out ? need help resolving a problem ?
CMYK :: discord.gg
AUTOVIEW :: discordapp.com
TRADINGVIEW UNOFFICIAL :: discord.gg
◊ Setting up Autoview Alerts
Use the study version of this script, To set up The Alerts Autoview Picks up on.
Goto the CMYK Discord for support and Settings.
◊ Backtesting
Use the strategy version of this script for backtesting.
◊ Contact
Wanna try this script out ? need help resolving a problem ?
CMYK :: discord.gg
HAPPY TRADES!!!

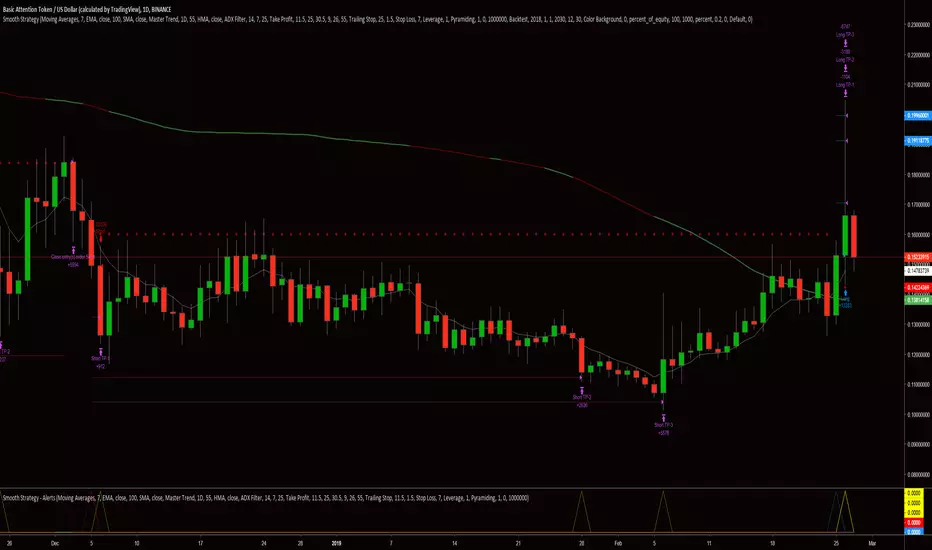
Smooth Strategy - AlertsThis is an alert script that accompanies "Smooth Strategy." This script was written to be used with AutoView, but can likely be used for similar services as well. Be sure that all settings match exactly with the settings used in "Smooth Strategy."
***HOW TO SET ALERTS***
Long Entry - "Once Per Bar Close"
Short Entry - "Once Per Bar Close"
All TP Levels - "Only Once"
Long Close - "Once Per Bar Close"
Short Close - "Once Per Bar Close"
Divergences for many indicators v2.0A gift from me to all.
This script is developed to find Divergences for many indicators. it analyses divergences and then draws line on the graph. red for negatif, lime for positive divergences.
Currently script checks divergence for RSI, MACD, MACD Histogram, Stochastic, CCI, Momentum, OBV, Diosc, VWMACD and CMF indicators. You can use some or all of these indicators to check divergences as you wish by choosing them on the menu. Also you can add/remove many other indicators to the script to check if there is divergence.
The script first calculates tops/bottoms by using higher time frame zig zag and then finds divergences.
Higher Time Frames are
if currend period 1 min => HTF = 5 mins
if currend period 3 mins => HTF = 15 mins
if currend period 5 mins => HTF = 15 mins
if currend period 15 mins => HTF = 1 hour
if currend period 30 mins => HTF = 1 hour
if currend period 45 mins => HTF = 1 hour
if currend period 1 hour => HTF = 4 hours
if currend period 2 hours => HTF = 4 hours
if currend period 3 hours => HTF = 4 hours
if currend period 4 hours => HTF = 1 day
if currend period 1 day => HTF = 1 week
if currend period 1 week => HTF = 1 week
future plan : script finds regular divergences, soon I will add hidden divergences and also I plan to add alert ;)
