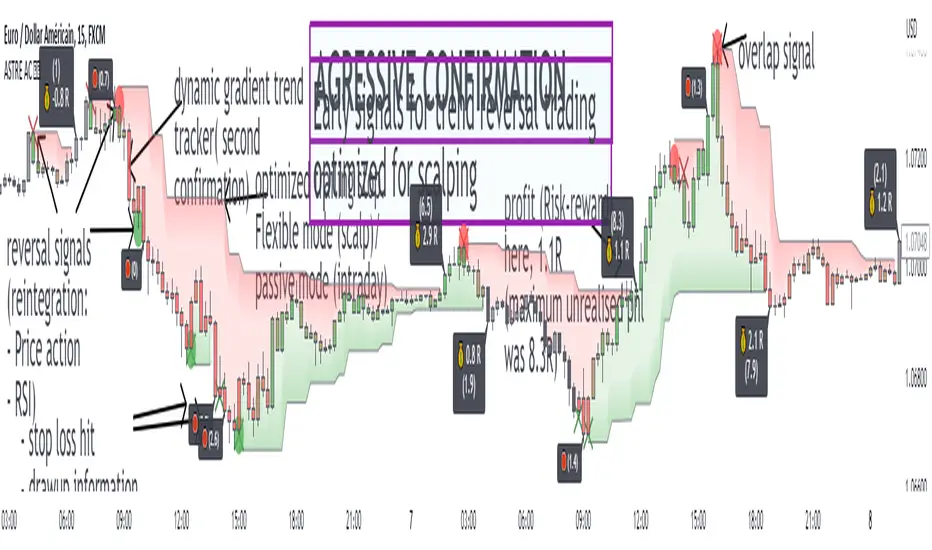
Agressive ConfirmationThis indicator serves as a guide for aggressive counter-trend trading, offering entries, a trailing stop for trade exits and a performance backtesting system (risk ratio).
AC proves to be an excellent ally in assisting counter-trend entry decisions. The signals come from two different sources, and are positioned almost identically in terms of the timing of entry into a trade on a trend change.
The first is RSI reintegration: simple, effective. The second is price action reintegration (identifies short-term support/resistance, a false break with counter-trend reinjection).
The duality of this entry system means you can be present on most local tops and bottoms without having an excessively high number of trade entries. The failure of the first entry can give a signal on the second (divergence, volatility...): use this complementarity to your advantage! If the first signal ends in a loss, wait for confirmation on the second signal.
The trailing stop system is activated as soon as an entry signal is detected, and if no entry signal is still active. The trade is closed when the candle closes above or below the trailing stop.
Two possible settings:
"passive": (multiply 5, period 8), least reactive trailing stop, willing to hold the trade
"balanced": (multiply 1, period 4): versatile trailing stop, ideal compromise.
These trailing stop parameters are optimized by the automated backtesting strategy of our IRL indicator, which indicates precise reversal levels. To use them in this specific context, you need to be in timeframe m1. For more information on these levels, please see my profile!
The stop loss for each reversal corresponds to the last high/low of the last 4 candles. It's possible to display this value above or below the trade entry signal, which makes it easier to understand the practical application of the signals presented.
An option for displaying more information on trades executed once closed. When an exit signal is detected (stop loss OR trailing stop), the candle leading to the trade's closure is marked with a label, providing information on the trade's profit (expressed in R, risk ratio). A second piece of information, in brackets, is the drawup: this corresponds to the maximum unrealized PNL of the closed trade.
The size of these labels can be modified according to the trade's PNL, all managed by profitability thresholds in R (default: 8R, 4R, 1R).
these latest entry signal performance functions optimize the backtesting process and the identification of relevant reversal strategies, by reversing the methodology: "where are the biggest profits made over such and such a period, what were the signals of my studied strategy, ...". The drawup, for its part, will enable you to appreciate an entry during a volatile period, which can sometimes lead to substantial short-term gains, but which the trailing stop exit failed to capitalize on!
A second signal corresponds to an additional confirmation, generally later in the timing, and informed by candle coloring. Based on RSI convergence/divergence, and to be used as a possible complementary filter to entry signals. Independent and without impact on the entry and exit signals studied.
This indicator has been developed in synergy with our other published technical indicators for identifying reversal zones / reversal timings, and offers a guideline for those less experienced in frontrunning/counter-trending. AC should be the sinequa none for a reversal entry, and will enable you to appreciate the reversal setups studied!
Agressive
Triangulation : Statistically Approved ReversalsA lot of calculation, but a simple and effective result displayed on the chart.
It automatically identifies a very favorable period for a price reversal, by analyzing the daily and intraday price action statistics from the maximum of the most recent bars from the historical data. No repainting. Alerts can be set.
The statistical study is done in real time for each instrument. The probabilities therefore vary over time and adapt to the latest information collected by the indicator.
The time range of the data study can be changed by simply changing the UT :
- 30m = 3.5 last months feed statistics
- 15m = 52 last days feed statistics
- 5m = 17 last days feed statistics (recommanded)
HOW TO USE
This indicator informs when we are in a time period strongly favorable to reversal.
==> Crossing probabilities of different kinds, in price and in time => Triangulation of top and bottom !
HOW It WORK :
fractal statistics on high and low formation.
hour's probabilities of making the high/low of the day are crossed with day's probabilities of making the high/low of the week.
First for the day, we study:
- value of the probability compared to the average probabilities
- value of the coefficient between the high probability and the low probability
which we then refine for the hour, with the same calculation.
Result: bright color for a day + hour with high probability, weak color if the probability is low but remains the only possible bias. Between these two possibilities, intermediate colors are possible - just like looking for shorts if the day is bullish, if it is a high probability hour!
This color is displayed in the background, only if we are forming the high of the day for tops, and the low of the day for bottoms - detected with a stochastic.
All probabilities are studied in real time for the current asset.
We will call this signal "killstats", for "killzones statistics"
fractal statistics on the probability of closure under specific predefined levels according to 36 cycles.
the probabilities of several cycles are studied, for example:
NY session versus London and Asian sessions, London session compared to its opening, NY session compared to its opening, "algorithmic cycles" ( 1h30), Opening of NY compared to its intersection with London..
Each cycle producing a probability of closing with respect to the opening price of each period. The periods are : (Etc/UTC)
15-18h / 15-16h / 9-13h / 14-17h / 18-22h / 10-12h / 9-10h30 / 10h30-12h / 12-13h30 / 13h30-15h / 15h-16h30 / 16h30-18h
The cycles can be superimposed, which allows to support or attenuate a signal for the key periods of the day: 9am-12pm, and 3pm-6pm. The period of the day covered by the study of cycles is 9h-22h.
Result : ==> a straight line with a half bell. Colors = almost transparent for 53% probability (low), and very intense for a high probability (75%). The line displayed corresponds to the opening price, which we are supposed to close within the time limit - before the end of the period, where the line stops.
If the price goes in the opposite direction to the one predicted by the statistics, then a background connects the price to the close level to be respected.
if direction and close is respected, nothing is displayed : there is no opportunity, no divergence between statistics and actual price moves.
By unchecking the "light mode", you can see each close level displayed on the chart, with the corresponding probability and the number of times the cycle was detected. The color varies from intense for a high probability (75%), to light for a low probability (53%)
We will call this signal "cyclic anomalies"
By default, as shown in the indicator presentation image, the "intersection only" option is checked: only the intersection between 1) killstats and 2) cyclic anomalies is displayed. (filter +-30% of killstats signals)
MORE INFORMATIONS
/!\ : during a backtest, it is necessary to refresh the studied data to benefit from the real time signals, and for that you have to use the replay mode. if "Backtesting informations?"is checked, labels are displayed on the graph to warn of the % distortion of the signals. I recommend using the replay mode every 250 candles, and every 1000 candles for premium accounts, to have real signals.
- Alerts can be set for killzone, or intersections ( As in presentation picture)
- The ideal use is in m5. It can trigger several times a day, sometimes in opposite directions, and sometimes not trigger for several days.
- Premium account have 20k candles data, and not 5k => signals may vary depending on your tradingview subscription.

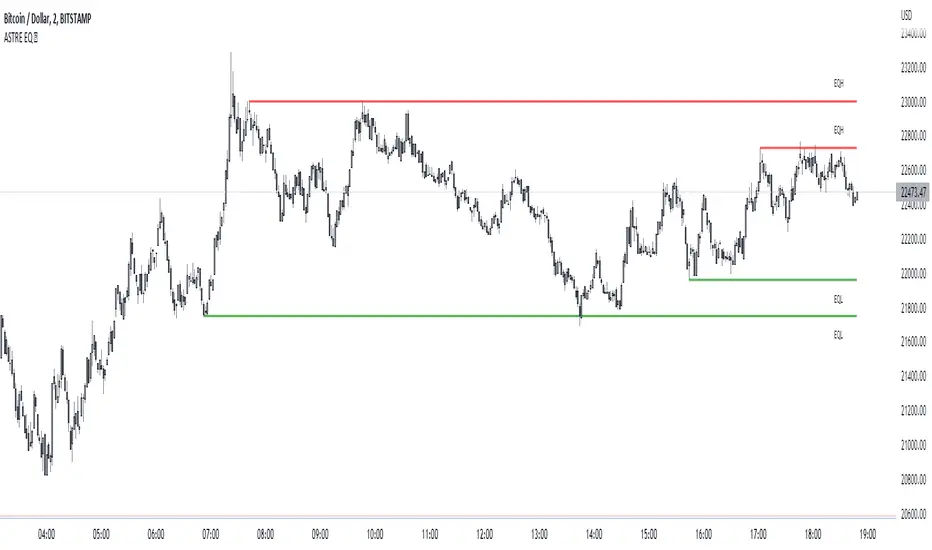
EqwhaleDisplay Equal high/ low, alert when liquidity is taken.. or created !
An innovation that flows a bit if you are an SMC trader and which was actually missing on TradingView: identification of equal high/low, alerts when liquidity is taken... or created!
Its choice in the design means that it gives more importance to the last identified pivots: that is to say that it will display more recently created liquidity than old one! Perfect for identifying market inducement mechanisms (SMC) under an area of interest. This is a typical pattern of induction and false breakout: 2 hits, the break, reintegration, and real move :
Quick exemple on BTC, you are alerted by liquidity created:
Then we grab, and deep. :)
You can display "old broken lines" for backtesting. Careful, it actually display lines when pivot is detected and broken at the same time : it's false. checks that the line has been touched twice :) So, some false lines in the backtest but it does not affect the indicator at all.
You can set number min of pivot at 1 to plot current high/low untested !
Custom GridIt's a simple little tool that enhances Tradingview's horizontal level grid. Set the range of up to 12 assets, you save your model, and the levels will show up automatically when you switch between graphs.
it is obvious to note that the market reacts on the round levels if it discovers its levels for a long time.
Where using notions of supports / resistances gives you level information once the level has been created, again you can correlate this indicator with other SMC and price action tools to identify areas of rejections or dips. institutional interventions.

Liquidity mapLocate institutional daily, weekly, and monthly liquidity intervention zones in an innovative format that allows you to fractalize the degree of trend reversal opportunity across multiple lengths!
Far from the traditional formats to tell you "where's the high/low", we display with this map the grab levels relating to the amplitudes of the measured period.
You can check "show old levels" to backtest these potential fractal reversal areas.
Use the levels that interest you according to your working UT (scalping, intraweek, swing, etc.), or take all the elements into consideration for your trading management :
Confluence the information to optimize your entry and shelter your stop loss under strong levels rejections !
Default parameters are: display high/low weekly & monthly, display liquidities levels in daily.

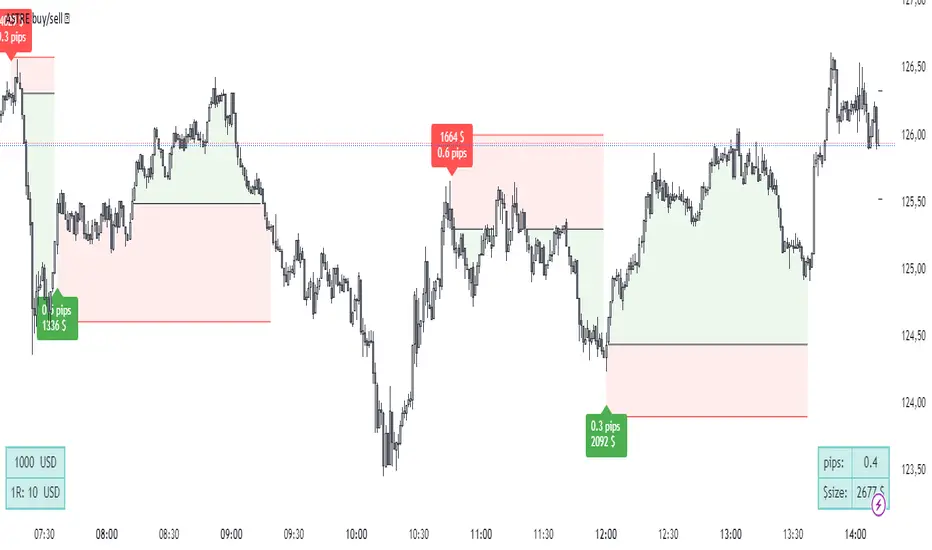
ASTRE Buy/SellWe have designed one of the best buy /sell indicators ! based on our "Reversal score" indicator, a set of strict conditions based on dynamic divergences and fisher's transformation allows to trigger buy signals. The idea is that at a certain level of technical pressure from the indicator, the market has a high probability of changing direction !
(always with the objective of capturing the best top/bottom :) )
Did you miss your trade entry? No problem! The "Barcolor retest" feature allows you to identify a perfect entry on a retest once the structure has been confirmed after a signal:
Exemple on 30s chart :
Using advice :
Use an ATR-type stop loss, or shelter behind bollinger, a short, fixed distance in pips at a minimum below the last local high/low. Your stop loss must be tight and relevant!
For take profit, I recommend that you trail stop part of your position, exit on a contrary signal, or exit part of the position at 5:1 for example.
it is recommended to lower your risk for each identical consecutive signal: 3 buy signals in a row, take a risk for example of $100 on the first, $70 on the second, $40 on the third. The idea is not to be suffocated by the multiple bad signals within the framework of a bad time frame compared to the amplitude of the trend that we seek to take against the trend!
SOON: Easier configuration for 3 commas, backtests. Stay tuned !
astre_ts can in no way be held responsible if your trading account is liquidated after having followed a buy/sell signal and used a large leverage. The signals are reversals: so many are false before having a (very) good trade. Be sure to have strict risk management, or to use a complete strategy so that your results are faithful to the backtests.
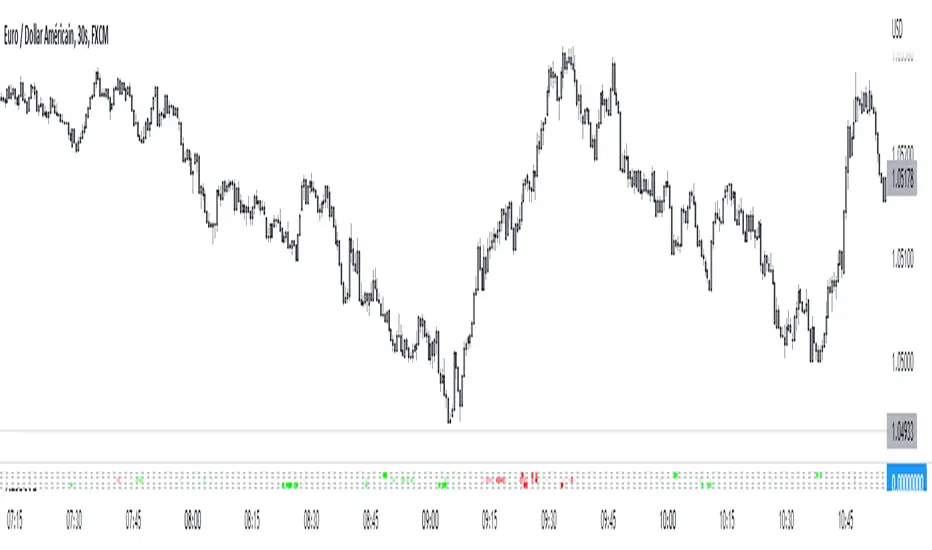
Reversal scoreDynamic divergence indicator on 3 indicators, without delays or repaints
Technological choices have been made so as not to lie to you about the signals, and so that the backtesting is perfectly faithful to reality. The market is analyzed and looks for a dynamic status of divergence on the Fisher transformation, the Money Flow Index and the MACD: if the status is "divergence", it is quantified by a divergence score to assess its potential and whose parameters are multiple (including market structure during divergence status).
At the top Reversal score, at the bottom the divergence indicator integrated in Tradingview. On this last candle, there will indeed be an RSI divergence but which will only be displayed 5 candles later, where ASTRE displays it to you in real time:
You will notice how certain spikes trigger sharp divergence – an anomaly between the movement of the price and that of the indicators is a good sign of an instant reversal, and in m2, a way to take a 2:1 TP in seconds:
Usage tip: Follow the signals in the direction of the main trend! They are much less numerous but very effective! :
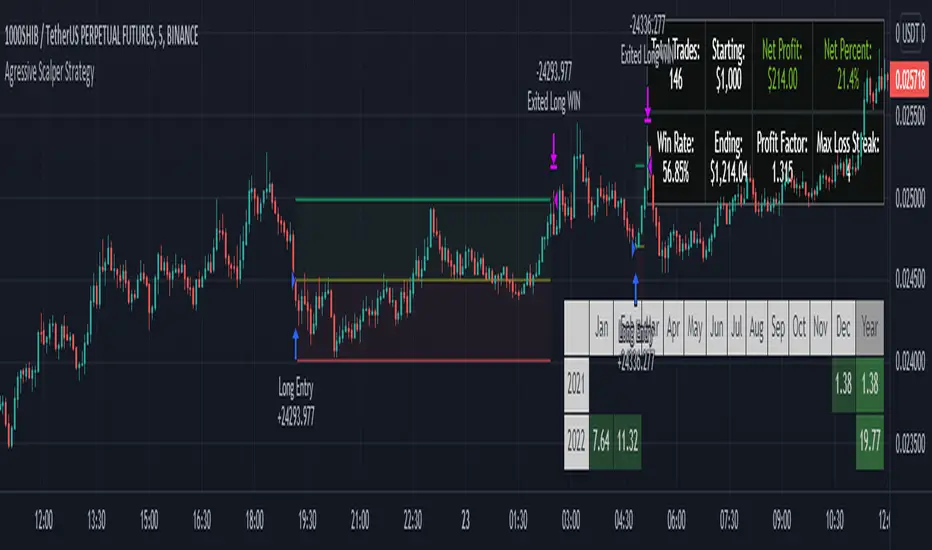
Agressive Scalper StrategyAfter many different tests and tries we found a strategy which is suited for people that likes to trade in shorter time frames. It uses multiple indications for entries. Entries include indications like Double ATR, Consolidation Detection, Dynamic RSI Calculation with Overbought and Oversold lines and also previous bars highs and lows. Although this strategy has been coded and tested on short time frames, after many additions it turns out it can be very profitable in every time frame if you play with the settings. Also it has some helpers for people that likes to optimize and see how their choices affects the outcome.
The strategy calculates the entry with the rules below:
LONG ENTRY RULES
- Price must be in consolidation zone
- Fast ATR Must be higher than Slow ATR
- Dynamic RSI must be below the oversold line (Green Line as Default)
- The Signal lookback must allow entry. (For example if you set signal lookback to 5, if the LOW of current price is LOWEST point of last 5 bars it is okay to enter LONG) If you check the lookback helper it will show you as green arrow at the bottom.
SHORT ENTRY RULES
- Price must be in consolidation zone
- Fast ATR Must be higher than Slow ATR
- Dynamic RSI must be above the overbought line (Red Line as Default)
- The Signal lookback must allow entry. (For example if you set signal lookback to 5, if the HIGHEST of current price is HIGHEST point of last 5 bars it is okay to enter SHORT) If you check the lookback helper it will show you as red arrow at the top.
This strategy has additional settings that are not available in indicator version that is previously released so i suggest everyone to use this instead.
Happy trading everyone!
Agressive ScalperThis indicator I thought after a while of research and decided to code for people that wants to scalp on low time frames. It's recommended to use it in 1 to 5 min timeframes. It uses ATR, Past high and lows and stochastic overbought and oversold zones along with some consolidation code to avoid fast swings. I also added Take Profit and Stop Loss signals based on slow ATR values. I may add more features later on if people find it useful.
