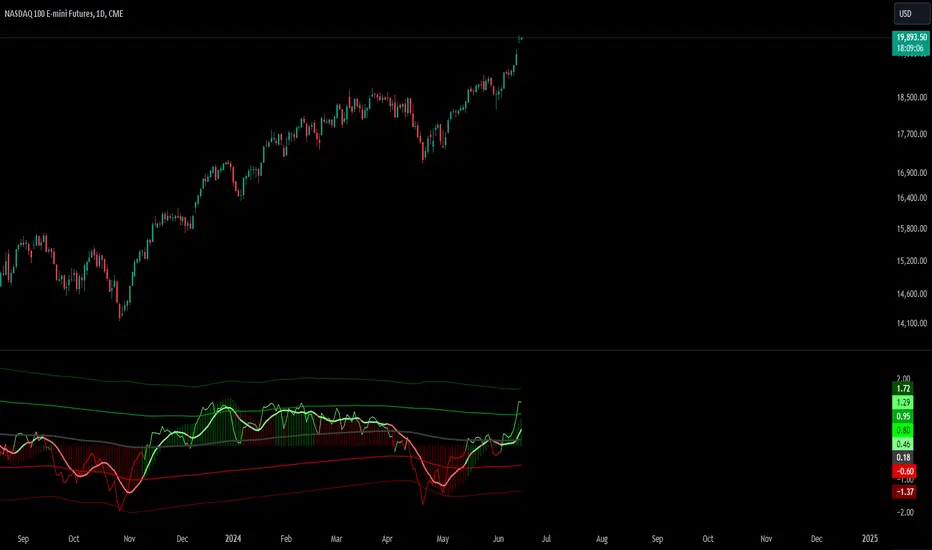
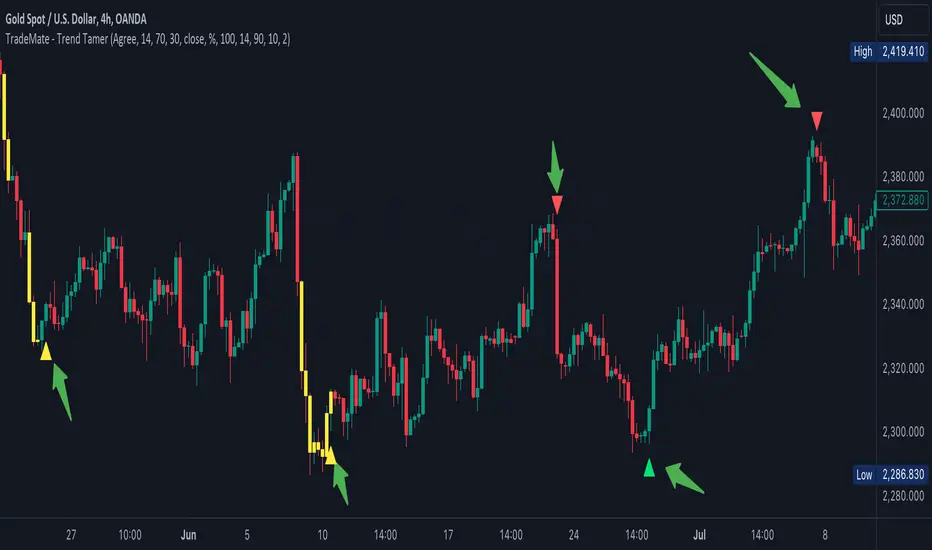
TradeMate - Trend TamerTradeMate Trend Tamer
The TradeMate Trend Tamer is designed to help traders identify potential trend reversals and navigate periods of high market volatility. This tool combines a custom EMA-based oscillator with a volatility detection mechanism, providing traders with actionable signals that are easy to interpret and apply.
🔶 Originality and Utility
The TradeMate Trend Tamer is not just a mashup of indicators but a well-integrated system that enhances the reliability of trend detection. The core of this indicator is a custom EMA calculation that identifies trend shifts based on price momentum and directional changes. This EMA is further enhanced by a volatility detection system that colors bars yellow during periods of high volatility, indicating potential market reversals.
The indicator is particularly useful for traders who are looking for clear and straightforward signals to identify buying and selling opportunities, especially in volatile markets where traditional indicators might produce false signals. By combining trend arrows with volatility signals, the TradeMate Trend Tamer helps traders confirm the strength of a signal and avoid getting caught in market noise.
🔶 Description and Underlying Logic
The TradeMate Trend Tamer uses a custom EMA calculation that smooths price movements to detect significant shifts in momentum. This EMA is plotted on the chart and is complemented by arrows indicating potential buy or sell signals:
Upward Arrows: These appear when the EMA indicates an upward momentum shift, suggesting a potential buying opportunity.
Downward Arrows: These indicate a downward momentum shift, signaling a potential selling opportunity.
The volatility detection mechanism works by analyzing the ATR (Average True Range) over a specified lookback period. The indicator identifies extreme volatility zones where the ATR exceeds a certain threshold, coloring the bars yellow to visually alert traders. This helps traders identify when the market is more likely to reverse, making the combination of trend arrows and volatility signals a powerful tool for decision-making.
🔶 Using the TradeMate Trend Tamer
Traders should use the trend arrows as an initial signal and confirm it with the yellow-colored volatility bars. For example:
High Volatility with Upward Arrow: Indicates a strong buy signal as the market is likely to reverse upwards.
High Volatility with Downward Arrow: Indicates a strong sell signal, suggesting a potential downward reversal.
By following these signals, traders can enhance their entry and exit strategies, especially in markets prone to sudden moves.
A-trend
Polynomial Regression Keltner Channel [ChartPrime]Polynomial Regression Keltner Channel
⯁ OVERVIEW
The Polynomial Regression Keltner Channel [ ChartPrime ] indicator is an advanced technical analysis tool that combines polynomial regression with dynamic Keltner Channels. This indicator provides traders with a sophisticated method for trend analysis, volatility assessment, and identifying potential overbought and oversold conditions.
◆ KEY FEATURES
Polynomial Regression: Uses polynomial regression for trend analysis and channel basis calculation.
Dynamic Keltner Channels: Implements Keltner Channels with adaptive volatility-based bands.
Overbought/Oversold Detection: Provides visual cues for potential overbought and oversold market conditions.
Trend Identification: Offers clear trend direction signals and change indicators.
Multiple Band Levels: Displays four levels of upper and lower bands for detailed market structure analysis.
Customizable Visualization: Allows toggling of additional indicator lines and signals for enhanced chart analysis.
◆ FUNCTIONALITY DETAILS
⬥ Polynomial Regression Calculation:
Implements a custom polynomial regression function for trend analysis.
Serves as the basis for the Keltner Channel, providing a smoothed centerline.
//@function Calculates polynomial regression
//@param src (series float) Source price series
//@param length (int) Lookback period
//@returns (float) Polynomial regression value for the current bar
polynomial_regression(src, length) =>
sumX = 0.0
sumY = 0.0
sumXY = 0.0
sumX2 = 0.0
sumX3 = 0.0
sumX4 = 0.0
sumX2Y = 0.0
n = float(length)
for i = 0 to n - 1
x = float(i)
y = src
sumX += x
sumY += y
sumXY += x * y
sumX2 += x * x
sumX3 += x * x * x
sumX4 += x * x * x * x
sumX2Y += x * x * y
slope = (n * sumXY - sumX * sumY) / (n * sumX2 - sumX * sumX)
intercept = (sumY - slope * sumX) / n
n - 1 * slope + intercept
⬥ Dynamic Keltner Channel Bands:
Calculates ATR-based volatility for dynamic band width adjustment.
Uses a base multiplier and adaptive volatility factor for flexible band calculation.
Generates four levels of upper and lower bands for detailed market structure analysis.
atr = ta.atr(length)
atr_sma = ta.sma(atr, 10)
// Calculate Keltner Channel Bands
dynamicMultiplier = (1 + (atr / atr_sma)) * baseATRMultiplier
volatility_basis = (1 + (atr / atr_sma)) * dynamicMultiplier * atr
⬥ Overbought/Oversold Indicator line and Trend Line:
Calculates an OB/OS value based on the price position relative to the innermost bands.
Provides visual representation through color gradients and optional signal markers.
Determines trend direction based on the polynomial regression line movement.
Generates signals for trend changes, overbought/oversold conditions, and band crossovers.
◆ USAGE
Trend Analysis: Use the color and direction of the basis line to identify overall trend direction.
Volatility Assessment: The width and expansion/contraction of the bands indicate market volatility.
Support/Resistance Levels: Multiple band levels can serve as potential support and resistance areas.
Overbought/Oversold Trading: Utilize OB/OS signals for potential reversal or pullback trades.
Breakout Detection: Monitor price crossovers of the outermost bands for potential breakout trades.
⯁ USER INPUTS
Length: Sets the lookback period for calculations (default: 100).
Source: Defines the price data used for calculations (default: HLC3).
Base ATR Multiplier: Adjusts the base width of the Keltner Channels (default: 0.1).
Indicator Lines: Toggle to show additional indicator lines and signals (default: false).
⯁ TECHNICAL NOTES
Implements a custom polynomial regression function for efficient trend calculation.
Uses dynamic ATR-based volatility adjustment for adaptive channel width.
Employs color gradients and opacity levels for intuitive visual representation of market conditions.
Utilizes Pine Script's plotchar function for efficient rendering of signals and heatmaps.
The Polynomial Regression Keltner Channel indicator offers traders a sophisticated tool for trend analysis, volatility assessment, and trade signal generation. By combining polynomial regression with dynamic Keltner Channels, it provides a comprehensive view of market structure and potential trading opportunities. The indicator's adaptability to different market conditions and its customizable nature make it suitable for various trading styles and timeframes.

Bias Finder [UAlgo]The "Bias Finder " indicator is a tool designed to help traders identify market bias and trends effectively. This indicator leverages smoothed Heikin Ashi candles and oscillators to provide a clear visual representation of market trends and potential reversals. By utilizing higher timeframes and smoothing techniques, the indicator aims to filter out market noise and offer a more reliable signal for trading decisions.
🔶 Key Features
Heikin Ashi Candles: The indicator uses Heikin Ashi candles, a special type of candlestick that incorporates information from the previous candle to potentially provide smoother visuals and highlight potential trend direction.
Oscillator: The indicator calculates an oscillator based on the difference between the smoothed opening and closing prices of a higher timeframe. This oscillator helps visualize the strength of the bias.
Light Teal: Strong bullish trend.
Dark Teal: Weakening bullish trend.
Light Red: Strong bearish trend.
Dark Red: Weakening bearish trend.
Standard Deviation: The indicator can optionally display upper and lower standard deviation bands based on the Heikin Ashi high and low prices. These bands can help identify potential breakout areas.
Oscillator Period: Adjust the sensitivity of the oscillator.
Higher Timeframe: Select a timeframe for the Heikin Ashi candles and oscillator calculations (must be equal to or greater than the chart's timeframe).
Display Options: Choose whether to display Heikin Ashi candles, market bias fill, standard deviation bands, and HA candle colors based on the bias.
Alerts: Enable/disable specific alerts and customize their messages.
🔶 Disclaimer
Use with Caution: This indicator is provided for educational and informational purposes only and should not be considered as financial advice. Users should exercise caution and perform their own analysis before making trading decisions based on the indicator's signals.
Not Financial Advice: The information provided by this indicator does not constitute financial advice, and the creator (UAlgo) shall not be held responsible for any trading losses incurred as a result of using this indicator.
Backtesting Recommended: Traders are encouraged to backtest the indicator thoroughly on historical data before using it in live trading to assess its performance and suitability for their trading strategies.
Risk Management: Trading involves inherent risks, and users should implement proper risk management strategies, including but not limited to stop-loss orders and position sizing, to mitigate potential losses.
No Guarantees: The accuracy and reliability of the indicator's signals cannot be guaranteed, as they are based on historical price data and past performance may not be indicative of future results.

LOWESS (Locally Weighted Scatterplot Smoothing) [ChartPrime]LOWESS (Locally Weighted Scatterplot Smoothing)
⯁ OVERVIEW
The LOWESS (Locally Weighted Scatterplot Smoothing) [ ChartPrime ] indicator is an advanced technical analysis tool that combines LOWESS smoothing with a Modified Adaptive Gaussian Moving Average. This indicator provides traders with a sophisticated method for trend analysis, pivot point identification, and breakout detection.
◆ KEY FEATURES
LOWESS Smoothing: Implements Locally Weighted Scatterplot Smoothing for trend analysis.
Modified Adaptive Gaussian Moving Average: Incorporates a volatility-adapted Gaussian MA for enhanced trend detection.
Pivot Point Identification: Detects and visualizes significant pivot highs and lows.
Breakout Detection: Tracks and optionally displays the count of consecutive breakouts.
Gaussian Scatterplot: Offers a unique visualization of price movements using randomly colored points.
Customizable Parameters: Allows users to adjust calculation length, pivot detection, and visualization options.
◆ FUNCTIONALITY DETAILS
⬥ LOWESS Calculation:
Utilizes a weighted local regression to smooth price data.
Adapts to local trends, reducing noise while preserving important price movements.
⬥ Modified Adaptive Gaussian Moving Average:
Combines Gaussian weighting with volatility adaptation using ATR and standard deviation.
Smooths the Gaussian MA using LOWESS for enhanced trend visualization.
⬥ Pivot Point Detection and Visualization:
Identifies pivot highs and lows using customizable left and right bar counts.
Draws lines and labels to mark broke pivot points on the chart.
⬥ Breakout Tracking:
Monitors price crossovers of pivot lines to detect breakouts.
Optionally displays and updates the count of consecutive breakouts.
◆ USAGE
Trend Analysis: Use the color and direction of the smoothed Gaussian MA line to identify overall trend direction.
Breakout Trading: Monitor breakouts from pivot levels and their persistence using the breakout count feature.
Volatility Assessment: The spread of the Gaussian scatterplot can provide insights into market volatility.
⯁ USER INPUTS
Length: Sets the lookback period for LOWESS and Gaussian MA calculations (default: 30).
Pivot Length: Determines the number of bars to the left for pivot calculation (default: 5).
Count Breaks: Toggle to show the count of consecutive breakouts (default: false).
Gaussian Scatterplot: Toggle to display the Gaussian MA as a scatterplot (default: true).
⯁ TECHNICAL NOTES
Implements a custom LOWESS function for efficient local regression smoothing.
Uses a modified Gaussian MA calculation that adapts to market volatility.
Employs Pine Script's line and label drawing capabilities for clear pivot point visualization.
Utilizes random color generation for the Gaussian scatterplot to enhance visual distinction between different time periods.
The LOWESS (Locally Weighted Scatterplot Smoothing) indicator offers traders a sophisticated tool for trend analysis and breakout detection. By combining advanced smoothing techniques with pivot point analysis, it provides a comprehensive view of market dynamics. The indicator's adaptability to different market conditions and its customizable nature make it suitable for various trading styles and timeframes.

Brooks Always In [KintsugiTrading]Brooks Always In
Overview:
The "Brooks Always In Indicator" by KintsugiTrading is a tool designed for traders who follow price action methodologies inspired by Al Brooks. This indicator identifies key bar patterns and breakouts, plots an Exponential Moving Average (EMA), and highlights consecutive bullish and bearish bars. It is intended to assist traders in making informed decisions based on price action dynamics.
Features:
Consecutive Bar Patterns:
Identifies and highlights consecutive bullish and bearish bars.
Differentiates between bars that are above/below the EMA and those that are not.
Customizable EMA:
Option to display an Exponential Moving Average (EMA) with user-defined length and offset.
The EMA can be smoothed using various methods such as SMA, EMA, SMMA (RMA), WMA, and VWMA.
Breakout Patterns:
Recognizes bullish and bearish breakout bars and outside bars.
Tracks inside bars and prior bar conditions to better understand the market context.
Customizable Display:
Users can display or hide the EMA, consecutive bar patterns, and consecutive bars relative to the moving average.
How to Use:
Customize Settings:
First, I like to navigate to the top right corner of the chart (bolt icon), and change both the bull and bear body color to match the background (white/black) - this helps the user visualize the indicator far better.
Next, Toggle to display EMA, consecutive bar patterns, and consecutive bars relative to the moving average using the provided input options.
Adjust the EMA length, source, and offset as per your trading strategy.
Select the smoothing method and length for the EMA if desired.
Analyze Key Patterns:
Observe the highlighted bars on the chart to identify consecutive bullish and bearish patterns.
Use the plotted EMA to gauge the general trend and analyze the relationship between price bars and the moving average.
Informed Decision Making:
Utilize the identified bar patterns and breakouts to make informed trading decisions, such as identifying potential entry and exit points based on price action dynamics.
Good luck with your trading!

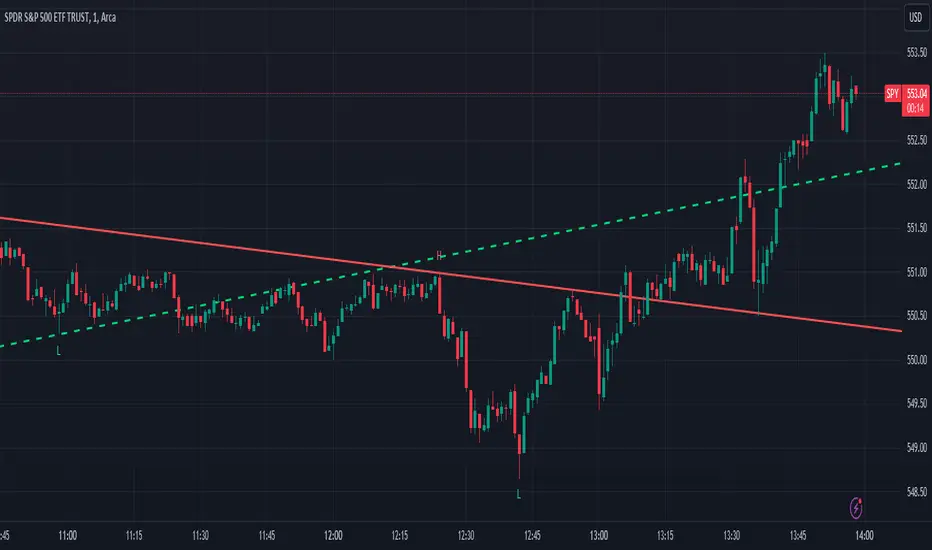
Trend LinesThis script, titled "Trend Lines," is designed to detect and plot significant trend lines on a TradingView chart, based on pivot points. It highlights both uptrend and downtrend lines using different colors and allows customization of line styles, including color and thickness. Here's a breakdown of how the script works:
Inputs
Left Bars (lb) and Right Bars (rb): These inputs determine the number of bars to the left and right of a pivot point used to identify significant highs and lows.
Show Pivot Points: A boolean input to display markers at detected pivot points on the chart.
Show Old Line as Dashed: A boolean input to display older trend lines as dashed for visual distinction.
Uptrend Line Color (ucolor) and Downtrend Line Color (dcolor): Color inputs to customize the appearance of uptrend and downtrend lines.
Uptrend Line Thickness (uthickness) and Downtrend Line Thickness (dthickness): Inputs to adjust the thickness of the trend lines.
Calculations
Pivot Highs and Lows: The script calculates potential pivot highs and lows by looking at lb bars to the left and rb bars to the right. If a bar's high is the highest (or low is the lowest) within this window, it is considered a pivot point.
Trend Lines: The script connects the most recent and previous pivot highs to form downtrend lines, and the most recent and previous pivot lows to form uptrend lines. These lines are drawn with the specified color and thickness.
Angles: The angle of each trend line is calculated to determine whether the trend is strengthening or weakening. If the trend changes significantly, the line's extension is adjusted accordingly.
Plotting
Pivot Point Markers: If Show Pivot Points is enabled, markers labeled "H" for highs and "L" for lows are plotted at the pivot points.
Trend Lines: The script draws lines between pivot points, coloring them according to the trend direction (uptrend or downtrend). If Show Old Line as Dashed is enabled, the script sets older lines to a dashed style to indicate they are no longer the most recent trend lines.
This script is useful for traders who want to visually identify key support and resistance levels based on historical price action, helping them to make more informed trading decisions. The customization options allow traders to tailor the appearance of the trend lines to suit their personal preferences or charting style.
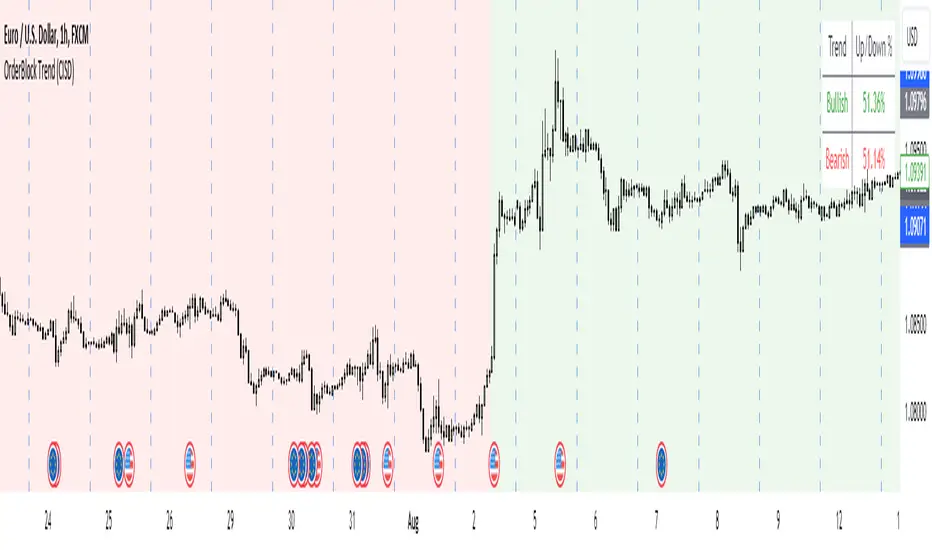
OrderBlock Trend (CISD)OrderBlock Trend (CISD) Indicator
Overview:
The "OrderBlock Trend (CISD)" AKA: change in state of delivery by ICT inner circle trader this indicator is designed to help traders identify and visualize market trends based on higher timeframe candle behavior. This script leverages the concept of order blocks, which are price levels where significant buying or selling activity has occurred, to signal potential trend reversals or continuations. By analyzing bullish and bearish order blocks on a higher timeframe, the indicator provides visual cues and statistical insights into the market's current trend dynamics.
Key Features:
Higher Timeframe Analysis: The indicator uses a higher timeframe (e.g., Daily) to assess the trend direction based on the open and close prices of candles. This approach helps in identifying more significant and reliable trend changes, filtering out noise from lower timeframes.
Bullish and Bearish Order Blocks: The script detects the first bullish or bearish candle on the selected higher timeframe and uses these candles as reference points (order blocks) to determine the trend direction. A bullish trend is indicated when the current price is above the last bearish order block's open price, and a bearish trend is indicated when the price is below the last bullish order block's open price.
Visual Trend Indication: The indicator visually represents the trend using background colors and plot shapes:
A green background and a square shape above the bars indicate a bullish trend.
A red background and a square shape above the bars indicate a bearish trend.
Candle Count and Statistics: The script keeps track of the number of up and down candles during bullish and bearish trends, providing percentages of up and down candles in each trend. This data is displayed in a table, giving traders a quick overview of market sentiment during each trend phase.
User Customization: The higher timeframe can be adjusted according to the trader's preference, allowing flexibility in trend analysis based on different time horizons.
Concepts and Calculations:
The "OrderBlock Trend (CISD)" indicator is based on the concept of order blocks, a key area where institutional traders are believed to place large orders, creating significant support or resistance levels. By identifying these blocks on a higher timeframe, the indicator aims to highlight potential trend reversals or continuations. The use of higher timeframe data helps filter out minor fluctuations and focus on more meaningful price movements.
The candle count and percentage calculations provide additional context, allowing traders to understand the proportion of bullish or bearish candles within each trend. This information can be useful for assessing the strength and consistency of a trend.
How to Use:
Select the Higher Timeframe: Choose the higher timeframe (e.g., Daily) that best suits your trading strategy. The default setting is "D" (Daily), but it can be adjusted to other timeframes as needed.
Interpret the Trend Signals:
A green background indicates a bullish trend, while a red background indicates a bearish trend. The corresponding square shapes above the bars reinforce these signals.
Use the information on the proportion of up and down candles during each trend to gauge the trend's strength and consistency.
Trading Decisions: The indicator can be used in conjunction with other technical analysis tools and indicators to make informed trading decisions. It is particularly useful for identifying trend reversals and potential entry or exit points based on the behavior of higher timeframe order blocks.
Customization and Optimization: Experiment with different higher timeframes and settings to optimize the indicator for your specific trading style and preferences.
Conclusion:
The "OrderBlock Trend (CISD)" indicator offers a comprehensive approach to trend analysis, combining the power of higher timeframe order blocks with clear visual cues and statistical insights. By understanding the underlying concepts and utilizing the provided features, traders can enhance their trend detection and decision-making processes in the markets.
Disclaimer:
This indicator is intended for educational purposes and should be used in conjunction with other analysis methods. Always perform your own research and risk management before making trading decisions.
Some known bugs when you switch to lower timeframe while using daily timeframe data it didn't use the daily candle close to establish the trend change but your current time frame If some of you know how to fix it that would be great if you help me to I would try my best to fix this in the future :) credit to ChatGPT 4o
Momentum Trend [MT]The Momentum Trend indicator is an innovative technical analysis tool designed to capture and visualize momentum trends in financial markets. This advanced indicator goes beyond traditional momentum measures, offering a unique perspective on price action and trend strength.
Core Functionality:
Trend Momentum Index (TMI) Calculation:
At the heart of this indicator is the Trend Momentum Index (TMI), a proprietary algorithm that combines moving averages with price action analysis to gauge momentum. The TMI is calculated using a user-defined source, length, and moving average type.
Dynamic Trend Visualization:
The indicator uses a color-coded column plot to represent the TMI values, providing an intuitive visual representation of trend strength and direction. The colors change based on specific conditions, offering instant insights into the current market state.
Adaptive Momentum Analysis:
The TMI adapts to changing market conditions by comparing current values to historical ones, allowing for a more nuanced understanding of momentum shifts.
Key Inputs and Their Significance:
TMI Source:
Allows users to select the price data for TMI calculations. The default is the closing price, but users can choose alternative sources for different analytical perspectives.
TMI Length:
Defines the lookback period for the TMI calculation. The default of 8 provides a balance between responsiveness and stability, but users can adjust this to suit their trading style.
Moving Average Type:
Users can select from various moving average types (SMA, EMA, SMMA, WMA, VWMA) for the base calculation, allowing for customization based on trading preferences.
What Makes It Unique:
Comprehensive Momentum Analysis:
The TMI combines elements of trend following and momentum, providing a more holistic view of market dynamics than traditional momentum indicators.
Multi-Faceted Trend Identification:
The color-coding system doesn't just show bullish or bearish trends, but also identifies accelerating and decelerating momentum in both directions.
Flexible Moving Average Integration:
The ability to choose different moving average types allows traders to fine-tune the indicator's responsiveness and smoothness.
Visual Clarity:
The column-style plot with color changes offers clear, at-a-glance insights into trend strength and direction.
Momentum Comparison Logic:
The indicator incorporates logic to compare current momentum changes with recent historical changes, providing context for the current market state.
The Momentum Trend indicator represents a sophisticated approach to momentum and trend analysis. By combining moving averages, price action, and comparative momentum logic, it offers traders a powerful tool for identifying potential trend continuations, reversals, and momentum shifts.
This indicator is particularly valuable for traders looking to:
- Identify the start of new trends
- Spot potential trend reversals
- Gauge the strength of ongoing trends
- Time entries and exits based on momentum shifts

Crab Harmonic Pattern [TradingFinder] Harmonic Chart patterns🔵 Introduction
The Crab pattern is recognized as a reversal pattern in technical analysis, utilizing Fibonacci numbers and percentages for chart analysis. This pattern can predict suitable price reversal areas on charts using Fibonacci ratios.
The structure of the Crab pattern can manifest in both bullish and bearish forms on the chart. By analyzing this structure, traders can identify points where the price direction changes, which are essential for making informed trading decisions.
The pattern's structure is visually represented on charts as shown below. To gain a deeper understanding of the Crab pattern's functionality, it is beneficial to become familiar with its various harmonic forms.
🟣 Types of Crab Patterns
The Crab pattern is categorized into two types based on its structure: bullish and bearish. The bullish Crab is denoted by the letter M, while the bearish Crab is indicated by the letter W in technical analysis.
Typically, a bullish Crab pattern signals a potential price increase, whereas a bearish Crab pattern suggests a potential price decrease on the chart.
The direction of price movement depends significantly on the price's position within the chart. By identifying whether the pattern is bullish or bearish, traders can determine the likely direction of the price reversal.
Bullish Crab :
Bearish Crab :
🔵 How to Use
When trading using the Crab pattern, crucial parameters include the end time of the correction and the point at which the chart reaches its peak. Generally, the best time to buy is when the chart nears the end of its correction, and the best time to sell is when it approaches the peak price.
As we discussed, the end of the price correction and the time to reach the peak are measured using Fibonacci ratios. By analyzing these levels, traders can estimate the end of the correction in the chart waves and select a buying position for their stock or asset upon reaching that ratio.
🟣 Bullish Crab Pattern
In this pattern, the stock price is expected to rise at the pattern's completion, transitioning into an upward trend. The bullish Crab pattern usually begins with an upward trend, followed by a price correction, after which the stock resumes its upward movement.
If a deeper correction occurs, the price will change direction at some point on the chart and rise again towards its target price. Price corrections play a critical role in this pattern, as it aims to identify entry and exit points using Fibonacci ratios, allowing traders to make purchases at the end of the corrections.
When the price movement lines are connected on the chart, the bullish Crab pattern resembles the letter M.
🟣 Bearish Crab Pattern
In this pattern, the stock price is expected to decline at the pattern's completion, leading to a strong downward trend. The bearish Crab pattern typically starts with a price correction in a downward trend and, after several fluctuations, reaches a peak where the direction changes downward, resulting in a significant price drop.
This pattern uses Fibonacci ratios to identify points where the price movement is likely to change direction, enabling traders to exit their positions at the chart's peak. When the price movement lines are connected on the chart, the bearish Crab pattern resembles the letter W.
🔵 Setting
🟣 Logical Setting
ZigZag Pivot Period : You can adjust the period so that the harmonic patterns are adjusted according to the pivot period you want. This factor is the most important parameter in pattern recognition.
Show Valid Format : If this parameter is on "On" mode, only patterns will be displayed that they have exact format and no noise can be seen in them. If "Off" is, the patterns displayed that maybe are noisy and do not exactly correspond to the original pattern.
Show Formation Last Pivot Confirm : if Turned on, you can see this ability of patterns when their last pivot is formed. If this feature is off, it will see the patterns as soon as they are formed. The advantage of this option being clear is less formation of fielded patterns, and it is accompanied by the latest pattern seeing and a sharp reduction in reward to risk.
Period of Formation Last Pivot : Using this parameter you can determine that the last pivot is based on Pivot period.
🟣 Genaral Setting
Show : Enter "On" to display the template and "Off" to not display the template.
Color : Enter the desired color to draw the pattern in this parameter.
LineWidth : You can enter the number 1 or numbers higher than one to adjust the thickness of the drawing lines. This number must be an integer and increases with increasing thickness.
LabelSize : You can adjust the size of the labels by using the "size.auto", "size.tiny", "size.smal", "size.normal", "size.large" or "size.huge" entries.
🟣 Alert Setting
Alert : On / Off
Message Frequency : This string parameter defines the announcement frequency. Choices include: "All" (activates the alert every time the function is called), "Once Per Bar" (activates the alert only on the first call within the bar), and "Once Per Bar Close" (the alert is activated only by a call at the last script execution of the real-time bar upon closing). The default setting is "Once per Bar".
Show Alert Time by Time Zone : The date, hour, and minute you receive in alert messages can be based on any time zone you choose. For example, if you want New York time, you should enter "UTC-4". This input is set to the time zone "UTC" by default.

TrendMaster ProTrendMaster Pro: A Comprehensive Trend Analysis Tool for Long-Term Investors
TrendMaster Pro is an advanced technical indicator designed to provide long-term investors with a robust and comprehensive analysis of market trends. This sophisticated tool operates exclusively on daily timeframes, making it ideal for those focused on long-term investment strategies. By combining multiple analytical approaches, TrendMaster Pro offers investors a powerful means to assess trend quality and make informed decisions.
Automatic Trend Detection
At the heart of TrendMaster Pro lies its ability to automatically identify the most statistically significant trend. The indicator analyzes various timeframes ranging from 1000 to 5000 days, selecting the one that exhibits the highest correlation. This feature ensures that investors are always working with the most relevant trend data, eliminating the subjectivity often associated with manual trend identification.
The trend detection algorithm employs a regression analysis approach, evaluating approximately 80,000 different trend alternatives each day. Each potential trend is assigned a score based on criteria such as trend density, deviation from regression, and the number of price points near the trend's floor and ceiling. The trend with the highest score is then selected and displayed on the chart.
Comprehensive Scoring System
TrendMaster Pro employs a multi-faceted scoring system that evaluates four key aspects of a trend, providing a holistic view of its quality and potential. Each aspect is scored on a scale of 0 to 10, with the overall trend quality score being a weighted average of these individual scores.
1. Length Score
The Length Score measures the duration of the detected trend. Longer trends receive higher scores, reflecting increased reliability and significance. This score is calculated by normalizing the auto-selected period (which ranges from 1000 to 5000 days) to a scale of 5 to 10.
For example, if the auto-selected period is 3000 days, it would receive a score of around 7.5. This emphasizes the importance of long-term trends in investment decision-making, as they tend to be more stable and indicative of underlying market forces.
2. Strength Score
The Strength Score utilizes Pearson's Correlation Coefficient to assess trend strength. This statistical measure gauges the linear relationship between price and trend projection. A value closer to 1 indicates a strong positive correlation, reinforcing confidence in the trend direction based on historical price movements.
The indicator translates the Pearson's Correlation Coefficient into a score from 0 to 10. For instance, a correlation coefficient of 0.95 might translate to a Strength Score of 8, indicating a strong and reliable trend.
3. Performance Score
The Performance Score compares the asset's Compound Annual Growth Rate (CAGR) to a chosen benchmark, typically a major index like the S&P 500. This score provides insight into how well the asset is performing relative to the broader market.
The CAGR is calculated using the formula: CAGR = (Ending Value / Beginning Value)^(1/n) - 1, where n is the number of years. The Performance Score is then determined by comparing this CAGR to the benchmark's CAGR over the same period. A higher score indicates outperformance relative to the benchmark.
4. Level Score
The Level Score evaluates the current price position within the trend channel. Lower prices within the channel receive higher scores, suggesting potential value or buying opportunities. This score helps identify possible entry points based on historical trend behavior.
For example, if the current price is near the lower boundary of the trend channel, it might receive a Level Score of 9, indicating a potentially attractive entry point.
Visual Representation
TrendMaster Pro provides a clear visual representation of the detected trend by displaying a regression channel on the chart. This channel consists of three lines: a middle line representing the main trend, and upper and lower lines representing standard deviations from the main trend.
The channel offers a quick visual reference for support and resistance levels, helping investors identify potential entry and exit points. The color and style of these lines can be customized to suit individual preferences.
Detailed Information Table
A comprehensive table presents all scores and relevant data, allowing for quick and easy interpretation of the trend analysis. This table includes:
The auto-selected trend length
The Pearson's Correlation Coefficient
The asset's CAGR and the benchmark's CAGR
Individual scores for Length, Strength, Performance, and Level
The overall Trend Quality Score
This table provides investors with a clear, at-a-glance summary of the trend's key characteristics and quality.
Practical Application
To use TrendMaster Pro effectively, investors should consider the following:
Focus on the overall Trend Quality Score as a primary indicator of trend strength and reliability.
Use the Length Score to gauge the trend's longevity and potential stability.
Pay attention to the Strength Score to assess how well the price action aligns with the identified trend.
Utilize the Performance Score to compare the asset's performance against the broader market.
Consider the Level Score when timing entries, looking for opportunities when prices are relatively low within the trend channel.
Use the visual trend channel as a guide for potential support and resistance levels.
Limitations and Considerations
While TrendMaster Pro offers powerful insights, it's important to remember that no indicator can predict future market movements with certainty. The tool should be used in conjunction with fundamental analysis and other market information.
Additionally, as the indicator is designed for daily charts and long-term analysis, it may not be suitable for short-term trading strategies. Users should also be aware that past performance does not guarantee future results, even with strong trend indications.
Conclusion
TrendMaster Pro represents a significant advancement in trend analysis for long-term investors. By combining automatic trend detection, comprehensive scoring, and benchmark comparison, it offers a powerful tool for those seeking to make informed, data-driven investment decisions. Its ability to objectively assess trend quality across multiple dimensions provides investors with a valuable edge in navigating complex market conditions.
For investors looking to deepen their understanding of market trends and enhance their long-term investment strategies, TrendMaster Pro offers a sophisticated yet accessible solution. As with any investment tool, users are encouraged to thoroughly familiarize themselves with its features and interpret its outputs in the context of their overall investment approach.

CofG Oscillator w/ Added Normalizations/TransformationsThis indicator is a unique study in normalization/transformation techniques, which are applied to the CG (center of gravity) Oscillator, a popular oscillator made by John Ehlers.
The idea to transform the data from this oscillator originated from observing the original indicator, which exhibited numerous whips. Curious about the potential outcomes, I began experimenting with various normalization/transformation methods and discovered a plethora of interesting results.
The indicator offers 10 different types of normalization/transformation, each with its own set of benefits and drawbacks. My personal favorites are the Quantile Transformation , which converts the dataset into one that is mostly normally distributed, and the Z-Score , which I have found tends to provide better signaling than the original indicator.
I've also included the option of showing the mean, median, and mode of the data over the period specified by the transformation period. Using this will allow you to gather additional insights into how these transformations effect the distribution of the data series.
I've also included some notes on what each transformation does, how it is useful, where it fails, and what I've found to be the best inputs for it (though I'd encourage you to play around with it yourself).
Types of Normalization/Transformation:
1. Z-Score
Overview: Standardizes the data by subtracting the mean and dividing by the standard deviation.
Benefits: Centers the data around 0 with a standard deviation of 1, reducing the impact of outliers.
Disadvantages: Works best on data that is normally distributed
Notes: Best used with a mid-longer transformation period.
2. Min-Max
Overview: Scales the data to fit within a specified range, typically 0 to 1.
Benefits: Simple and fast to compute, preserves the relationships among data points.
Disadvantages: Sensitive to outliers, which can skew the normalization.
Notes: Best used with mid-longer transformation period.
3. Decimal Scaling
Overview: Normalizes data by moving the decimal point of values.
Benefits: Simple and straightforward, useful for data with varying scales.
Disadvantages: Not commonly used, less intuitive, less advantageous.
Notes: Best used with a mid-longer transformation period.
4. Mean Normalization
Overview: Subtracts the mean and divides by the range (max - min).
Benefits: Centers data around 0, making it easier to compare different datasets.
Disadvantages: Can be affected by outliers, which influence the range.
Notes: Best used with a mid-longer transformation period.
5. Log Transformation
Overview: Applies the logarithm function to compress the data range.
Benefits: Reduces skewness, making the data more normally distributed.
Disadvantages: Only applicable to positive data, breaks on zero and negative values.
Notes: Works with varied transformation period.
6. Max Abs Scaler
Overview: Scales each feature by its maximum absolute value.
Benefits: Retains sparsity and is robust to large outliers.
Disadvantages: Only shifts data to the range , which might not always be desirable.
Notes: Best used with a mid-longer transformation period.
7. Robust Scaler
Overview: Uses the median and the interquartile range for scaling.
Benefits: Robust to outliers, does not shift data as much as other methods.
Disadvantages: May not perform well with small datasets.
Notes: Best used with a longer transformation period.
8. Feature Scaling to Unit Norm
Overview: Scales data such that the norm (magnitude) of each feature is 1.
Benefits: Useful for models that rely on the magnitude of feature vectors.
Disadvantages: Sensitive to outliers, which can disproportionately affect the norm. Not normally used in this context, though it provides some interesting transformations.
Notes: Best used with a shorter transformation period.
9. Logistic Function
Overview: Applies the logistic function to squash data into the range .
Benefits: Smoothly compresses extreme values, handling skewed distributions well.
Disadvantages: May not preserve the relative distances between data points as effectively.
Notes: Best used with a shorter transformation period. This feature is actually two layered, we first put it through the mean normalization to ensure that it's generally centered around 0.
10. Quantile Transformation
Overview: Maps data to a uniform or normal distribution using quantiles.
Benefits: Makes data follow a specified distribution, useful for non-linear scaling.
Disadvantages: Can distort relationships between features, computationally expensive.
Notes: Best used with a very long transformation period.
Conclusion
Feel free to explore these normalization/transformation techniques to see how they impact the performance of the CG Oscillator. Each method offers unique insights and benefits, making this study a valuable tool for traders, especially those with a passion for data analysis.

Advanced ADX [CryptoSea]The Advanced ADX Analysis is a sophisticated tool designed to enhance market analysis through detailed ADX calculations. This tool is built for traders who seek to identify market trends, strength, and potential reversals with higher accuracy. By leveraging the Average Directional Index (ADX), Directional Indicator Plus (DI+), and Directional Indicator Minus (DI-), this indicator offers a comprehensive view of market dynamics.
New Overlay Feature: This script uses the new 'force overlay' feature which lets you plot on the chart as well as plotting in an oscillator pane at the same time.
force_overlay=true
Key Features
Comprehensive ADX Tracking: Tracks ADX values along with DI+ and DI- to provide a complete view of market trend strength and direction. The ADX measures the strength of the trend, while DI+ and DI- indicate the trend direction. This combined analysis helps traders identify strong and weak trends with precision.
Trend Duration Monitoring: Monitors the duration of strong and weak trends, offering insights into trend persistence and potential reversals. By keeping track of how long the ADX has been above or below a certain threshold, traders can gauge the sustainability of the current trend.
Customizable Alerts: Features multiple alert options for strong trends, weak trends, and DI crossovers, ensuring traders are notified of significant market events. These alerts can be tailored to notify traders when certain conditions are met, such as when the ADX crosses a threshold or when DI+ crosses DI-.
Adaptive Display Options: Includes customizable background color settings and extended statistics display for in-depth market analysis. Users can choose to highlight strong or weak trends on the chart background, making it easier to visualize market conditions at a glance.
In the example below, we have a bullish scenario play out where the DI+ has been above the DI- for 11 candles and our dashboard shows the average is 10.48 candles. With the ADX above its threshold this would be a bullish signal.
This ended up in a 20%+ move to the upside. The dashboard will help point out things to consider when looking to exit the position, the DI+ getting close to the max DI+ duration would be a sign that momentum is weakening and that price may cool off or even reverse.
How it Works
ADX Calculation: Computes the ADX, DI+, and DI- values using a user-defined period. The ADX is derived from the smoothed average of the absolute difference between DI+ and DI-. This calculation helps determine the strength of a trend without considering its direction.
Trend Duration Analysis: Tracks and calculates the duration of strong and weak trends, as well as DI+ and DI- durations. This analysis provides a detailed view of how long a trend has been in place, helping traders assess the reliability of the trend.
Alert System: Provides a robust alert system that triggers notifications for strong trends, weak trends, and DI crossovers. The alerts are based on specific conditions such as the duration of the trend or the crossover of directional indicators, ensuring traders are informed about critical market movements.
Visual Enhancements: Utilizes color gradients and background settings to visually represent trend strength and duration. This feature enhances the visual analysis of trends, making it easier for traders to identify significant market changes at a glance.
In the example below, we see the ADX weakening after we have just had a move up, if you are looking to get into this position you want to see the ADX growing with either the DI+ or DI- breaking their average durations.
As you can see below, although the ADX manages to move above the threshold, there are no DI+/- breaks which is shown by price moving sideways. Not something most traders would be interested in.
Application
Strategic Decision-Making: Assists traders in making informed decisions by providing detailed analysis of ADX movements and trend durations. By understanding the strength and direction of trends, traders can better time their entries and exits.
Trend Confirmation: Reinforces trading strategies by confirming potential reversals and trend strength through ADX and DI analysis. This confirmation helps traders validate their trading signals, reducing the risk of false signals.
Customized Analysis: Adapts to various trading styles with extensive input settings that control the display and sensitivity of trend data. Traders can customize the indicator to suit their specific needs, making it a versatile tool for different trading strategies.
The Advanced ADX Analysis by is an invaluable addition to a trader's toolkit, offering depth and precision in market trend analysis to navigate complex market conditions effectively. With its comprehensive tracking, alert system, and customizable display options, this indicator provides traders with the tools they need to stay ahead of the market.

SOL & BTC EMA with BTC/SOL Price Difference % and BTC Dom EMAThis script is designed to provide traders with a comprehensive analysis of Solana (SOL) and Bitcoin (BTC) by incorporating Exponential Moving Averages (EMAs) and price difference percentages. It also includes the BTC Dominance EMA to offer insights into the overall market dominance of Bitcoin.
Features:
SOL EMA: Plots the Exponential Moving Average (EMA) for Solana (SOL) based on a customizable period length.
BTC EMA: Plots the Exponential Moving Average (EMA) for Bitcoin (BTC) based on a customizable period length.
BTC Dominance EMA: Plots the Exponential Moving Average (EMA) for BTC Dominance, which helps in understanding Bitcoin's market share relative to other cryptocurrencies.
BTC/SOL Price Difference %: Calculates and plots the percentage difference between BTC and SOL prices, adjusted for their respective EMAs. This helps in identifying relative strength or weakness between the two assets.
Background Highlight: Colors the background to visually indicate whether the BTC/SOL price difference percentage is positive (green) or negative (red), aiding in quick decision-making.
Inputs:
SOL Ticker: Symbol for Solana (default: BINANCE
).
BTC Ticker: Symbol for Bitcoin (default: BINANCE
).
BTC Dominance Ticker: Symbol for Bitcoin Dominance (default: CRYPTOCAP
.D).
EMA Length: The length of the EMA (default: 20 periods).
Usage:
This script is intended for traders looking to analyze the relationship between SOL and BTC, using EMAs to smooth out price data and highlight trends. The BTC/SOL price difference percentage can help traders identify potential trading opportunities based on the relative movements of SOL and BTC.
Note: Leverage trading involves significant risk and may not be suitable for all investors. Ensure you have a good understanding of the market conditions and employ proper risk management techniques.

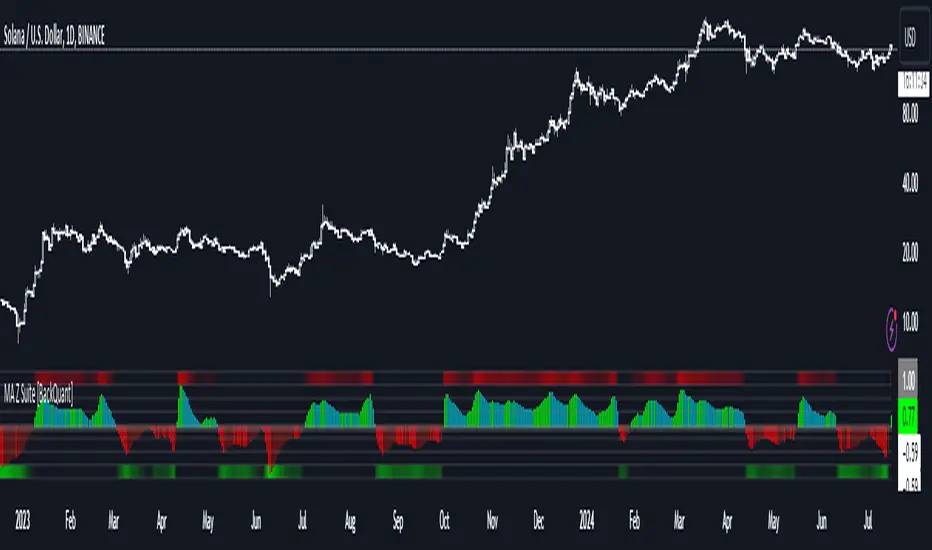
Moving Average Z-Score Suite [BackQuant]Moving Average Z-Score Suite
1. What is this indicator
The Moving Average Z-Score Suite is a versatile indicator designed to help traders identify and capitalize on market trends by utilizing a variety of moving averages. This indicator transforms selected moving averages into a Z-Score oscillator, providing clear signals for potential buy and sell opportunities. The indicator includes options to choose from eleven different moving average types, each offering unique benefits and characteristics. It also provides additional features such as standard deviation levels, extreme levels, and divergence detection, enhancing its utility in various market conditions.
2. What is a Z-Score
A Z-Score is a statistical measurement that describes a value's relationship to the mean of a group of values. It is measured in terms of standard deviations from the mean. For instance, a Z-Score of 1.0 means the value is one standard deviation above the mean, while a Z-Score of -1.0 indicates it is one standard deviation below the mean. In the context of financial markets, Z-Scores can be used to identify overbought or oversold conditions by determining how far a particular value (such as a moving average) deviates from its historical mean.
3. What moving averages can be used
The Moving Average Z-Score Suite allows users to select from the following eleven moving averages:
Simple Moving Average (SMA)
Hull Moving Average (HMA)
Exponential Moving Average (EMA)
Weighted Moving Average (WMA)
Double Exponential Moving Average (DEMA)
Running Moving Average (RMA)
Linear Regression Curve (LINREG) (This script can be found standalone )
Triple Exponential Moving Average (TEMA)
Arnaud Legoux Moving Average (ALMA)
Kalman Hull Moving Average (KHMA)
T3 Moving Average
Each of these moving averages has distinct properties and reacts differently to price changes, allowing traders to select the one that best fits their trading style and market conditions.
4. Why Turning a Moving Average into a Z-Score is Innovative and Its Benefits
Transforming a moving average into a Z-Score is an innovative approach because it normalizes the moving average values, making them more comparable across different periods and instruments. This normalization process helps in identifying extreme price movements and mean-reversion opportunities more effectively. By converting the moving average into a Z-Score, traders can better gauge the relative strength or weakness of a trend and detect potential reversals. This method enhances the traditional moving average analysis by adding a statistical perspective, providing clearer and more objective trading signals.
5. How It Can Be Used in the Context of a Trading System
In a trading system, it can be used to generate buy and sell signals based on the Z-Score values. When the Z-Score crosses above zero, it indicates a potential buying opportunity, suggesting that the price is above its mean and possibly trending upward. Conversely, a Z-Score crossing below zero signals a potential selling opportunity, indicating that the price is below its mean and might be trending downward. Additionally, the indicator's ability to show standard deviation levels and extreme levels helps traders set profit targets and stop-loss levels, improving risk management and trade planning.
6. How It Can Be Used for Trend Following
For trend-following strategies, it can be particularly useful. The Z-Score oscillator helps traders identify the strength and direction of a trend. By monitoring the Z-Score and its rate of change, traders can confirm the persistence of a trend and make informed decisions to enter or exit trades. The indicator's divergence detection feature further enhances trend-following by identifying potential reversals before they occur, allowing traders to capitalize on trend shifts. By providing a clear and quantifiable measure of trend strength, this indicator supports disciplined and systematic trend-following strategies.
No backtests for this indicator due to the many options and ways it can be used,
Enjoy
Multiple Non-Linear Regression [ChartPrime]This indicator is designed to perform multiple non-linear regression analysis using four independent variables: close, open, high, and low prices. Here's a breakdown of its components and functionalities:
Inputs:
Users can adjust several parameters:
Normalization Data Length: Length of data used for normalization.
Learning Rate: Rate at which the algorithm learns from errors.
Smooth?: Option to smooth the output.
Smooth Length: Length of smoothing if enabled.
Define start coefficients: Initial coefficients for the regression equation.
Data Normalization:
The script normalizes input data to a range between 0 and 1 using the highest and lowest values within a specified length.
Non-linear Regression:
It calculates the regression equation using the input coefficients and normalized data. The equation used is a weighted sum of the independent variables, with coefficients adjusted iteratively using gradient descent to minimize errors.
Error Calculation:
The script computes the error between the actual and predicted values.
Gradient Descent: The coefficients are updated iteratively using gradient descent to minimize the error.
// Compute the predicted values using the non-linear regression function
predictedValues = nonLinearRegression(x_1, x_2, x_3, x_4, b1, b2, b3, b4)
// Compute the error
error = errorModule(initial_val, predictedValues)
// Update the coefficients using gradient descent
b1 := b1 - (learningRate * (error * x_1))
b2 := b2 - (learningRate * (error * x_2))
b3 := b3 - (learningRate * (error * x_3))
b4 := b4 - (learningRate * (error * x_4))
Visualization:
Plotting of normalized input data (close, open, high, low).
The indicator provides visualization of normalized data values (close, open, high, low) in the form of circular markers on the chart, allowing users to easily observe the relative positions of these values in relation to each other and the regression line.
Plotting of the regression line.
Color gradient on the regression line based on its value and bar colors.
Display of normalized input data and predicted value in a table.
Signals for crossovers with a midline (0.5).
Interpretation:
Users can interpret the regression line and its crossovers with the midline (0.5) as signals for potential buy or sell opportunities.
This indicator helps users analyze the relationship between multiple variables and make trading decisions based on the regression analysis. Adjusting the coefficients and parameters can fine-tune the model's performance according to specific market conditions.

Six PillarsGeneral Overview
The "Six Pillars" indicator is a comprehensive trading tool that combines six different technical analysis methods to provide a holistic view of market conditions.
These six pillars are:
Trend
Momentum
Directional Movement (DM)
Stochastic
Fractal
On-Balance Volume (OBV)
The indicator calculates the state of each pillar and presents them in an easy-to-read table format. It also compares the current timeframe with a user-defined comparison timeframe to offer a multi-timeframe analysis.
A key feature of this indicator is the Confluence Strength meter. This unique metric quantifies the overall agreement between the six pillars across both timeframes, providing a score out of 100. A higher score indicates stronger agreement among the pillars, suggesting a more reliable trading signal.
I also included a visual cue in the form of candle coloring. When all six pillars agree on a bullish or bearish direction, the candle is colored green or red, respectively. This feature allows traders to quickly identify potential high-probability trade setups.
The Six Pillars indicator is designed to work across multiple timeframes, offering a comparison between the current timeframe and a user-defined comparison timeframe. This multi-timeframe analysis provides traders with a more comprehensive understanding of market dynamics.
Origin and Inspiration
The Six Pillars indicator was inspired by the work of Dr. Barry Burns, author of "Trend Trading for Dummies" and his concept of "5 energies." (Trend, Momentum, Cycle, Support/Resistance, Scale) I was intrigued by Dr. Burns' approach to analyzing market dynamics and decided to put my own twist upon his ideas.
Comparing the Six Pillars to Dr. Burns' 5 energies, you'll notice I kept Trend and Momentum, but I swapped out Cycle, Support/Resistance, and Scale for Directional Movement, Stochastic, Fractal, and On-Balance Volume. These changes give you a more dynamic view of market strength, potential reversals, and volume confirmation all in one package.
What Makes This Indicator Unique
The standout feature of the Six Pillars indicator is its Confluence Strength meter. This feature calculates the overall agreement between the six pillars, providing traders with a clear, numerical representation of signal strength.
The strength is calculated by considering the state of each pillar in both the current and comparison timeframes, resulting in a score out of 100.
Here's how it calculates the strength:
It considers the state of each pillar in both the current timeframe and the comparison timeframe.
For each pillar, the absolute value of its state is taken. This means that both strongly bullish (2) and strongly bearish (-2) states contribute equally to the strength.
The absolute values for all six pillars are summed up for both timeframes, resulting in two sums: current_sum and alternate_sum.
These sums are then added together to get a total_sum.
The total_sum is divided by 24 (the maximum possible sum if all pillars were at their strongest states in both timeframes) and multiplied by 100 to get a percentage.
The result is rounded to the nearest integer and capped at a minimum of 1.
This calculation method ensures that the Confluence Strength meter takes into account not only the current timeframe but also the comparison timeframe, providing a more robust measure of overall market sentiment. The resulting score, ranging from 1 to 100, gives traders a clear and intuitive measure of how strongly the pillars agree, with higher scores indicating stronger potential signals.
This approach to measuring signal strength is unique in that it doesn't just rely on a single aspect of price action or volume. Instead, it takes into account multiple factors, providing a more robust and reliable indication of potential market moves. The higher the Confluence Strength score, the more confident traders can be in the signal.
The Confluence Strength meter helps traders in several ways:
It provides a quick and easy way to gauge the overall market sentiment.
It helps prioritize potential trades by identifying the strongest signals.
It can be used as a filter to avoid weaker setups and focus on high-probability trades.
It offers an additional layer of confirmation for other trading strategies or indicators.
By combining the Six Pillars analysis with the Confluence Strength meter, I've created a powerful tool that not only identifies potential trading opportunities but also quantifies their strength, giving traders a significant edge in their decision-making process.
How the Pillars Work (What Determines Bullish or Bearish)
While developing this indicator, I selected and configured six key components that work together to provide a comprehensive view of market conditions. Each pillar is set up to complement the others, creating a synergistic effect that offers traders a more nuanced understanding of price action and volume.
Trend Pillar: Based on two Exponential Moving Averages (EMAs) - a fast EMA (8 period) and a slow EMA (21 period). It determines the trend by comparing these EMAs, with stronger trends indicated when the fast EMA is significantly above or below the slow EMA.
Directional Movement (DM) Pillar: Utilizes the Average Directional Index (ADX) with a default period of 14. It measures trend strength, with values above 25 indicating a strong trend. It also considers the Positive and Negative Directional Indicators (DI+ and DI-) to determine trend direction.
Momentum Pillar: Uses the Moving Average Convergence Divergence (MACD) with customizable fast (12), slow (26), and signal (9) lengths. It compares the MACD line to the signal line to determine momentum strength and direction.
Stochastic Pillar: Employs the Stochastic oscillator with a default period of 13. It identifies overbought conditions (above 80) and oversold conditions (below 20), with intermediate zones between 60-80 and 20-40.
Fractal Pillar: Uses Williams' Fractal indicator with a default period of 3. It identifies potential reversal points by looking for specific high and low patterns over the given period.
On-Balance Volume (OBV) Pillar: Incorporates On-Balance Volume with three EMAs - short (3), medium (13), and long (21) periods. It assesses volume trends by comparing these EMAs.
Each pillar outputs a state ranging from -2 (strongly bearish) to 2 (strongly bullish), with 0 indicating a neutral state. This standardized output allows for easy comparison and aggregation of signals across all pillars.
Users can customize various parameters for each pillar, allowing them to fine-tune the indicator to their specific trading style and market conditions. The multi-timeframe comparison feature also allows users to compare pillar states between the current timeframe and a user-defined comparison timeframe, providing additional context for decision-making.
Design
From a design standpoint, I've put considerable effort into making the Six Pillars indicator visually appealing and user-friendly. The clean and minimalistic design is a key feature that sets this indicator apart.
I've implemented a sleek table layout that displays all the essential information in a compact and organized manner. The use of a dark background (#030712) for the table creates a sleek look that's easy on the eyes, especially during extended trading sessions.
The overall design philosophy focuses on presenting complex information in a simple, intuitive format, allowing traders to make informed decisions quickly and efficiently.
The color scheme is carefully chosen to provide clear visual cues:
White text for headers ensures readability
Green (#22C55E) for bullish signals
Blue (#3B82F6) for neutral states
Red (#EF4444) for bearish signals
This color coding extends to the candle coloring, making it easy to spot when all pillars agree on a bullish or bearish outlook.
I've also incorporated intuitive symbols (↑↑, ↑, →, ↓, ↓↓) to represent the different states of each pillar, allowing for quick interpretation at a glance.
The table layout is thoughtfully organized, with clear sections for the current and comparison timeframes. The Confluence Strength meter is prominently displayed, providing traders with an immediate sense of signal strength.
To enhance usability, I've added tooltips to various elements, offering additional information and explanations when users hover over different parts of the indicator.
How to Use This Indicator
The Six Pillars indicator is a versatile tool that can be used for various trading strategies. Here are some general usage guidelines and specific scenarios:
General Usage Guidelines:
Pay attention to the Confluence Strength meter. Higher values indicate stronger agreement among the pillars and potentially more reliable signals.
Use the multi-timeframe comparison to confirm signals across different time horizons.
Look for alignment between the current timeframe and comparison timeframe pillars for stronger signals.
One of the strengths of this indicator is it can let you know when markets are sideways – so in general you can know to avoid entering when the Confluence Strength is low, indicating disagreement among the pillars.
Customization Options
The Six Pillars indicator offers a wide range of customization options, allowing traders to tailor the tool to their specific needs and trading style. Here are the key customizable elements:
Comparison Timeframe:
Users can select any timeframe for comparison with the current timeframe, providing flexibility in multi-timeframe analysis.
Trend Pillar:
Fast EMA Period: Adjustable for quicker or slower trend identification
Slow EMA Period: Can be modified to capture longer-term trends
Momentum Pillar:
MACD Fast Length
MACD Slow Length
MACD Signal Length These can be adjusted to fine-tune momentum sensitivity
DM Pillar:
ADX Period: Customizable to change the lookback period for trend strength measurement
ADX Threshold: Adjustable to define what constitutes a strong trend
Stochastic Pillar:
Stochastic Period: Can be modified to change the sensitivity of overbought/oversold readings
Fractal Pillar:
Fractal Period: Adjustable to identify potential reversal points over different timeframes
OBV Pillar:
Short OBV EMA
Medium OBV EMA
Long OBV EMA These periods can be customized to analyze volume trends over different timeframes
These customization options allow traders to experiment with different settings to find the optimal configuration for their trading strategy and market conditions. The flexibility of the Six Pillars indicator makes it adaptable to various trading styles and market environments.

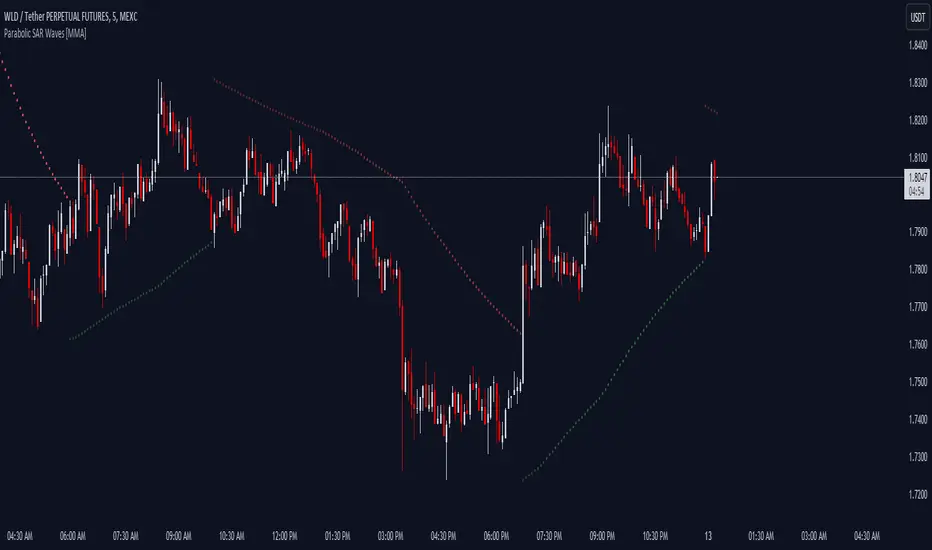
Parabolic SAR Waves [MMA]Parabolic SAR Waves
Description:
The "Parabolic SAR Waves " is an advanced version of the traditional Parabolic SAR indicator, customized for TradingView. This script incorporates dynamic acceleration factors and optional gradient coloration to enhance visual interpretation and utility for traders aiming to accurately capture trends and predict potential reversals.
Features:
- Dynamic Acceleration: Adjust the initial, incremental, and maximum values of the acceleration factor to suit various market conditions and trading preferences.
- Gradient Coloring: Use gradient colors to indicate the strength and stability of the trend, providing visual cues that are easy to interpret.
- Trend Visibility: The SAR dots are plotted directly on the price chart, making it easy to spot trend changes and maintain situational awareness.
- Overlay Feature: Designed to overlay directly on the price charts, allowing for seamless integration with other technical analysis tools.
Benefits:
- Trend Detection: Helps in identifying the beginning and potential reversal of trends, aiding in timely decision-making.
- Stop-Loss Management: Utilizes the positions of the SAR dots as dynamic stop-loss points, which helps in risk management.
- Visual Simplicity: Enhances the decision-making process through a straightforward visual representation of trend data.
Parameters:
- Acceleration Start (accel_start): The initial value for the acceleration, set to 0.02 by default.
- Acceleration Increment (accel_inc): The amount by which the acceleration increases, set to 0.005 by default.
- Acceleration Maximum (accel_max): The maximum limit of the acceleration factor, set to 0.1 by default.
- Use Gradient Colors (use_gradient): A boolean toggle to enable or disable gradient coloring, enabled by default.
Indicator Usage:
1. To apply, select this indicator from TradingView's indicator library.
2. Adjust the acceleration parameters based on your specific trading strategy and market analysis.
3. Interpret the indicator signals:
- Green SAR dots below the price bars indicate a bullish trend.
- Red SAR dots above the price bars signify a bearish trend.
- Gradient colors, if enabled, provide insights into the acceleration factor's intensity relative to trend strength.
Alerts:
- Bullish Reversal Alert: Issues a notification if there is a potential upward reversal when the trend shifts to bullish.
- Bearish Reversal Alert: Alerts when there's potential for a downward move as the trend turns bearish.
The "Parabolic SAR Waves " is a robust tool, ideal for traders who need precise, customizable trend-following capabilities that integrate seamlessly with other market analysis strategies. Enhance your trading with detailed trend insights and adaptive parameter controls.
Bitcoin Trend Indicator█ Overview
The Trend Indicator script is designed to help traders identify the direction and strength of momentum in the price of a digital asset. By using historical price data, it calculates and provides daily signals indicating whether the asset is in an uptrend, downtrend, or no trend at all. The script can be applied to various cryptocurrencies, such as Bitcoin and Ether, using their respective price charts.
█ Key Concepts and Calculation Methodology
For calculations, the script uses the 180 most recent candles.
The Trend Indicator is calculated based on four moving average pairs (MAPs), which compare shorter-term and longer-term moving averages of the asset's price.
The moving averages are exponentially weighted, meaning more recent prices have a greater impact on the average than older prices. The half-life of the moving averages determines the weight decay.
The script uses the following moving average pairs:
1-day vs. 5-day
2.5-day vs. 10-day
5-day vs. 20-day
10-day vs. 40-day
█ Calculation Steps
Exponentially Weighted Moving Averages (EWMA):
Each moving average is calculated using an exponential decay factor and a normalization factor to adjust for the fixed window of 180 observations.
Component Inputs:
For each moving average pair, the script compares the shorter-term moving average to the longer-term moving average. If the shorter-term average is greater than or equal to the longer-term average, the component input is +1 (indicating an uptrend). If it is less, the input is -1 (indicating a downtrend).
Trend Indicator Value:
The script averages the four component inputs to produce a final value ranging from -1 to +1, representing the trend's direction and strength:
+1: Significant uptrend
+0.5: Uptrend
0: No trend
-0.5: Downtrend
-1: Significant downtrend
█ Learn More
For more information about the Bitcoin Trend Indicator and other trading tools, please visit my TradingView profile. Feel free to reach out with any questions or feedback.

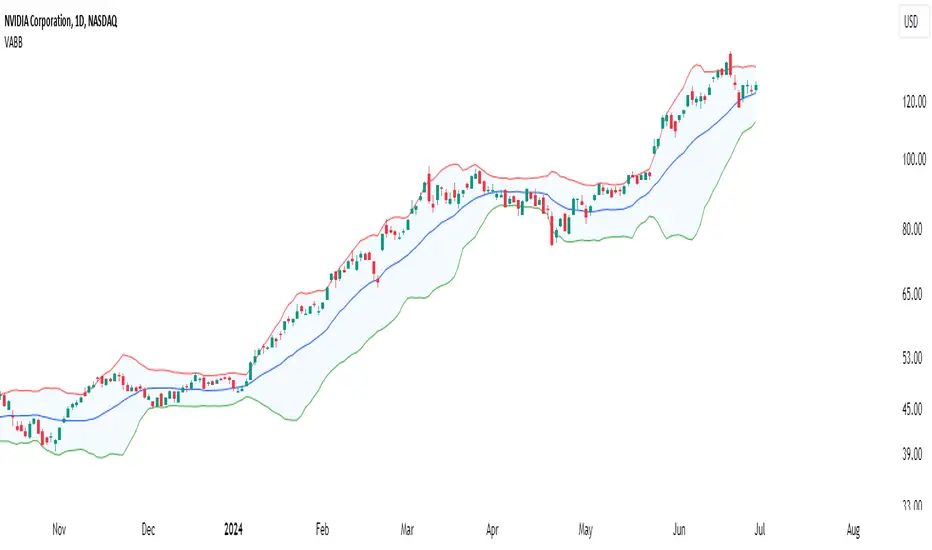
Volume-Adjusted Bollinger BandsThe Volume-Adjusted Bollinger Bands (VABB) indicator is an advanced technical analysis tool that enhances the traditional Bollinger Bands by incorporating volume data. This integration allows the bands to dynamically adjust based on market volume, providing a more nuanced view of price movements and volatility. The key qualities of the VABB indicator include:
1. Dynamic Adjustment with Volume: Traditional Bollinger Bands are based solely on price data and standard deviations. The VABB indicator adjusts the width of the bands based on the volume ratio, making them more responsive to changes in market activity. This means that during periods of high volume, the bands will expand, and during periods of low volume, they will contract. This adjustment helps to reinforce the significance of price movements relative to the central line (VWMA).
2. Volume-Weighted Moving Average (VWMA): Instead of using a simple moving average (SMA) as the central line, the VABB uses the VWMA, which weights prices by volume. This provides a more accurate representation of the average price level, considering the trading volume.
3. Enhanced Signal Reliability: By incorporating volume, the VABB can filter out false signals that might occur in low-volume conditions. This makes the indicator particularly useful for identifying significant price movements that are supported by strong trading activity.
How to Use and Interpret the VABB Indicator
To use the VABB indicator, you need to set it up on your trading platform with the following parameters:
1. BB Length: The number of periods for calculating the Bollinger Bands (default is 20).
2. BB Multiplier: The multiplier for the standard deviation to set the width of the Bollinger Bands (default is 2.0).
3. Volume MA Length: The number of periods for calculating the moving average of the volume (default is 14).
Volume Ratio Smoothing Length: The number of periods for smoothing the volume ratio (default is 5).
Interpretation
1.Trend Identification: The VWMA serves as the central line. When the price is above the VWMA, it indicates an uptrend, and when it is below, it indicates a downtrend. The direction of the VWMA itself can also signal the trend's strength.
2. Volatility and Volume Analysis: The width of the VABB bands reflects both volatility and volume. Wider bands indicate high volatility and/or high volume, suggesting significant price movements. Narrower bands indicate low volatility and/or low volume, suggesting consolidation.
3. Trading Signals:
Breakouts: A price move outside the adjusted upper or lower bands can signal a potential breakout. High volume during such moves reinforces the breakout's validity.
Reversals: When the price touches or crosses the adjusted upper band, it may indicate overbought conditions, while touching or crossing the adjusted lower band may indicate oversold conditions. These conditions can signal potential reversals, especially if confirmed by other indicators or volume patterns.
Volume Confirmation: The volume ratio component helps confirm the strength of price movements. For instance, a breakout accompanied by a high volume ratio is more likely to be sustained than one with a low volume ratio.
Practical Example
Bullish Scenario: If the price crosses above the adjusted upper band with a high volume ratio, it suggests a strong bullish breakout. Traders might consider entering a long position, setting a stop-loss just below the VWMA or the lower band.
Bearish Scenario: Conversely, if the price crosses below the adjusted lower band with a high volume ratio, it suggests a strong bearish breakout. Traders might consider entering a short position, setting a stop-loss just above the VWMA or the upper band.
Conclusion
The Volume-Adjusted Bollinger Bands (VABB) indicator is a powerful tool that enhances traditional Bollinger Bands by incorporating volume data. This dynamic adjustment helps traders better understand market conditions and make more informed trading decisions. By using the VABB indicator, traders can identify significant price movements supported by volume, improving the reliability of their trading signals.
The Volume-Adjusted Bollinger Bands (VABB) indicator is provided for educational and informational purposes only. It is not financial advice and should not be construed as a recommendation to buy, sell, or hold any financial instrument. Trading involves significant risk of loss and is not suitable for all investors. Past performance is not indicative of future results.
Dynamic Candle StrengthHow It Works
Initialization of Dynamic Levels:
The first candle's high and low are taken as the initial dynamic high and dynamic low levels.
If the next candle's close price is above the dynamic high, the candle is colored green, indicating bullish conditions.
If the next candle's close price is below the dynamic low, the candle is colored black, indicating bearish conditions.
If a candle's high and low crossed both the dynamic high and dynamic low, the dynamic high and low levels are updated to the high and low of that candle, but the candle color will continue with the same color as the previous candle.
Maintaining and Updating Dynamic Levels:
The dynamic high and low are only updated if a candle's close is above the current dynamic high or below the current dynamic low.
If the candle does not close above or below these levels, the dynamic high and low remain unchanged.
Visual Signals:
Green Bars: Indicate that the candle's close is above the dynamic high, suggesting bullish conditions.
Black Bars: Indicate that the candle's close is below the dynamic low, suggesting bearish conditions.
This method ensures that the dynamic high and low levels are adjusted in real-time based on the most recent significant price movements, providing a reliable measure of market sentiment.
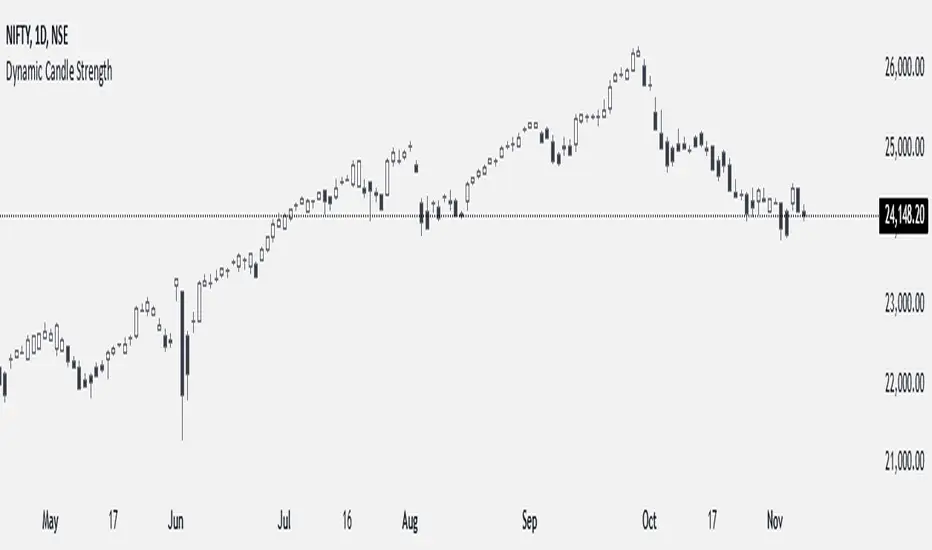
Growth TrendThis powerful indicator plots the number of growth stocks in an uptrend, providing a comprehensive view of the market's overall direction. By applying a simple moving average, users can quickly gauge the trend and make informed trading decisions.
How does it work?
The script pulls tickers from the S & P 500 Growth ETF. It then plots the number of stocks from the ETF that are trending above a medium-term Moving Average, signaling an uptrend.
A moving average is applied to help understand the trend.
The background is shaded when 3 or more consecutive days are above (green) or below (red) the moving average.
Key Features:
Visual Trend Identification: The indicator shades the background green when three or more consecutive days are above the moving average, indicating a strong uptrend. Conversely, it shades red when three consecutive days are below the moving average, signaling a downtrend.
Breakout Insights: By tracking the trend, traders can identify when breakouts in growth stocks are more likely to occur or fail. This helps traders time their entries and exits more effectively.
Trend Strength Assessment: The indicator provides a quick visual assessment of the trend's strength, enabling traders to adjust their strategies accordingly.
Why is this indicator helpful?
Improved Trading Decisions: By understanding the overall trend and strength of growth stocks, traders can make more informed decisions about when to buy or sell.
Enhanced Risk Management: The indicator helps traders identify potential trend reversals, enabling them to adjust their positions and manage risk more effectively.
Market Insights: The Growth Stock Trend Indicator provides a valuable perspective on the market's overall direction, helping traders stay ahead of the curve.
By incorporating this indicator into their trading strategy, traders can gain a competitive edge and make more informed decisions in the growth stock market.

mentfx Volume SimpleThe "ment vol" indicator can be integrated into various trading strategies to gain deeper insights into market volume dynamics:
Trend Confirmation:
Use the black bars to identify general volume trends in conjunction with price movements.
Green bars highlight moments of increasing volume, potentially indicating stronger market momentum.
Swing Detection:
Blue swing bars help identify significant volume spikes that may signify potential reversals or key market turning points.
Swing bars can be used to spot accumulation or distribution phases within the market.
Volume-Based Alerts:
Traders can set alerts based on the appearance of green or blue bars to catch significant volume changes in real time.
Helps in identifying potential breakout or breakdown points before they occur.
Why It's Unique:
The "ment vol" indicator is unique because it combines multiple volume analysis techniques into a single, easy-to-interpret visual format. By focusing on key volume patterns such as larger bars and swing bars, traders are equipped with actionable insights that go beyond simple volume analysis. This indicator is particularly useful for traders who rely on volume to confirm price movements and identify potential market shifts.
Conclusion:
Incorporating the "ment vol" indicator into your trading toolkit can provide a deeper understanding of market volume dynamics and enhance your ability to make timely and informed trading decisions. Whether you're a novice trader looking to improve your strategy or an experienced trader seeking a robust volume analysis tool, "ment vol" offers valuable insights that can help you navigate the markets with confidence.
How It Works:
The "ment vol" indicator evaluates the volume of each bar and applies specific coloring rules based on volume patterns:
Up and Down Bars: The indicator colors bars black if the closing price is higher or lower than the opening price, respectively.
Larger Bars: If the volume of the current bar is greater than the volume of the previous bar, the bar is colored green.
Swing Bars: If the volume of a bar is greater than both the preceding and following bars, forming a swing, it is colored blue.
These color-coded volume bars allow traders to quickly assess the strength and significance of volume changes in the market, providing a visual representation of potential trading opportunities.

Absolute Move BandsOverview:
The Absolute Move Bands indicator calculates the absolute value of the expected return, also known as "momentum" by some traders, and then displays it with standard deviation bands. The indicator also shows a moving average and a Kalman filter of the absolute move. If you take the expected return, you get what many traders commonly call "momentum." Now, if you turn the negative values into positive values by getting the magnitude of the expected return, it shows the "strength or intensity of the expected return." A low value of the absolute value of the expected return shows that the expected return is close to 0, which means that there is no significant trending behavior. The higher the value, the higher the deviation is from the mean, indicating stronger trend moves in the expected return itself. This indicator then gets the standard score of the absolute value of the expected return and then gets the moving average and Kalman Filter.
This indicator is not a directional indicator, but it can help you time moves and determine the "strength" of the expected returns (also known as momentum).
Interpreting the Magnitude:
Low Values: A low absolute value of the expected return indicates that the expected return is close to 0, suggesting no significant trending behavior in the market.
High Values: A high absolute value indicates a strong deviation from the mean, reflecting stronger trend moves in the expected return itself.
Standard Score Calculation:
This indicator computes the standard score (z-score) of the absolute value of the expected return. The value shows how many standard deviations the absolute return is from the mean. This helps in identifying periods of extreme magnitude.
Moving Average and Kalman Filter:
Moving Average: The indicator calculates the moving average of the standard score to smooth out the short-term fluctuations and show the longer-term trends in the absolute returns.
Kalman Filter: Applied to further reduce noise and provide a clearer signal, it enhances the indicator's effectiveness in determining the strength of the expected returns.
Standard Deviation Bands
Purpose: The standard deviation bands help determine if the standard score is at an extreme low or high.
High Standard Score (+2 Standard Deviation Band): Indicates that the absolute value of the expected return is at a high level, suggesting a strong trend. This could mean that the trend is at its peak and might be nearing completion.
Low Standard Score (-2 Standard Deviation Band): Indicates that the absolute value of the expected return is at a low level, suggesting minimal or no trending behavior. This could imply that the expected return is around 0, and a new trend (in any direction) may start soon.
How to interpret and use this indicator
Two ways will be discussed on how you can use this indicator. First of all lets go back over the interpretation of the standard score and bands.
High Standard Score: Indicates that the absolute value is significantly higher than usual, which suggest a strong trend which may be nearing its peak. Some traders who entered a trade at a low standard score value might want to consider taking profits or preparing for a potential reversal.
Low Standard Score: Indicates that the absolute value is significantly low, close to 0, which suggest minimal trending behavior and a new trend or move may soon start.
This indicator shouldn't be used alone; you may need an indicator that shows you the trend with an expected return indicator or a "momentum" indicator, because all this shows you is the strength of the trend or "momentum." So let's say that if you see that the standard score is low and the Kalman filter is increasing, then this shows that a trend may start soon, so you can use the "momentum" indicator and enter with whatever the trend is on.
Another way to use the indicator is to trade extreme occurrences. If on an indicator that shows the expected returns, or "momentum," and its at an extreme standard deviation occurrence level like -2 standard deviation from the mean, and the standard score is at 2 standard deviation (the top band), and the Kalman filter starts decreasing, then the downtrend may be over and you could place a long.