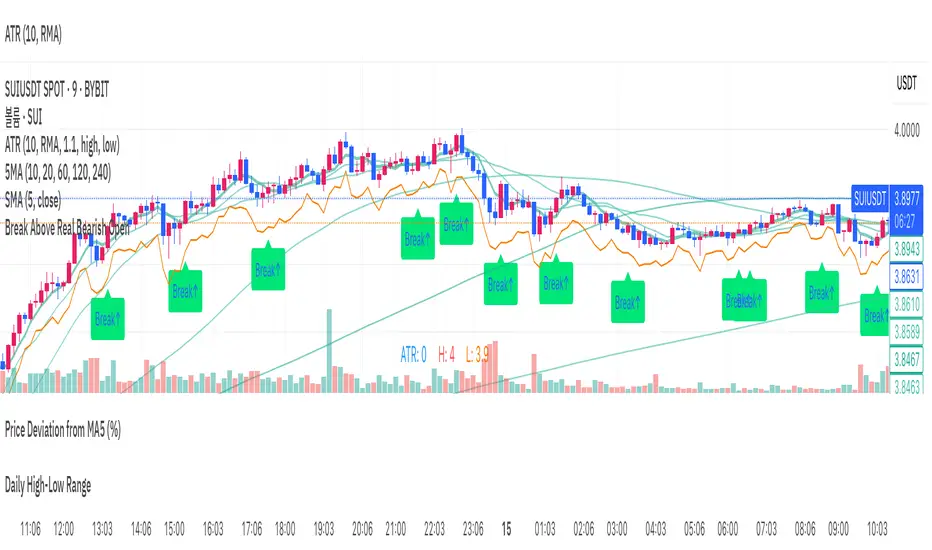
Break Above Real Bearish Open// This indicator is designed to help identify precise intraday entry points on lower timeframes.
// It tracks the most recent valid bearish candle—defined as a red candle whose close is lower than the low of the most recent bullish candle.
// When the price breaks above the open of that bearish candle with a bullish candle, a "Break↑" signal is shown.
// Minor pullback candles within uptrends are filtered out to reduce noise.
// The alert only triggers once per valid bearish setup, avoiding redundant signals.
// Ideal for detecting breakout opportunities after pullbacks in intraday trending markets.
// 이 인디케이터는 장중 분봉 기준에서 정밀한 진입 타이밍을 포착하는 데 도움을 줍니다.
// 최근 형성된 유효한 음봉(가장 최근 양봉의 저가보다 종가가 낮은 음봉)을 추적하며,
// 해당 음봉의 시가를 돌파하는 양봉이 등장할 경우, "Break↑" 신호를 차트에 표시합니다.
// 상승 중의 사소한 눌림 음봉은 자동으로 걸러내어 노이즈를 최소화합니다.
// 하나의 음봉에 대해 알림은 단 한 번만 발생하며, 중복되지 않도록 설계되어 있습니다.
// 분봉 흐름 속 눌림목 이후 돌파 구간을 자동으로 포착하고자 할 때 유용하게 활용할 수 있습니다.
Göstergeler ve stratejiler
Crypto Sentiment + Correlation📊 Crypto Sentiment + Correlation Indicator
Key Features:
- 🔄 Sentiment Aggregation: Measures price momentum vs moving averages across BTC, LTC, ETH, XRP, and SOL.
- ⚖️ Flexible Weighting Options: Choose between equal weight, market cap weighting, or volume-driven sentiment for tailored insights.
- 📈 Visual Candles & Background Signals: Uses sentiment-based candle overlays and color-coded signals to indicate potential shifts or divergence.
- 📊 BTC Correlation Map: Tracks correlation strength and direction between combined sentiment and Bitcoin’s price movement.
- 🧠 Technical Overlays: EMA and Bollinger Bands help contextualize sentiment trends with traditional indicators.
- 🎨 Stylized SMA Layers: Adds intuitive multi-format SMA visualization with area fill and stepped markers for easy spotting of trend shifts.
Why Use It:
Whether you're swing trading or refining entries on crypto positions, this tool gives you a snapshot of what the “mood” across major coins looks like—are the markets in harmony or diverging from BTC’s path? Use it to stay ahead of trend reversals, spot overextended rallies, or confirm bullish sentiment before you jump in.

NVDA Put Exit Alerts - Enhanced How to Use on These Timeframes:
5-15 min chart:
Look for price rejections or bounces at the weekly/monthly VWAP.
Confirm with CMF above 0.1 (buy pressure) or below -0.1 (sell pressure).
30-min to 1-hour chart:
Use to identify broader intraday swing moves that align with macro VWAP levels.
CMF will act as a filter for volume divergence setups.

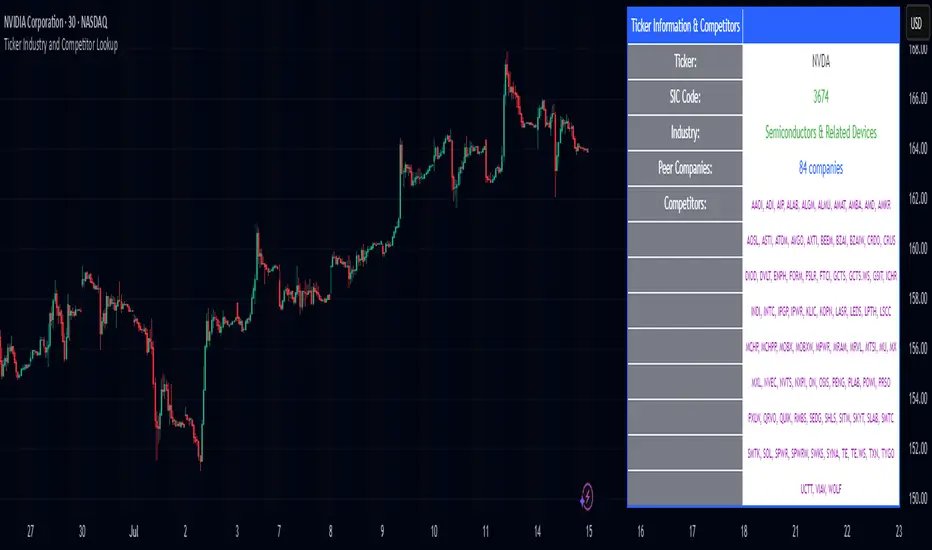
Ticker Industry and Competitor LookupThe Ticker Industry and Competitor Lookup is a comprehensive indicator that provides instant access to industry classification data and competitive intelligence for any ticker symbol. Built using the advanced SIC_TICKER_DATA library, this tool delivers professional-grade sector analysis with enterprise-level performance. It's a simple yet great tool for competitor research, sector studies, portfolio diversification, and investment decision-making.
This indicator is a simple tool built on based on our SIC_TICKER_DATA library to demonstrate the use cases of the library. In this case, you enter a ticker and it displays the sector, SIC or Standard Industrial Classification which is a SEC identifier, and more importantly, the competitors that are listed to be in the exact same SIC by SEC.
There isn't much to say about the indicator itself but we strongly recommend checking out the SIC_TICKER_DATA library we just published to learn more about the types of indicators you can build using it.
PietasterThis Pine Script (v6) indicator plots a 111-day Simple Moving Average (SMA) and a 2 * 350-day SMA (equivalent to a 700-day SMA) for Bitcoin's price, displayed on any timeframe. It highlights crossover points with vertical lines: green for bullish crossovers (111-day MA crosses above 700-day MA) and purple for bearish crossovers (111-day MA crosses below 700-day MA). Vertical lines extend 50% above the highest price and 50% below the lowest price at the crossover, ensuring visibility through price action. Labels identify the moving averages for clarity.

SIC_TICKER_DATAThe SIC Ticker Data is an advanced and efficient library for ticker-to-industry classification and sector analysis. Built with enterprise-grade performance optimizations, this library provides instant access to SIC codes, industry classifications, and peer company data for comprehensive market analysis.
Perfect for: Sector rotation strategies, peer analysis, portfolio diversification, market screening, and financial research tools.
The simple idea behind this library is to pull any data related to SIC number of any US stock market ticker provided by SEC in order to see the industry and also see the exact competitors of the ticker.
The library stores 3 types of data: SIC number, Ticker, and Industry name. What makes it very useful is that you can pull any one of this data using the other. For example, if you would like to know which tickers are inside a certain SIC, or what's the SIC number of a specific ticker, or even which tickers are inside a certain industry, you can use this library to pull this data. The idea for data inside this library is to be accessible in any direction possible as long as they're related to each other.
We've also published a simple indicator that uses this library in order to demonstrate the inner workings of this library.
The library stores thousands of tickers and their relevant SIC code and industry for your use and is constantly updated with new data when available. This is a large library but it is optimized to run as fast as possible. The previous unpublished versions would take over 40 seconds to load any data but the final public version here loads the data in less than 5 seconds.
🔍 Primary Lookup Functions
createDataStore()
Initialize the library with all pre-loaded data.
store = data.createDataStore()
getSicByTicker(store, ticker)
Get SIC code for any ticker symbol.
sic = data.getSicByTicker(store, "AAPL") // Returns: "3571"
getIndustryByTicker(store, ticker)
Get industry classification for any ticker.
industry = data.getIndustryByTicker(store, "AAPL") // Returns: "Computer Hardware"
getTickersBySic(store, sic)
Get all companies in a specific SIC code.
software = data.getTickersBySic(store, "7372") // Returns: "MSFT,GOOGL,META,V,MA,CRM,ADBE,ORCL,NOW,INTU"
getTickersByIndustry(store, industry)
Get all companies in an industry.
retail = data.getTickersByIndustry(store, "Retail") // Returns: "AMZN,HD,WMT,TGT,COST,LOW"
📊 Array & Analysis Functions
getTickerArrayBySic(store, sic)
Get tickers as array for processing.
techArray = data.getTickerArrayBySic(store, "7372")
for i = 0 to array.size(techArray) - 1
ticker = array.get(techArray, i)
// Process each tech company
getTickerCountBySic(store, sic)
Count companies in a sector (ultra-fast).
pinescripttechCount = data.getTickerCountBySic(store, "7372") // Returns: 10
🎯 Utility Functions
tickerExists(store, ticker)
Check if ticker exists in database.
exists = data.tickerExists(store, "AAPL") // Returns: true
tickerInSic(store, ticker, sic)
Check if ticker belongs to specific sector.
isInTech = data.tickerInSic(store, "AAPL", "3571") // Returns: true
💡 Usage Examples
Example 1: Basic Ticker Lookup
// @version=6
import EdgeTerminal/SIC_TICKER_DATA/1 as data
indicator("Ticker Analysis", overlay=true)
store = data.createDataStore()
currentSic = data.getSicByTicker(store, syminfo.ticker)
currentIndustry = data.getIndustryByTicker(store, syminfo.ticker)
if barstate.islast and currentSic != "NOT_FOUND"
label.new(bar_index, high, syminfo.ticker + " SIC: " + currentSic + " Industry: " + currentIndustry)
Example 2: Sector Analysis
// @version=6
import EdgeTerminal/SIC_TICKER_DATA/1 as data
indicator("Sector Comparison", overlay=false)
store = data.createDataStore()
// Compare sector sizes
techCount = data.getTickerCountBySic(store, "7372") // Software
financeCount = data.getTickerCountBySic(store, "6199") // Finance
healthCount = data.getTickerCountBySic(store, "2834") // Pharmaceutical
plot(techCount, title="Tech Companies", color=color.blue)
plot(financeCount, title="Finance Companies", color=color.green)
plot(healthCount, title="Health Companies", color=color.red)
Example 3: Peer Analysis
// @version=6
import EdgeTerminal/SIC_TICKER_DATA/1 as data
indicator("Find Competitors", overlay=true)
store = data.createDataStore()
currentSic = data.getSicByTicker(store, syminfo.ticker)
if currentSic != "NOT_FOUND"
competitors = data.getTickersBySic(store, currentSic)
peerCount = data.getTickerCountBySic(store, currentSic)
if barstate.islast
label.new(bar_index, high, "Competitors (" + str.tostring(peerCount) + "): " + competitors)
Example 4: Portfolio Sector Allocation
// @version=6
import EdgeTerminal/SIC_TICKER_DATA/1 as data
indicator("Portfolio Analysis", overlay=false)
store = data.createDataStore()
// Analyze your portfolio's sector distribution
portfolioTickers = array.from("AAPL", "MSFT", "GOOGL", "JPM", "JNJ")
sectorCount = map.new()
for i = 0 to array.size(portfolioTickers) - 1
ticker = array.get(portfolioTickers, i)
industry = data.getIndustryByTicker(store, ticker)
if industry != "NOT_FOUND"
currentCount = map.get(sectorCount, industry)
newCount = na(currentCount) ? 1 : currentCount + 1
map.put(sectorCount, industry, newCount)
🔧 Advanced Feature
You can also bulk load data for large data sets like this:
// Pre-format your data as pipe-separated string
bulkData = "AAPL:3571:Computer Hardware|MSFT:7372:Software|GOOGL:7372:Software"
store = data.createDataStoreFromBulk(bulkData)

Fusion AI IndicatorWhat is Fusion AI?
The Fusion AI Indicator blends three proven momentum & mean-reversion signals into a single composite “AI Score.” By normalizing and weighting EMA crossovers, RSI bias and MACD momentum, you get one clean line that captures multi-factor strength shifts in real time—plus optional price-chart arrows and built-in alerts.
How it works
Fast vs. Slow EMA (40%)
(EMA(fastLen) – EMA(slowLen)) / EMA(slowLen)
RSI Deviation (30%)
(RSI(rsiLen) – 50) / 50
MACD Momentum (30%)
(MACD.line – MACD.signal) / ATR(14)
AI Score = 0.4 · EMA + 0.3 · RSI + 0.3 · MACD
Thresholds
Buy when AI Score crosses up through +Threshold
Sell when it crosses down through –Threshold
Default Inputs (tuned for balanced signals)
Fast MA Length: 12
Slow MA Length: 26
RSI Length: 14
MACD Fast EMA: 12
MACD Slow EMA: 26
MACD Signal Smoothing: 9
AI Score Threshold: 0.30
Show Overlay Arrows: ✔️
Alert on Bar Close Only: ✔️
(You can lower Threshold toward 0.10–0.20 for more frequent signals in quieter markets.)
Recommended Markets & Timeframes
Bitcoin (BTCUSD) on 1 H, 4 H – captures crypto swings
Ethereum (ETHUSD) on 1 H, 4 H
AAPL, TSLA, SPY on 15 M, 1 H – ideal for intraday setups
How to Add Alerts
Add the indicator to your chart.
Open Create Alert → Condition →
Fusion AI Indicator with Alerts & Overlay → choose Buy Signal or Sell Signal.
Set Frequency to Once per bar close (default) or Once per bar.
Paste a custom message or use the default:
“Fusion AI: Bullish crossover detected”
“Fusion AI: Bearish crossunder detected”
Usage Tips
Combine with volume filters or support/resistance zones for higher-probability entries.
Use the gradient-colored subchart to spot building momentum even before arrows appear.
Back-test threshold levels per asset: volatility will dictate whether 0.30 is too loose or too tight.
Enjoy smoother, multi-factor signals in one indicator—Fusion AI does the math so your eyes can focus on the trade.

Live 30-Point Horizontal Lines with Price LabelsLive 30-Point Horizontal Lines with Price Labels for upper and below current price

🚀 XRP Ultimate Momentum Hunter v4.0
📈 XRP Ultimate Momentum Hunter v4.0 – Full Auto Alert Script
This advanced script automatically detects high-probability entry and exit signals for XRP based on volume explosions, RSI, multi-timeframe trend analysis, momentum acceleration, and buy pressure.
It includes smart JSON alerts for Telegram, n8n, or any webhook-based system.
🔔 Chart Signals:
🟢 Perfect Storm = all conditions align for a high-conviction entry
📈 Breakout = bullish breakout above resistance
⚡ Momentum = strong trend continuation
💰 Exit Profit = good moment to take profits
❌ Exit Loss = risk of breakdown or loss
📊 Live Dashboard & Daily Rating:
Evaluates daily volume, momentum, and signals
Labels the day as:
🔥 MEGA DAY – high opportunity
💰 PROFIT DAY – solid potential
😴 SLEEPY DAY – low activity
🧠 Smart Alerts with JSON Output:
BREAKOUT: price breakout with strong volume & dominance
DANGER: reversal risk or exhaustion detected
MEGA_DAG: high daily rating
PERIODIC_UPDATE: sends automatic status every 15 min or once per hour
📉 Includes MACD & EMA Cross detection
📌 Fully compatible with Telegram bots, n8n, and external signal processors

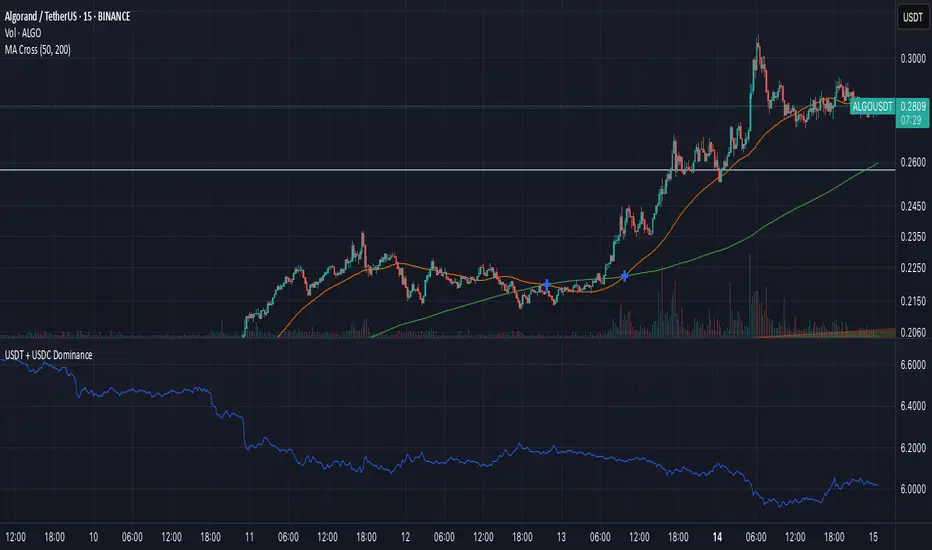
USDT + USDC DominanceUSDT and USDC Dominance: This refers to the combined market capitalization of Tether (USDT) and USD Coin (USDC) as a percentage of the total cryptocurrency market capitalization. It measures the proportion of the crypto market held by these stablecoins, which are pegged to the US dollar. High dominance indicates a "risk-off" sentiment, where investors hold stablecoins for safety during market uncertainty. A drop in dominance suggests capital is flowing into riskier assets like altcoins, often signaling a bullish market or the start of an "alt season."
Kalman Moving Average For LoopKey Features of the Indicator:
Flexible Moving Average Calculation (calcMovingAverage):Description: Allows users to select from 10 moving average types (SMA, EMA, DEMA, TEMA, WMA, VWMA, SMMA, HMA, LSMA, ALMA) to process the input price source (pricesource, default: close).
Parameters:
maType: User selects the moving average type (default: HMA).
period: Length of the moving average (default: 14).
almaSigma: Sigma parameter for ALMA (default: 5).
Purpose: Provides versatility in analyzing price trends, with the chosen moving average (maValue) used for comparison with the smoothed Kalman filter output.
Kalman Filter for Price Smoothing:
Description:
Applies a Kalman filter to the price source to produce a filtered price (kalmanFilteredPrice), which is further smoothed using an HMA to create smoothedKalmanPrice.
Parameters:
process_noise: Controls system model noise (default: 0.01).
measurement_noise:
Controls measurement noise (default: 3).
N: Filter order, determining the number of state estimates (default: 3).
smooth_period: HMA period for smoothing kalmanFilteredPrice (default: 9).
Purpose: Reduces noise in price data, providing a smoother trend line for signal generation and plotting.
Historical Analysis with For-Loop:
Description: Uses a for-loop to calculate the average of calcMovingAverage values over a user-defined historical range (from to to_) for historical bars of the price source (pricesource ).
Parameters:
from: Start of the historical range (default: 1).
to_: End of the historical range (default: 25).
Purpose: Computes an average moving average (avgMa) over the specified range to compare with the smoothed Kalman price for signal generation.
Error Handling and Robustness:
Description: Includes checks for na values in the for-loop to ensure only valid calcMovingAverage values contribute to the average (avgMa). Resets signal and plot variables each bar to prevent carryover.
Purpose: Ensures reliable calculations and prevents errors from invalid data.

Correlation Coefficient with MA & BB中文版介紹
相關係數、移動平均線與布林帶指標 (Correlation Coefficient with MA & BB)
這個 Pine Script 指標是一款強大的工具,旨在幫助交易者和投資者深入分析兩個市場標的之間的關係強度與方向,並結合移動平均線 (MA) 和布林帶 (BB) 來進一步洞察這種關係的趨勢和波動性。
無論您是想尋找配對交易機會、管理投資組合風險,還是僅僅想更好地理解市場動態,這個指標都能提供有價值的見解。
指標特色與功能:
動態相關係數計算:
您可以選擇任何您想比較的股票、商品或加密貨幣代號(例如,預設為 GOOG)。
指標會自動計算當前圖表(主數據源,預設為收盤價)與您指定標的之間的相關係數。
相關係數值介於 -1 (完美負相關) 至 1 (完美正相關) 之間,0 表示無線性關係。
視覺化呈現相關係數線,並標示 1、0、-1 參考水平線,同時填充完美相關區間,讓您一目了然。
特別之處:程式碼中包含了 ticker.modify,確保比較標的數據考慮了股息調整或延長交易時段,使相關性分析更加精準。
相關係數的移動平均線 (MA):
為了平滑相關係數的短期波動,指標提供了多種移動平均線類型供您選擇,包括:SMA、EMA、WMA、SMMA。
您可以設定計算 MA 的週期長度(預設 20 週期)。
這條 MA 線有助於識別相關係數的長期趨勢,判斷兩者關係是趨於增強還是減弱。
相關係數的布林帶 (BB):
將布林帶應用於相關係數,以衡量其波動性和相對高低水平。
中軌與您選擇的移動平均線保持一致。
上軌和下軌則根據相關係數的標準差和您設定的 Z 值(預設 2.0 倍標準差)動態調整。
布林帶可以幫助您識別相關係數何時處於極端水平,可能預示著未來會回歸均值。
如何運用這個指標?
配對交易策略:當兩個通常高度相關的資產,其相關係數短期內顯著偏離平均水平(例如,一個資產價格上漲而另一個原地踏步),您可能可以考慮利用此「失衡」進行配對交易。
投資組合多元化:了解不同資產之間的相關性,有助於構建更穩健的投資組合,避免過度集中於同向變動的資產,有效分散風險。
市場趨勢洞察:透過觀察相關係數的趨勢和波動,您可以更好地理解不同市場板塊或資產類別之間的聯動性,為您的宏觀經濟分析提供數據支持。
請注意,相關性不等於因果性。使用此指標時,請結合您的整體交易策略、宏觀經濟分析以及其他技術指標進行綜合判斷。
English Version Introduction
Correlation Coefficient with Moving Average & Bollinger Bands Indicator (Correlation Coefficient with MA & BB)
This Pine Script indicator is a powerful tool designed to help traders and investors deeply analyze the strength and direction of the relationship between two market instruments. It integrates Moving Averages (MA) and Bollinger Bands (BB) to further insight into the trend and volatility of this relationship.
Whether you're looking for pair trading opportunities, managing portfolio risk, or simply aiming to better understand market dynamics, this indicator can provide valuable insights.
Indicator Features & Functionality:
Dynamic Correlation Coefficient Calculation:
You can select any symbol you wish to compare (e.g., default is GOOG), be it stocks, commodities, or cryptocurrencies.
The indicator automatically calculates the correlation coefficient between the current chart (main data source, default is close price) and your specified symbol.
Correlation values range from -1 (perfect negative correlation) to 1 (perfect positive correlation), with 0 indicating no linear relationship.
It visually plots the correlation line, marks 1, 0, -1 reference levels, and fills the perfect correlation zone for clear visualization.
Special Feature: The code includes ticker.modify, ensuring that the comparative symbol's data accounts for dividend adjustments or extended trading hours, leading to more precise correlation analysis.
Moving Average (MA) for Correlation:
To smooth out short-term fluctuations in the correlation coefficient, the indicator offers multiple MA types for you to choose from: SMA, EMA, WMA, SMMA.
You can set the length of the MA period (default 20 periods).
This MA line helps identify the long-term trend of the correlation coefficient, indicating whether the relationship between the two instruments is strengthening or weakening.
Bollinger Bands (BB) for Correlation:
Bollinger Bands are applied to the correlation coefficient itself to gauge its volatility and relative high/low levels.
The middle band aligns with your chosen Moving Average.
The upper and lower bands dynamically adjust based on the correlation coefficient's standard deviation and your set Z-score (default 2.0 standard deviations).
Bollinger Bands can help you identify when the correlation coefficient is at extreme levels, potentially signaling a future reversion to the mean.
How to Utilize This Indicator:
Pair Trading Strategies: When two typically highly correlated assets show a significant short-term deviation from their average correlation (e.g., one asset's price rises while the other stagnates), you might consider exploiting this "imbalance" for pair trading.
Portfolio Diversification: Understanding the correlation between different assets helps build a more robust investment portfolio, preventing over-concentration in co-moving assets and effectively diversifying risk.
Market Trend Insight: By observing the trend and volatility of the correlation coefficient, you can better understand the联动 (interconnectedness) between different market sectors or asset classes, providing data support for your macroeconomic analysis.
Please note that correlation does not imply causation. When using this indicator, combine it with your overall trading strategy, macroeconomic analysis, and other technical indicators for comprehensive decision-making.

Linear Regression Channel – shiftableThis is the built-in Linear Regression Channel with an extra parameter to shift it back N days.

ADR TableTrack volatility and session momentum in real-time with customizable precision.
Key Features:
Average Daily Range (ADR): Configurable length (default 5 days), based on previous daily high–low ranges.
Session Anchor Options: Choose anchor at 4 am NY, 6 pm NY, 9:30 am NY, 8:30 am NY, Previous Day Close, or Current Bar.
Session Range & %ADR: Displays the real-time range from the chosen anchor, plus what percentage of ADR has been covered.
High / Low Target Levels: Calculates ADR targets based on anchor: anchor ± ADR.
Optional Target Lines: Draw horizontal lines for high and low targets across the session; customize color and width.
Dynamic Table Display: User-selectable table size and text size (Tiny to Huge) for optimal readability.
Robust Anchor Logic: Uses the first bar at-or-after anchor time each NY day, ensuring stability even on irregular intraday timeframes.
How to Use
Choose your anchor in settings.
View ADR, session range (with %ADR), and target price levels in the top-right pane.Toggle High/Low lines to overlay targets on the chart.
Adjust table and text size to match your workspace.
Why It Matters
Quickly assess where price stands relative to typical volatility.
Easily identify intraday price exhaustion or breakout zones.
Anchor flexibility enables use for both futures and equities, aligning with your trading session.
Clean, professional display—no clutter, no guesswork.

Trend Confluence Indicator identify potential trend reversals by combining signals from three popular technical indicators: MACD, Stochastic Oscillator, and ADX.
Here's a breakdown of its components and how it defines confluence:
MACD (Moving Average Convergence Divergence):
Purpose: This indicator helps to spot changes in the strength, direction, momentum, and duration of a trend.
Signals:
A bullish MACD signal is generated when the MACD line crosses above its signal line, indicating increasing bullish momentum.
A bearish MACD signal is generated when the MACD line crosses below its signal line, indicating increasing bearish momentum.
Stochastic Oscillator:
Purpose: This momentum indicator compares a security's closing price to its price range over a given period, identifying overbought and oversold conditions. It also shows momentum shifts.
Signals:
A bullish Stochastic signal is typically a crossover of the %K line above the %D line.
A bearish Stochastic signal is a crossover of the %K line below the %D line.
ADX (Average Directional Index):
Purpose: The ADX measures the strength of a trend, not its direction. Higher ADX values indicate a stronger trend, while lower values suggest a weak or ranging market.
Role in Confluence: For reversal signals, the indicator looks for the ADX to be below a specified threshold (defaulting to 25). The idea is that reversals are more likely to occur when the existing trend is weak or the market is consolidating, rather than when a strong trend is in full force.
How Confluence is Currently Defined (Simplified for Debugging):
In its current state (with the debugging simplification active in the Canvas), a signal is generated when:
Bullish Reversal (Trend Up): The MACD line crosses above its signal line AND the Stochastic %K line crosses above its %D line.
Bearish Reversal (Trend Down): The MACD line crosses below its signal line AND the Stochastic %K line crosses below its %D line.
When these simplified conditions are met, the indicator plots "Reversal Up" (▲) or "Reversal Down" (▼) labels directly on your chart. It also plots the individual MACD, Stochastic, and ADX lines on separate sub-panes to help you visualize the underlying indicator movements.
Original (More Comprehensive) Confluence (Commented Out):
The Canvas also contains commented-out code for the original, more stringent confluence conditions. These would have added further filters:
For Bullish Reversal: The Stochastic %K and %D lines would also need to be below the stochOversold level (e.g., 20) when the crossover occurred, and the ADX would need to be below the adxThreshold.
For Bearish Reversal: The Stochastic %K and %D lines would also need to be above the stochOverbought level (e.g., 80) when the crossover occurred, and the ADX would need to be below the adxThreshold.
Once you confirm the indicator is showing signals with the simplified logic, you can uncomment these original lines in the Canvas to activate the more precise confluence criteria, or adjust the input parameters to fine-tune its sensitivity.

Trend Reversal ConfluenceThe "Trend Reversal Confluence Indicator" I just made is designed to identify potential trend reversals by looking for a strong alignment (confluence) of signals from three different technical indicators:
MACD (Moving Average Convergence Divergence): This indicator is used to detect shifts in momentum.
A bullish MACD signal occurs when the MACD line crosses above its signal line.
A bearish MACD signal occurs when the MACD line crosses below its signal line.
Stochastic Oscillator: This momentum indicator identifies overbought and oversold conditions, as well as potential shifts in momentum.
A bullish Stochastic signal is typically a crossover of the %K line above the %D line, especially when both are coming out of oversold territory (below 20).
A bearish Stochastic signal is a crossover of the %K line below the %D line, especially when both are coming out of overbought territory (above 80).
ADX (Average Directional Index): This indicator measures the strength of a trend.
For reversal signals, the indicator looks for the ADX to be below a certain threshold (e.g., 25 by default). This suggests that the current trend is weak or the market is ranging, making it a more opportune time for a reversal to occur rather than a continuation of a strong trend.
How Confluence is Defined (Simplified for Debugging):
Currently, for debugging purposes, the indicator's confluence for a signal is simplified to:
Bullish Reversal: When the MACD line crosses above its signal line AND the Stochastic %K line crosses above its %D line.
Bearish Reversal: When the MACD line crosses below its signal line AND the Stochastic %K line crosses below its %D line.
Original Confluence (Commented Out in the Code):
The original, more stringent confluence conditions (which are currently commented out in the Canvas but can be reactivated) also included:
For Bullish Reversal: The Stochastic %K and %D lines also needed to be below the oversold level (e.g., 20) when the crossover occurred, and the ADX needed to be below the adxThreshold.
For Bearish Reversal: The Stochastic %K and %D lines also needed to be above the overbought level (e.g., 80) when the crossover occurred, and the ADX needed to be below the adxThreshold.
When these combined conditions are met, the indicator plots "Reversal Up" (▲) or "Reversal Down" (▼) labels directly on your chart, indicating a strong confluence of factors suggesting a potential trend change. You can also see the individual indicator plots (MACD, Stochastic, ADX) on separate panes to understand the components of the signal.

Economy RadarEconomy Radar — Key US Macro Indicators Visualized
A handy tool for traders and investors to monitor major US economic data in one chart.
Includes:
Inflation: CPI, PCE, yearly %, expectations
Monetary policy: Fed funds rate, M2 money supply
Labor market: Unemployment, jobless claims, consumer sentiment
Economy & markets: GDP, 10Y yield, US Dollar Index (DXY)
Options:
Toggle indicators on/off
Customizable colors
Tooltips explain each metric (in Russian & English)
Perfect for spotting economic cycles and supporting trading decisions.
Add to your chart and get a clear macro picture instantly!

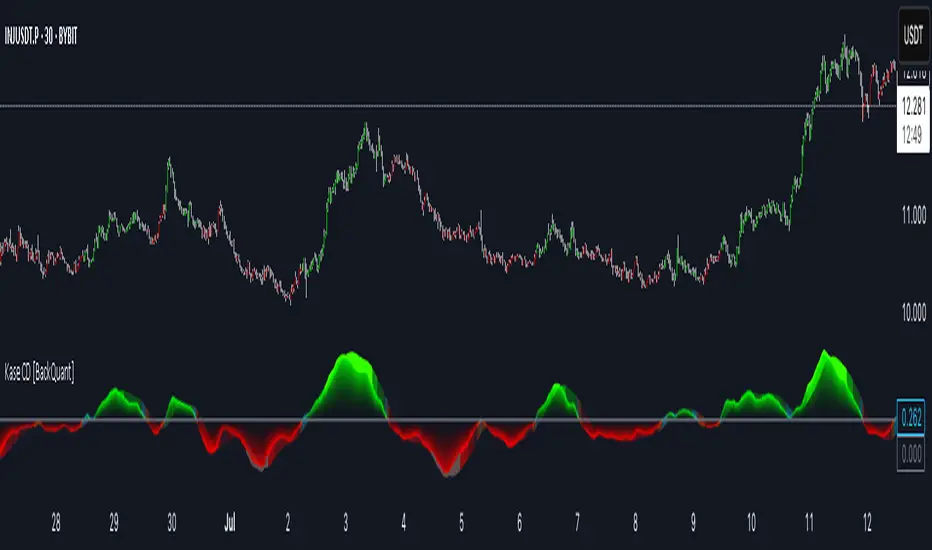
Kase Convergence Divergence [BackQuant]Kase Convergence Divergence
The Kase Convergence Divergence is a sophisticated oscillator designed to measure directional market strength through the lens of volatility-adjusted log return structures. Inspired by Cynthia Kase’s work on statistical momentum and price projection ranges, this unique indicator offers a hybrid framework that merges signal processing, multi-length sweep logic, and adaptive smoothing techniques.
Unlike traditional momentum oscillators like MACD or RSI, which rely on static moving average differences, KCD introduces a dual-process system combining:
Kase-style statistical range projection (via log returns and volatility),
A sweeping loop of lookback lengths for robustness,
First and second derivative modes to capture both velocity and acceleration of price movement.
Core Logic & Computation
The KCD calculation is centered on two volatility-normalized transforms:
KSDI Up: Measures how far the current high has moved relative to a past low, normalized by return volatility.
KSDI Down: Measures how far the current low has moved relative to a past high, also normalized.
For every length in a user-defined sweep range (e.g., 25–35), both KSDI_up and KSDI_dn are computed, and their maximum values across the loop are retained. The difference between these two max values produces the raw signal:
KPO (Kase Projection Oscillator): Measures directional skew.
KCD (Kase Convergence Divergence): Defined as KPO – MA(KPO) — similar in spirit to MACD but structurally different.
Users can choose to visualize either the first derivative (KPO) , or the second derivative (KCD) , depending on market conditions or strategy style.
Key Features
✅ Multi-Length Sweep Logic: Improves signal reliability by aggregating statistical range projections across a set of lookbacks.
✅ Advanced Smoothing Modes: Supports DEMA, HMA, TEMA, LINREG, WMA and more for dynamic adaptation.
✅ Dual Derivative Modes: Choose between speed (first derivative) or smoothness (second derivative) to fit your trading regime.
✅ Color-Encoded Signal Bands: Heatmap-style oscillator coloring enhances visual feedback on trend strength.
✅ Candlestick Painting: Optional bar coloring makes it easy to spot trend shifts on the main chart.
✅ Adaptive Fill Zones: Green and red fills between the oscillator and zero line help distinguish bullish and bearish regimes at a glance.
Practical Applications
📈 Trend Confirmation: Use KCD as a secondary confirmation layer after breakout or pullback entries.
📉 Momentum Shifts: Crossover and crossunder of the zero line highlight potential regime changes.
📊 Strategy Filters: Incorporate into algos to avoid trendless or mean-reverting environments.
🧪 Derivative Switching: Flip between KPO and KCD modes depending on whether you want to measure acceleration or deceleration of price flow.
Alerts & Signals
Two built-in alerts help you catch regime shifts in real time:
Long Signal: Triggered when the selected oscillator crosses above zero.
Short Signal: Triggered when it crosses below zero.
These events can be used to generate entries, exits, or trend validation cues in multi-layer systems.
Conclusion
The Kase Convergence Divergence goes beyond traditional oscillators by offering a volatility-normalized, derivative-aware signal engine with enhanced visual dynamics. Its sweeping architecture and dynamic fill logic make it especially powerful for identifying trending environments, filtering chop, and adding statistical rigor to your trading toolkit.
Whether you’re a discretionary trader seeking precision, or a quant looking to model more robust return structures, KCD offers a creative yet analytically grounded solution.
ZYTX RSI SuperTrendZYTX RSI SuperTrend
ZYTX RSI + SuperTrend Strategy
The definitive integration of RSI and SuperTrend trend-following indicators, delivering exemplary performance in automated trading bots.

ZYTX CCI SuperTrendZYTX CCI SuperTrend
The definitive integration of CCI and SuperTrend trend-following indicators, delivering exemplary performance in automated trading bots.

ZYTX SuperTrend V1ZYTX SuperTrend V1 Indicator
Multi-strategy intelligent rebalancing with >95% win rate
Enables 24/7 automated trading

ZYTX GKDDThe ZYTX High-Sell Low-Buy Indicator Strategy is a trend-following indicator that integrates multiple indicator resonances. It demonstrates the perfect performance of an automated trading robot, truly achieving the high-sell low-buy strategy in trading.

💚 Simple RSI by Markking77Jaaneman, ab jo tumhara chart ready hua hai — with SMC Premium Concepts + CHoCH + BOS + OB + FVG aur niche Simple RSI by Markking77 — uske liye ek premium-level indicator description ready ki hai jo aap TradingView mein publish karne ke waqt use kar sakte ho. Ye description professional bhi lagega aur powerful bhi
📈 SMC Premium Concepts + CHoCH + BOS + OB + FVG | Smart RSI by Markking77
🔍 Overview: This premium indicator combines the most effective Smart Money Concepts (SMC) into a clean and powerful tool designed for serious traders. It includes:
✅ Break of Structure (BOS)
✅ Change of Character (CHoCH)
✅ Order Blocks (OB)
✅ Fair Value Gaps (FVG)
✅ Minimal, High-Impact Labels
✅ Smart RSI for Confluence
🎯 Only key BOS/CHoCH points (around 12–13 across chart) are shown to reduce noise and improve decision-making. This avoids clutter and highlights only major structural shifts in the market.
