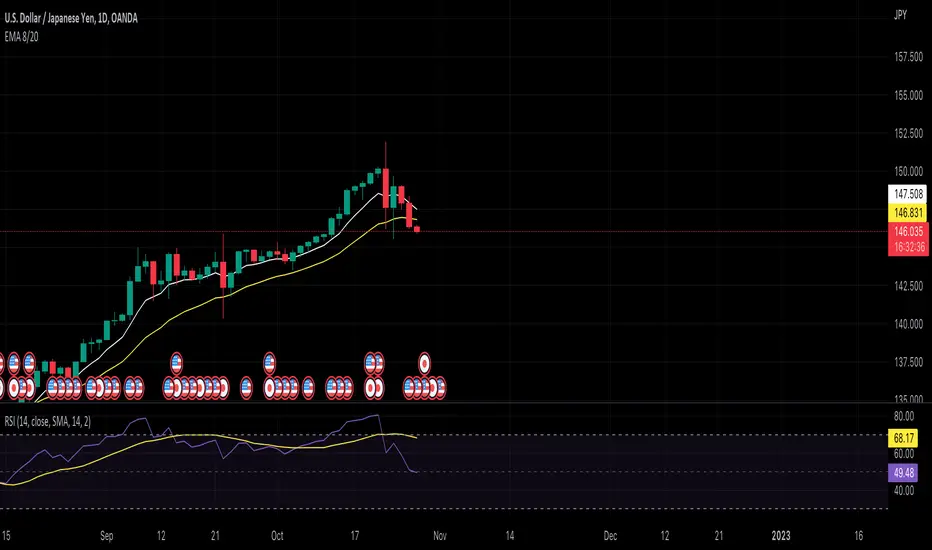
EMA 8/20Overlay the 8- and 20-period exponential moving averages.
Also known as an exponentially weighted moving average, the EMA gives more significance to recent periods compared to an SMA (simple moving average).
Learn more about the EMA on Investopedia
20
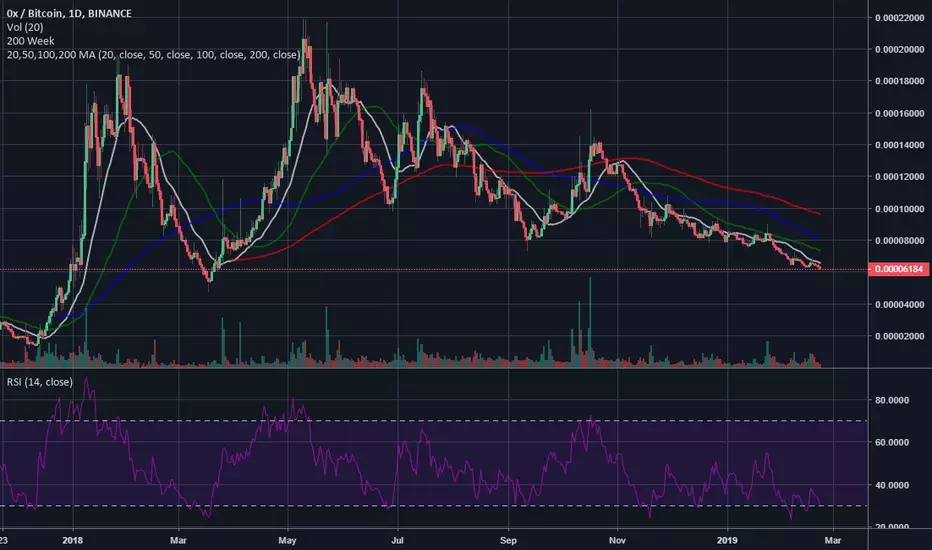
ln(close/20 sma) adjusted for time (BTC)(This indicator was designed for the BTC index chart)
Designed for Bitcoin. Plots the log of the close/20W SMA with a linear offset m*t, where m is the gradient I've chosen and t is the candle index. Anything above 1 is a mania phase/market cycle top. If it peaks around 0.92 and rolls over, it could be a local/market cycle top.
This will obviously not work at all in the long term as Bitcoin will not continue following the trend line on the log plot (you can even see it start to deviate in the Jan-Feb 2021 peaks where the indicator went to 1.15).
It identifies the 2011, 2013 (both of them), 2017 tops as being just above 1. It also identifies the 2019 local peak and 2021 market cycle top at ~0.94.
Feel free to change the gradient or even add a function to curve the straight line eventually. I made this for fun, feel free to use it as you wish.

Triple EMA (20, 50, 200) w/ LabelsI've combined the 20, 50, and 200 day exponential moving averages and added labels.
I created this due to finding EMA scripts that are either nothing but ugly to look at or have extra "features" that serve no purpose.
This gets rid of the clutter and gives a simple triple EMA with labels.
Labels are optional, you can turn them off in the settings.

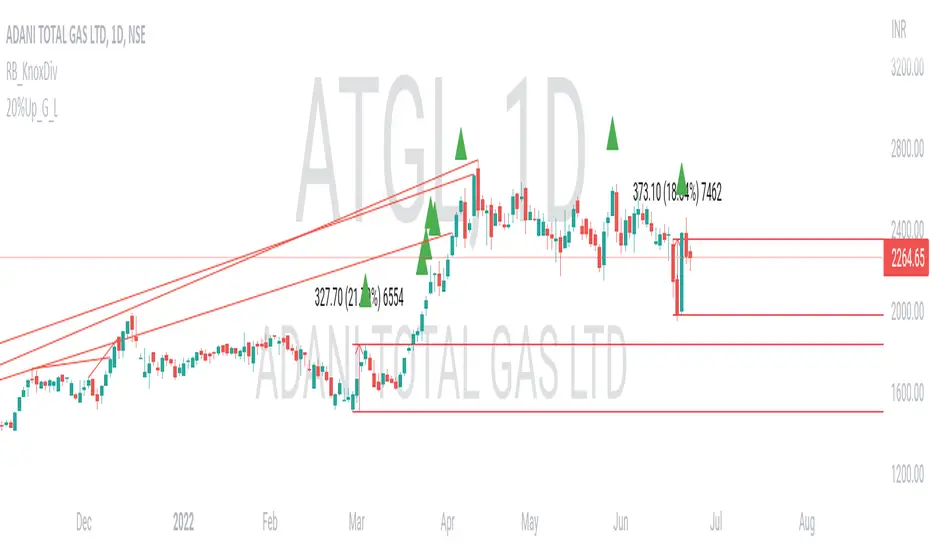
20% up with all continuously green candle: Lovevanshi It can be used to get the indication for 20% up movement among all continuously green candles formed in past. It is suitable for Indian company stock for short term trading plans.
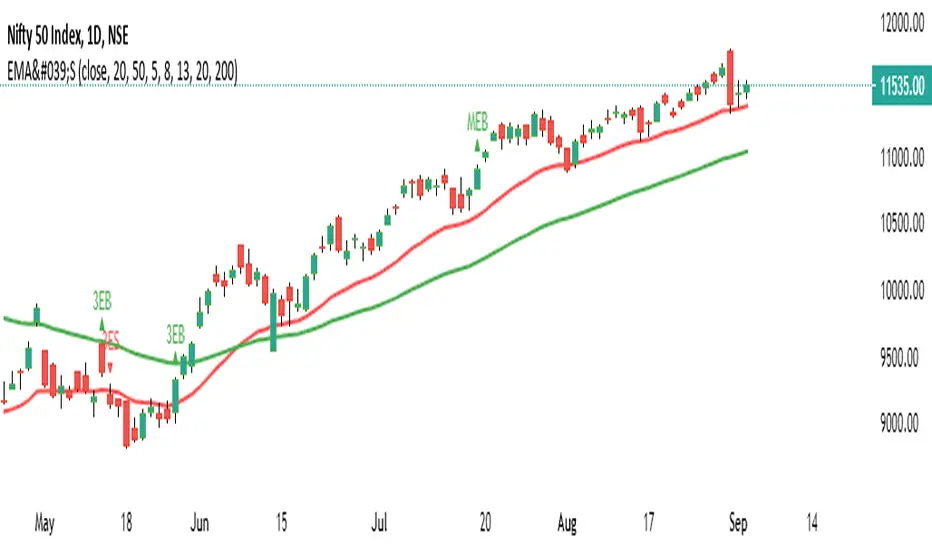
5-8-13 & 20-200 EMA Cross Over1) Popular EMA cross over combined as on indicator daily time frame
2) 5-8-13 for Swing 3EB- Bullish 3ES - Bearish
3) 20-200 EMA Cross over called as multi-bagger cross over with an inverted triangle in a smaller period of time
MEB - Bullish 20 ema crossed 200 ema, MES - Bearish vice versa
4) Simultaneously 20 50 are plotted in the graph as user input can be changed to according to user specific
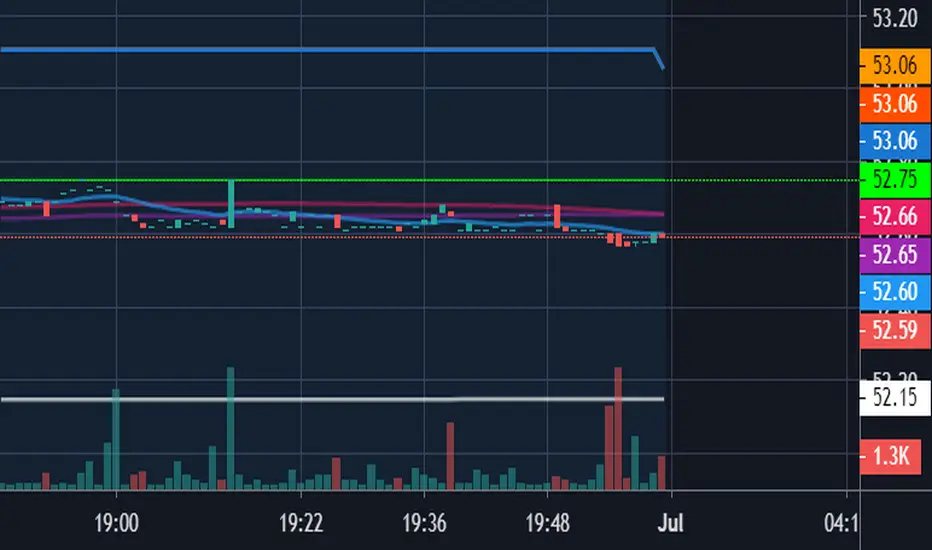
20 EMA Daily Moving Average to Intraday ChartCredits to freedom_trader_
20 EMA to intra day chart, enjoy!