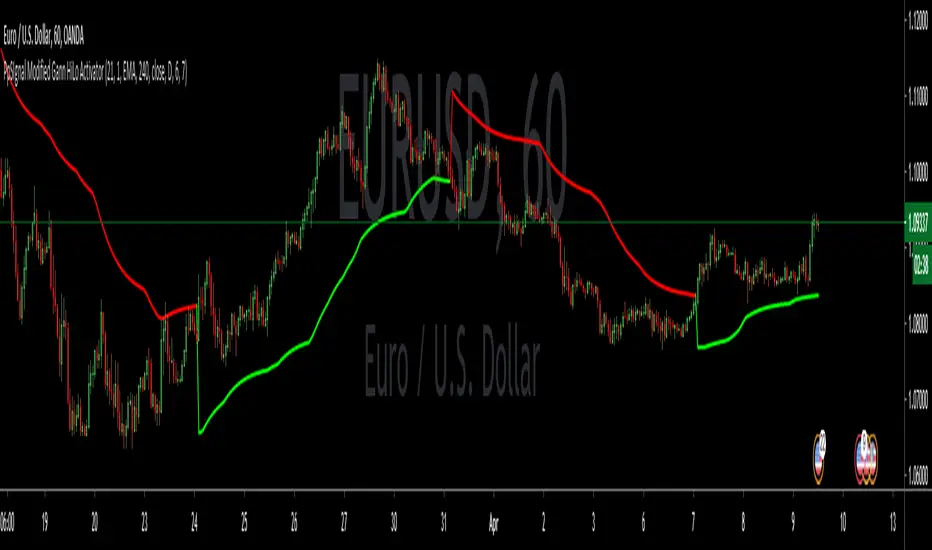
PpSIgnal Modified Gann HiLo ActivatorGann Hi Lo Activator Indicator fue desarrollado inicialmente por Robert Krausz.
El gann Hilo Original es simplemente un promedio móvil de los tres períodos anteriores, bajo o alto.
Yo lo he cambiado por precio de apertura y precio de cierre para evitar repintes .
Este indicador de seguimiento de tendencia, se utiliza para determinar la tendencia del mercado y también para identificar las señales de negociación.
Pero cuando el mercado está lateralizado, le resulta difícil generar señales comerciales precisas. Puede interpretar el indicador leyéndolo de la siguiente manera. En un mercado de tendencia alcista, el indicador pe [pintara de verde en tendecia bajista de rojo.
también le hemos agregado un media movil Tilson para hacer scaplin dentro de una tendencia definida.
Gann Hi Lo Activator Indicator was originally developed by Robert Krausz.
The Original Gann is simply a moving average of the previous three periods, low or high.
I have changed it for the opening price and the closing price to avoid repainting.
This trend monitoring indicator is used to determine the market trend and also to identify trading signals.
But when the market is lateralized, it is difficult for you to generate accurate trading signals. You can interpret the indicator by reading it as follows. In an uptrend market, the indicator pe [will paint green in a downtrend red.
We have also added a Tilson moving average to scaplin within a defined trend.
1-BTCUSD
QUICK BITCOIN VALUATION ~ FILBFILBThis indicator uses On chain Transactions and Total Bitcoins to arrive at an under/over valuation.
>1 Overvalued
<1 Undervalued
>2 - Severe Overvaluation
<0.5 Severe Undervaluation
You need to change the scale to Log, i couldn't work out how to do it, if you can tell me i will update the script.
** Review previous day's candles to avoid transactional lag. **

Blockchain Data ~ FILBFILBOne Indicator with Blockchain info.
Total Circulating BTC
Number Of Transactions
Miners Revenue
Estimated Transaction Volume USD
Estimated Transaction Volume BTC
Bitcoin Market Cap
Difficulty

XBT % ContangoSimilar to my other indicators, but measures XBTUSD Contango in terms of percent.
Also, built it so you could change the values that give the red and green signals. Default values are 0% or less (backwardation) indicates green. However, i found that a 0.5% setting worked will finding local bottoms for current contract of XBTH20 (March 2020). The upper value default is at 5%, and signals red when the next contract reaches over 5%.
My assumption is as BTC increases in value over time, measuring contango in terms of percent will be a better measure of the XBT futures curve.

Ichimoku Clouds Strong Bullish/Bearish signals and alertsIchimoku Clouds Strong Bullish/Bearish signals with allerts
The Ichimoku cloud was developed by Goichi Hosoda, a Japanese journalist, and published in the late 1960s. It provides more data points than the standard candlestick chart. While it seems complicated at first glance, those familiar with how to read the charts often find it easy to understand with well-defined trading signals.
We provide you easy-to-use script which helps to decrypt meaning of lines in the indicator. The script takes Ichimoku clouds indicator formulas to calculate Tenkan, Kijun, SenkouA, SenkouB values and examines them in order to produce buy ( Bullish ) and sell ( Bearish ) signals which are displayed at the chart
The most appropriate time frame is 30m
Custom alerts are added to send you a notice with a webhook when bullish or bearish signal arrives.
You can easily add weak and neutral signals alerts by removing "//" in a specified place
Feel free to copy and use this script for your ideas and trading. You can modify the script by adding Parabolic SAR in order to increase accuracy of positions closure

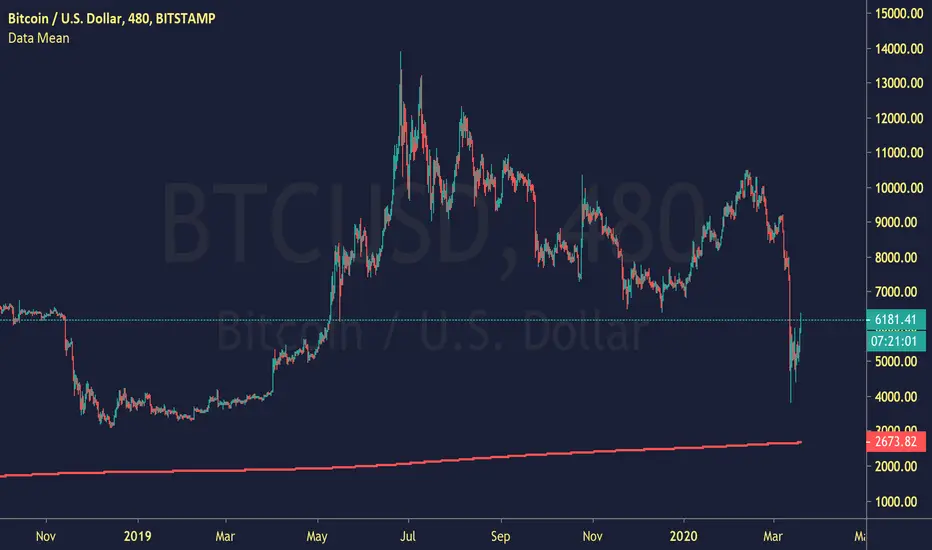
Data MeanCalculating the Mean, given a set of data.
I'd assume BTCUSD needs to touch this on the daily, as it hasn't yet.
"reverting to the mean" is essential in market dynamics.
Cuban's BTCUSD Spot Buying GuideI have been using a few different spreads to track market sentiment for $BTCUSD over the last 12 months, and has worked out very favourably.
Although it's a low sample size, I feel as the market has become more efficient, these signals have become more accurate. Obviously, alpha decay will slowly arb these out but I thought I would share this rough guide.
There are many ways you can use these buy opportunities. I recommend buying after waiting for the candle to flip white (from green), this will be accompanied by the text, 'SPOT'. However, aggressive entries can be taken by slowly averaging in while the candle colouring is green.
I have left out any take profit strategy, as I will leave this to the user.
Enjoy!

PpSignal drake delay oscillator GritasIt is a technique, when the drake oscillator moving averages (Drake Daly Statocastico) cross up you must buy and the histogram is painted in a green color .... when the drake oscillator crosses down and the histogram is painted red you must to sell.

inwCoin Average Position Price Calculator - For CryptocurrencyEver wonder what is my average entry ?
No need to use excel.
Just use this simple indicator to calculate average entry of your multiple positions.
How to use
--------------
1) Just input your entries into each box. ( Buy price + buy amount )
2) If you don't want to use any input, just uncheck the checkbox.
How to read value
----------------------
- This indicator will calculate the asset amount you got when you purchase it, by asset amount = entry amount / entry price ( Eg. buy BTC at 10,000$ per BTC with 1,000 USD = 1000/10000 = 0.1 BTC )
- It will calculate your current value of the asset you holding and compare it with all of the money you already invested. Also the profit/loss.
- It will show the average entry price with the green line on the chart and in the textbox.

Cracking Cryptocurrency - Bottom FeederThe Bottom Feeder
The Bottom Feeder is designed to algorithmically detect significantly oversold conditions in price that represent profitable buying opportunities. Combining this with it’s unique Stop and Target System, the Bottom Feeder is designed to return consistent return with minimal draw down. Whether used as a Market Bottom Detector or as a system for executing safe, profitable mean reversion trades, the Bottom Feeder is a powerful tool in any trader’s arsenal.
Bottom Feeder was designed to be used on BTCUSD , however it is also effective on other USD/USDT pairs. One will have to check the individual pair they wish to trade with the Strategy Tester to simulate performance.
Options
Let’s go through the input options one by one, so that you are able to comfortably navigate all that this indicator has to offer. The link below will display a picture of the layout of the settings for your convenience.
For the sake of simplicity, let’s note now that all settings marked **Conservative Mode** will not work in Aggressive Mode.
Mode: Determines how aggressively Bottom Feeder generates a buy signal. In Conservative Mode, trades can only be opened once per candle and the stop and target will update as new signals appear. In Aggressive Mode, a separate trade is opened each time Bottom Feeder signals, which may be multiple times within one Daily candle.
Plot Target and Stop Loss: Toggles on/off the visualized take profit and stop losses on the chart.
**Conservative Mode** TP Multiplier: This is an input box, it requires a float value. That is, it can accept either a whole number integer or a number with a decimal. This number will determine your Take Profit target. It will take whatever number is entered into this box and multiply the Average True Range against it to determine your Take Profit.
**Conservative Mode** SL Multiplier: See above - this will modify your Stop Loss Value.
**Conservative Mode** Average or Median True Range: This is a drop-down option, the two options are Average True Range or Median True Range. If Average True Range is selected, then this indicator will use the Average True Range calculation, that is, the average of a historical set of True Range values to determine the Average True Range value for Target and Stop Loss calculation. If Median True Range is selected, it will not take an average and will instead take the Median value of your historical look back period.
**Conservative Mode** True Range Length: This is an input that requires an integer. This will represent your historical look back period for Average/Median True Range calculation.
**Conservative Mode** True Range Smoothing: This is a drop-down with the following options: Exponential Moving Average ( EMA ), Simple Moving Average ( SMA ), Weighted Moving Average ( WMA ), Relative Moving Average (RMA). This will determine the smoothing type for calculating the Average True Range if it is selected. Note: if Median True Range is selected above, this option will not have any effect as there is no smoothing for a Median value.
**Conservative Mode** Custom True Range Value?: This is a true/false option that is false by default. If enabled, it will override the Average/Median True Range calculation in favor of a users custom True Range value to be input below.
**Conservative Mode** Custom True Range Value: This is an input box that requires a float value. If Custom True Range is enabled this is where a user will input their desired custom True Range value for Target and Stop Loss calculation.
Stop and Target Description
Because Bottom Feeder is designed only to scalp the various market bottoms that can appear over time in the market and not to identify trends or to trade ranges, it’s imperative that the indicator notify us not just to when to enter our trades, but when to exit! In the service of that, CC Bottom Feeder has a built in Stop and Target system that tracks and displays the stop loss and take profit levels of each individual open trade, whether in Aggressive or Conservative Mode.
Conservative Mode Targeting: In Conservative Mode, Bottom Feeder signals are aggregated into a compound trade. The signal will appear as a green label pointing up below a candle, and will appear upon a candle close. If Bottom Feeder then generates another signal the stop loss and target price will be updated. The process will continue until the aggregated trade completes in either direction. On a trade with multiple signals, a larger position is slowly entered into upon each buy signal.
Aggressive Mode Targeting: In Aggressive Mode, Bottom Feeder signals are individually displayed as they are generated, regardless of how many signals are generated on any single candle. If Bottom Feeder continues to signal, each individual open trade will have their own stop loss and target that will be displayed on the chart until the individual trade completes in either direction. As opposed to a large compound position, aggressive mode represents a higher number of independent signals with their own stop and target levels.
Stop losses and targets are designed to be hard, not soft. That is, they are intended to be stop market orders, not mental stop losses. If price wicks through the target or stop, it will activate.

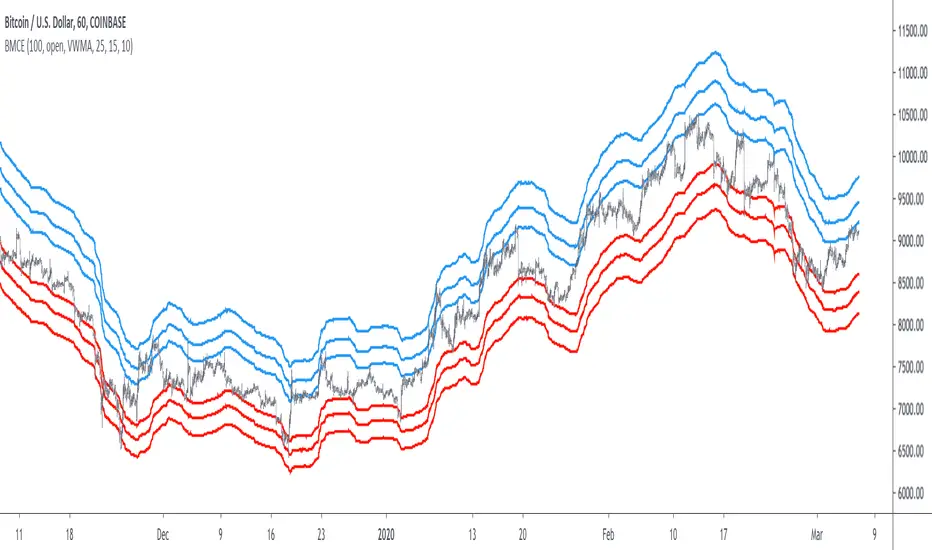
Bitcoin Margin Call Envelopes [saraphig & alexgrover]Bitcoin is the most well known digital currency, and allow two parties to make a transaction without the need of a central entity, this is why cryptocurrencies are said to be decentralized, there is no central unit in the transaction network, this can be achieved thanks to cryptography. Bitcoin is also the most traded cryptocurrency and has the largest market capitalization, this make it one of the most liquid cryptocurrency.
There has been tons of academic research studying the profitability of Bitcoin as well as its role as a safe heaven asset, with all giving mixed conclusions, some says that Bitcoin is to risky to be considered as an hedging instrument while others highlight similarities between Bitcoin and gold thus showing evidence on the usefulness of Bitcoin acting as an hedging instrument. Yet Bitcoin seems to attract more short term speculative investors rather than other ones that would use Bitcoin as an hedging instrument.
Once introduced, cryptocurrencies where of course heavily analyzed by technical analyst, and technical indicators where used by retail as well as institutional investors in order to forecast the future trends of bitcoin. I never really liked the idea of designing indicators that specifically worked for only one type of market and ever less on only one symbol. Yet the user @saraphig posted in Feb 20 an indicator called " Margin Call MovingAverage " who calculate liquidation price by using a volume weighted moving average. It took my attention and we decided to work together on a relatively more complete version that would include resistances levels.
I believe the proposed indicator might result useful to some users, the code also show a way to restrict the use of an indicator to only one symbol (line 9 to 16).
The Indicator
The indicator only work on BTCUSD, if you use another symbol you should see the following message:
The indicator plot 6 extremities, with 3 upper (resistance) extremities and 3 lower (support) extremities, each one based on the isolated margin mode liquidation price formula:
UPlp = MA/Leverage × (Leverage+1-(Leverage*0.005))
for upper extremities and:
DNlp = MA × Leverage/(Leverage+1-(Leverage*0.005))
for lower extremities.
Length control the period of the moving averages, with higher values of length increasing the probability of the price crossing an extremity. The Leverage's settings control how far away their associated extremities are from the price, with lower values of Leverage making the extremity farther away from the price, Leverage 3 control Up3 and Dn3, Leverage 2 control Up2 and Dn2, Leverage 1 control Up1 and Dn1, @saraphig recommend values for Leverage of either : 25, 20, 15, 10 ,5.
You can select 3 different types of moving average, the default moving average is the volume weighted moving average (VWMA), you can also choose a simple moving average (SMA) and the Kaufman adaptive moving average (KAMA).
Based on my understanding (which could be wrong) the original indicator aim to highlight points where margin calls might have occurred, hence the name of the indicator.
If you want a more "DSP" like description then i would say that each extremity represent a low-pass filter with a passband greater than 1 for upper extremities and lower than 1 for lower extremities, unlike bands indicators made by adding/subtracting a volatility indicator from another moving average this allow to conserve the original shape of the moving average, the downside of it being the inability to show properly on different scales.
here length = 200, on a 1h tf, each extremities are able to detect short-terms tops and bottoms. The extremity become wider when using lower time-frames.
You would then need to increase the Leverages settings, i recommend a time frame of 1h.
Conclusion
I'am not comfortable enough to make a conclusion, as i don't know the indicator that well, however i liked the original indicator posted by @saraphig and was curious about the idea behind it, studying the effect of margin calls on market liquidity as well as making indicators based on it might result a source of inspiration for other traders.
A big thanks to @saraphig who shared a lot of information about the original indicator and allowed me to post this one. I don't exclude working with him/her in the future, i invite you to follow him/her:
www.tradingview.com
Thx for reading and have a nice weekend! :3
RSI & StochasticA combination of RSI and Stochastic using default settings.
- RSI or Relative Strength Index is the white line.
- Stochastic %K is the aqua line
- Stochastic %D is the orange line
- The purple rectangle is the RSI range going from 30 (oversold) at the bottom to 70 (overbought)
- The top dotted line indicates the price being overbought on the stochastic
- The bottom dotted line indicates the price oversold on the stochastic
I mainly use both indicators to spot divergence/ potential upcoming turning points (tops or bottoms).
For example on the chart the white line shows the price of Bitcoin Rising
While the yellow line shows the stochastic declining and the red RSI stayed more or less at the same level.
Another way to use this indicator is to use the aqua line crossing above the orange line as an entry for a long trade this strategy is most useful when both are near the bottom of the range. The opposite is true for short trades but
both should be combined with other indicators such as moving averages support levels or volume for best results.
Generally RSI is more useful in trending markets & the stochastic is more useful in sideways or choppy markets.

Bitcoin Cycle Top IndicatorBitcoin Cycle Top Indicator on the 1W Bitcoin Logarithmic chart.
Called all 3 tops so far to a T, this indicator will be great use for the next upcoming cycle.
I kept it sweet and simple, no need to overcomplicate. That's all this indicator does.

PRIME+ EMASPRIME+ EMAS is an indicator that allows you to see some of the best hourly, daily, weekly and monthly EMAs/SMAs for trading cryptocurrencies; in particular Bitcoin.
These are timeframe-fixed EMAs/SMAs, which means that they will provide you with the same data in all timeframes, unlike most EMAs/SMAs indicators out there.
You also have the option to show them in full or a simplified version of them to declutter your chart.
This PRIME+ version also has 3m timeframe EMAs for a more detailed analysis of the market.
For access and questions, please message me here on TradingView. I will be happy to help!

PRIME - EMASPRIME - EMAS is an indicator that allows you to see some of the best hourly, daily, weekly and monthly EMAs/SMAs for trading cryptocurrencies; in particular Bitcoin.
These are timeframe-fixed EMAs/SMAs, which means that they will provide you with the same data in all timeframes, unlike most EMAs/SMAs indicators out there.
You also have the option to show them in full or a simplified version of them to declutter your chart.
For access and questions, please message me here on TradingView. I will be happy to help!

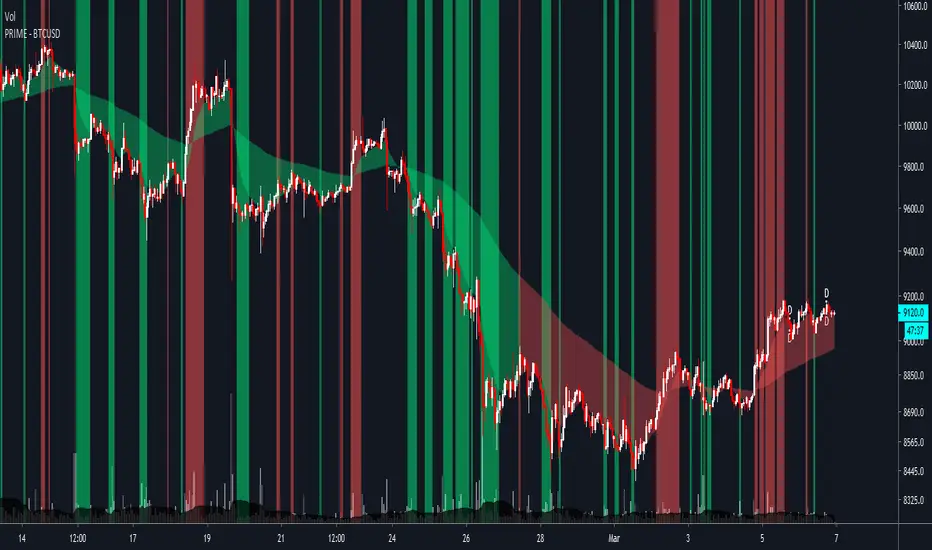
PRIME - BTCUSD - BYBITPRIME is a hyper-focused indicator made for a specific asset and timeframes. The goal of the indicator is to help you simplify and optimize your trading.
As of writing this, the indicator is optimized for the 1H and 4H timeframes.
The indicator will provide you with:
Potential buy and sell zones (the green and red vertical lines/flashes).
The trend of the market, with the cloud as support/resistance.
And the daily, weekly and monthly closes (as D, W and M).
In addition to these, the indicator also comes with the following alerts:
BUY ZONE
SELL ZONE
STOPPED FLASHING
CLOUD TOP X
CLOUD BOTTOM X
These alerts will allow you to know when some of the best opportunities in the market might be present.
This specific version of the indicator is for BTCUSD . However, I can adjust it to your favorite asset.
For access, questions, and full documentation, please message me here on TradingView.
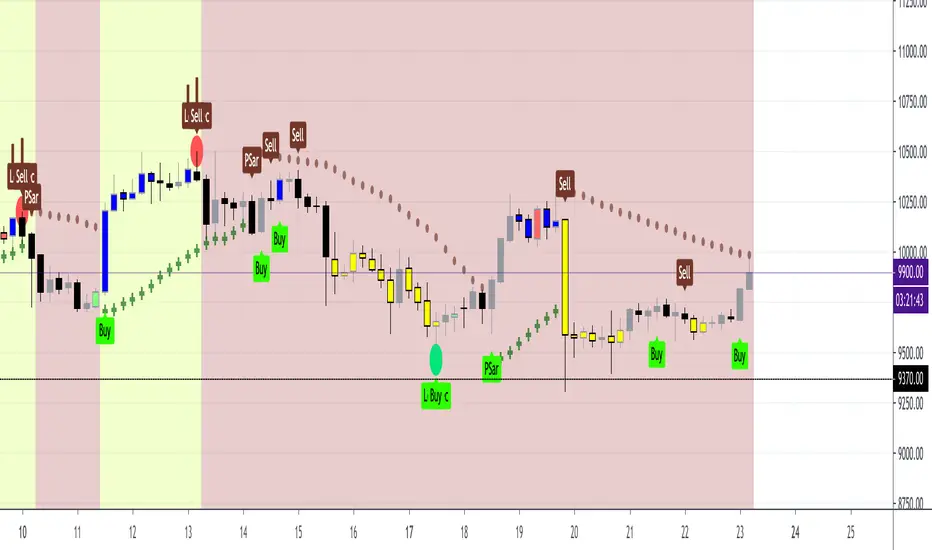
BTC Bullish or Bearish (Joy)Quite often we are faced with the question of whether Bitcoin is macro bullish or bearish.
I tried to take a punch at this.
There many ways to find that answer.
This is one crude way.
Whenever the background colour is light lime, it means it thinks the Bitcoin is macro bullish
Whenever the background colour is red lime, it means it thinks the Bitcoin is macro bearish
How would I use this information?
I can possibly use it in position sizing and hedging. If I see a sell in a lime background, I can potentially just hedge & vice versa.
Do note that it works best in the higher timeframes.
Do note that it is not supposed to be used to open any new trade or to close any trade.
I use it alongside other indicators for confirmation bias.
This can possibly be used for other instruments. As I only use it for trading BTCUSD, I have crudely tested for BTCUSD
For info on gaining access see the ⬇ link below ⬇ in our signature field & direct message me. I have a busy schedule at my own workplace. Trading is my hobby. Hence, please be kind to me if I am late in replying.
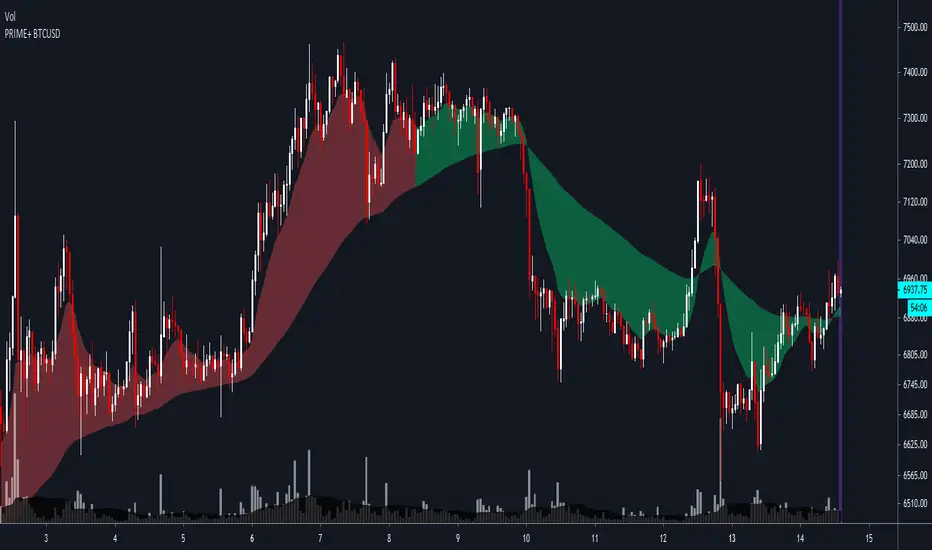
PRIME+ BTCUSDPRIME+ is a hyper-focused indicator made for a specific asset and timeframes. The goal of the indicator is to help you simplify and optimize your trading.
As of writing this, the indicator is optimized for the 3m and 1H timeframes.
The indicator will provide you with:
Potential buy and sell zones (the green and red vertical lines/flashes).
The trend of the market, with the cloud as support/resistance.
The daily, weekly and monthly closes (as D, W and M).
And additional tools for the 3m for best entries and exits.
In addition to these, the indicator also comes with alerts for the flashes:
BUY ZONE
SELL ZONE
These alerts will allow you to know when some of the best opportunities in the market might be present.
This specific version of the indicator is for BTCUSD . However, I can adjust it to your favorite asset.
For access and questions, please message me here on TradingView.
PRIME - BTCUSDPRIME - BTCUSD is an indicator made specifically for BTCUSD on the 1 hour timeframe .
The indicator will help you know:
Potential areas to buy and sell (the flashes).
The trend of the market (the wavy cloud).
Important support/resistance areas (the wavy cloud).
And the daily, weekly and monthly closes (as D, W and M).
The indicator comes with the following alerts:
BUY BTC (1H)
SELL BTC (1H)
The alerts must be set on the 1 hour timeframe.
The goal of the indicator is to make trading simple and sustainable regardless of your lifestyle.
PS. The buy and sell flashes only show on the 1 hour; and the cloud and closes up to the 12 hour (to keep the chart clean).
PPS. For access and questions, message me here on TradingView. If you need it for another asset, I can adjust the settings for you.

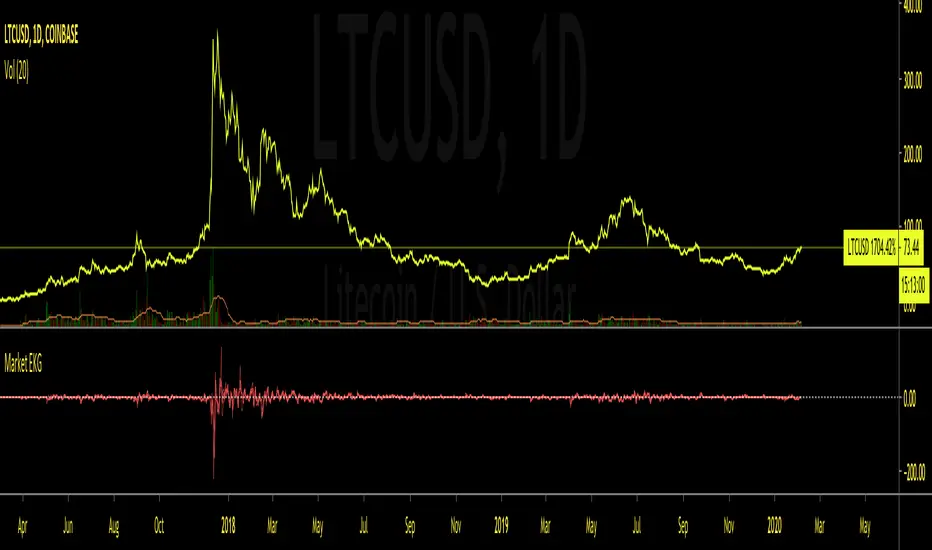
Market EKGShort Summary
This indicator takes the differences in the previous 4 period OHLC inputs, and compares them to the previously closed candle input. The difference is then placed into an oscillator that when all four inputs are scrolled back on, shows an EKG appearing oscillator / volatility measure for traders to use on indexes, tickers and markets that do not allow typical volume based indicators.
Full Summary
Named for its similar appearance to an EKG medical chart, this script takes the difference in relative averages of previous periods in a trend , and compares it to the most recent period input. This can be used as a price based volatility measure, useful in markets that may be limited by no valume measures or other indexes where volatility is useful to meeasure but will not allow volume initializations.
Steps taken
Taking Previous Period OHLC
Taking Previous 3 Periods OHLC Avgs
Difference Between #1 & #2 (Comparing most recent confirmation to relative trend
Plot Results
This RSI Script is intended for public use and can be shared / implemented as needed
Questions? I do not monitor my TradingView inbox. See email address in signature at the bottom of this page for contact information.
Use this script and its calculations as needed! No permission required.
Cheers,
Triton [BTC] [30m]Triton strategy was built by Stalex Bot developers and can be used on their platform. The backtest of this strategy showed a portfolio growth of almost 600% in the span of a year, beating Bitcoin by 167%. This strategy is just for trading BTC/USDT on the 30m candlestick chart.

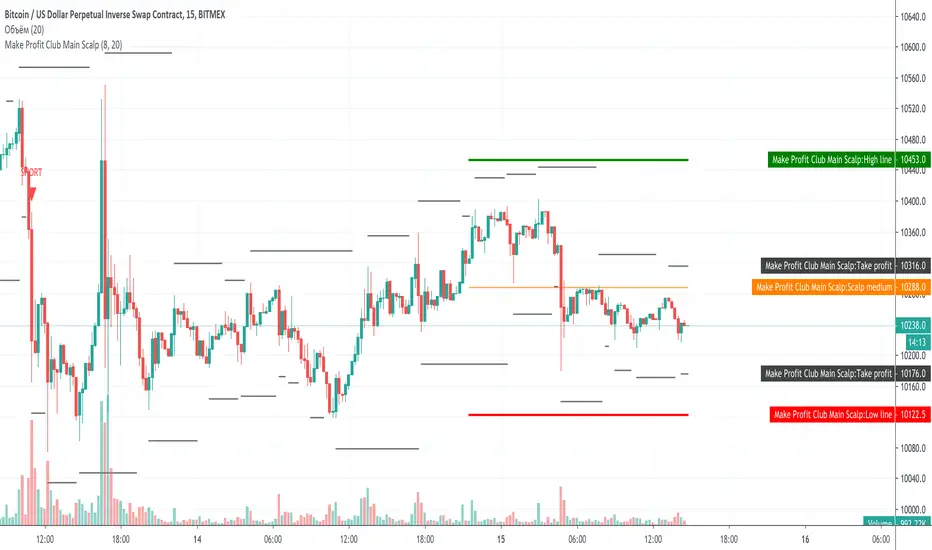
Make Profit Club Main ScalpThe main scalping indicator.
We use this indicator to trade for a short time in a TF of 5-15 minutes.
We have created takeprofit zones for you so that you can understand where we can get to and take your profit. these points are mostly very helpful.
There are basic settings that allow you to adjust the indicator individually for each situation; because of this, this indicator can be used for any exchange and any currency pair.
For Scalp trading, we use 3 different strategies available to our clients. If you enter them correctly, you can never see the minus sign.
Use the link below to obtain access to this indicator.