Indicator setupDescription of the "Setup Indicator"
Setup Indicator is a multifunctional trading tool that combines the power of a modified ATR indicator for trend determination and a classic ZigZag for identifying key market structures. It is designed to automatically detect reversal patterns "LL to HH" (bullish) and "HH to LL" (bearish), project target levels based on Fibonacci retracements, and visualize trading zones.
🎯 Philosophy and Utility
The indicator is built on the concept that significant price movements begin with the breakout of the previous structure (a higher low in an uptrend or a lower high in a downtrend). It helps the trader to:
- Objectively identify reversal points: Automatically detects "Lower Low -> Higher High" (LL->HH) formations for long positions and "Higher High -> Lower Low" (HH->LL) for short positions.
- Determine entry zones: Visualizes a "box" between key Fibonacci levels (38.2% and 60.6%), which serves as a potential area for trade entry.
- Project targets: Calculates and displays three target levels (0.84, 1.306, 1.618 for long and 0.16, -0.306, -0.618 for short) based on the magnitude of the initial impulse.
- Manage risk: Clearly marks the "structure break" level, upon reaching which the initial trading idea is invalidated.
⚙️ Operating Principle and Logic
1. ATR Trend (Base):
- Builds dynamic support and resistance levels based on the Average True Range (ATR) multiplied by a specified coefficient.
- Trend direction is determined by the position of the closing price relative to these levels. This is the main filter for the entire indicator.
2. ZigZag (Structure):
- Leaves only significant extremes (peaks and troughs) on the chart, filtering out market noise. The ZigZag length determines sensitivity.
3. Signal Filtering (The Heart of the System):
- A signal is considered valid only if it is confirmed by the ATR trend.
- For Long (LL to HH): The lower low (LL) must be formed in a downtrend according to the ATR, and the subsequent higher high (HH) — in an uptrend.
- For Short (HH to LL): The higher high (HH) must be formed in an uptrend according to the ATR, and the subsequent lower low (LL) — in a downtrend.
- This dual verification significantly improves signal quality.
🛠️ Indicator Settings
1. "ATR Trend Settings" Group
- ATR Period: Period for calculating the ATR. Smaller values make the trend more sensitive.
- Source: Price source used for calculation (default is hl2 - the average of High and Low).
- ATR Multiplier: Coefficient for expanding/narrowing the ATR bands. The higher the value, the less frequently the trend changes.
- Change ATR Calculation Method: Switches the ATR calculation between the standard method (ta.atr) and the SMA method (ta.sma(ta.tr)).
- Show ATR Support/Resistance Lines: Shows/hides the ATR trend lines on the chart.
2. "ZigZag Settings" Group
- ZigZag Length: Defines the minimum distance between extremes. Increase the value to find larger and more significant structures.
- Show ZigZag: Shows the ZigZag line.
- Show Only Current Structure (in the "Display Settings" group): A key setting. When enabled, the indicator removes all previous structures and displays only the most recent one, preventing chart clutter.
3. Visualization Settings
- Show Boxes: Shows the trading zone (between 38.2% and 60.6%).
- Box Length: The width of the box and all accompanying lines in bars.
- Show Targets: Shows the target lines and labels.
- Show Structure Break: Shows the structure break level line and label.
- Show HH/LL Labels: Shows "HH" and "LL" labels on the corresponding extremes.
- Show Connection Lines: Draws a line connecting the HH and LL extremes.
📊 Signal Interpretation
Bullish Signal (Long Setup)
1. Formation: A structure appears: LL (Lower Low), followed by HH (Higher High).
2. Visualization:
- Green Zone (Box): The area between 38.2% and 60.6% of the move from LL to HH. Considered as an area for entering long positions.
- Structure Break Level: The price level of the LL. A stop-loss is typically placed below this level.
- Targets: Three lines calculated based on Fibonacci extensions (0.84, 1.306, 1.618). Serve as potential take-profit levels.
Bearish Signal (Short Setup)
1. Formation: A structure appears: HH (Higher High), followed by LL (Lower Low).
2. Visualization:
- Red Zone (Box): The area between 38.2% and 60.6% of the move from HH to LL. Considered as an area for entering short positions.
- Structure Break Level: The price level of the HH. A stop-loss is typically placed above this level.
- Targets: Three lines calculated based on Fibonacci extensions (0.16, -0.306, -0.618).
⚡ Alerts
The indicator has built-in conditions for creating alerts in TradingView:
"LONG Signal" - Triggers when a bullish LL->HH structure appears.
"SHORT Signal" - Triggers when a bearish HH->LL structure appears.
💎 Conclusion and Usage Tips
Setup Indicator is not just an indicator, but a complete system for finding and trading structural reversals.
- For conservative traders: Use larger values for ZigZag Length and ATR Multiplier to find only the most significant and confirmed market moves.
- For active traders: Adjust the parameters for lower timeframes to find more trade setups.
- Always use the "Structure Break" level for risk management. This is an integral part of the system.
- Combine signals with the overall market context and support/resistance levels to increase the probability of success.
Disclaimer: This tool is intended to assist in analysis and is not a direct trading recommendation. All trading decisions are made independently and at your own risk.
Уровни

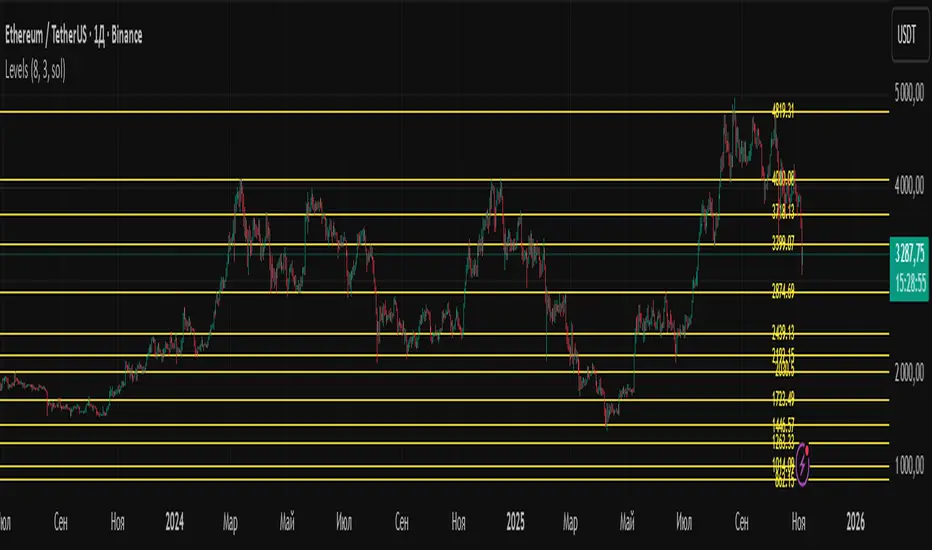
LevelsLevels is a powerful technical analysis tool that automatically identifies and displays key support and resistance levels on the chart. The indicator analyzes historical price data, detecting significant price levels where multiple reversals or price stops have occurred.
How the Indicator Works?
1. Identification of Reversal Points:
- The indicator tracks price extremes using an algorithm to identify local highs and lows
- A reversal point is recorded when:
- Uptrend: price reaches a new low for the last 10 bars
- Downtrend: price reaches a new high for the last 10 bars
2. Level Grouping:
- All found reversal points are analyzed and grouped into key levels
- Levels are combined if they fall within the specified percentage tolerance
3. Filtering Significant Levels:
- Only levels that have been tested the minimum number of times (set in settings) are preserved
- This ensures only statistically significant levels are displayed
How to Use the Indicator?
Trading Scenarios:
1. Bounce from Level:
- When price approaches an identified level, a bounce can be expected
- Opening positions on the bounce with protective stop-loss beyond the level
2. Level Breakout:
- Breaking through a key level may signal trend continuation
- Support level becomes resistance and vice versa
3. Consolidation near Level:
- Prolonged price presence near a level indicates its significance
- Strong movement can be expected after exiting consolidation
Advantages:
- Automatic level identification eliminates subjectivity
- Sensitivity customization for different timeframes and instruments
- Visual simplicity - only significant levels
Indicator Settings
Main Parameters:
- Show Key Levels - enable/disable level display
- Level Tolerance (%) - percentage tolerance for level grouping
- Smaller values: more levels, more precise
- Larger values: fewer levels, more significant
- Minimum Touches - minimum number of touches to form a level
Visual Settings:
- Level Color - level display color
- Level Style - line style (solid, dashed, dotted)
Limitations
- Levels are built only on available historical data
- Does not account for trading volumes
- Parameter adjustment may be required during high volatility periods
The indicator is particularly effective when combined with other analysis tools for signal confirmation.
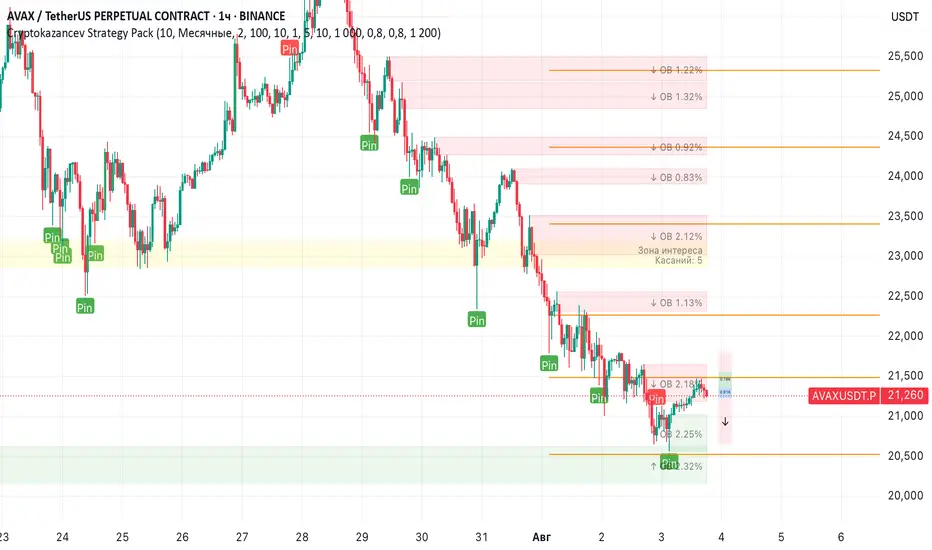
Cryptokazancev Strategy PackCryptokazancev Strategy Pack
Комплексный инструмент для анализа рыночной структуры / Comprehensive Market Structure Analysis Tool
🇷🇺 Описание на русском
Cryptokazancev Strategy Pack by ZeeZeeMon - это мощный набор инструментов для технического анализа, включающий:
• Ордерблоки (Order Blocks) с настройкой количества и цветов
• Пивоты (Pivot Points) различных таймфреймов
• Рыночную структуру с зонами Фибоначчи (0.618, 0.786)
• Разворотные конструкции (пинбары и поглощения)
• Зоны интереса на основе скопления свингов
📊 Основные функции:
1. Ордерблоки
- Автоматическое определение бычьих/медвежьих OB
- Настройка максимального количества блоков (до 30)
- Кастомизация цветов
2. Пивоты
- Поддержка таймфреймов: Дневные/Недельные/Месячные/Квартальные/Годовые
- Уровни Camarilla (P, R1-R4, S1-S4)
3. Рыночная структура
- Четкое определение тренда (UP/DOWN)
- Ключевые уровни Фибо (0.618 и 0.786)
- Настройка глубины анализа (10-1000 баров)
4. Разворотные конструкции
- Обнаружение пинбаров
- Обнаружение поглощений
- Настройка чувствительности
5. Зоны интереса
- Алгоритм кластеризации свингов
- Настройка через ATR-мультипликатор
- Лимит отображаемых зон
🇬🇧 English Description
ZeeZeeMon Pack is a comprehensive market analysis toolkit featuring:
• Order Blocks with customizable count and colors
• Pivot Points for multiple timeframes
• Market Structure with Fibonacci zones
• Reversal patterns (pinbars and engulfings)
• Interest Zones based on swing clustering
📊 Key Features:
1. Order Blocks
- Auto-detection of bullish/bearish OB
- Configurable max blocks (up to 30)
- Custom color schemes
2. Pivot Points
- Supports: Daily/Weekly/Monthly/Quarterly/Yearly
- Camarilla levels (P, R1-R4, S1-S4)
3. Market Structure
- Clear trend detection (UP/DOWN)
- Key Fibonacci levels (0.618 & 0.786)
- Adjustable analysis depth (10-1000 bars)
4. Reversal Patterns
- Smart pinbar detection
- ATR-based engulfing filter
- Sensitivity adjustment
5. Interest Zones
- Swing clustering algorithm
- ATR-multiplier configuration
- Display limit (up to 10 zones)
⚙️ Technical Highlights:
• Built with Pine Script v5
• Performance-optimized
• Well-commented code
• Flexible settings system
⚠️ Важно / Important:
Индикатор в бета-версии. Тестируйте перед использованием в реальной торговле.
This is BETA version. Please test before live trading.
💬 Поддержка / Support:
Комментарии к скрипту / Script comments section
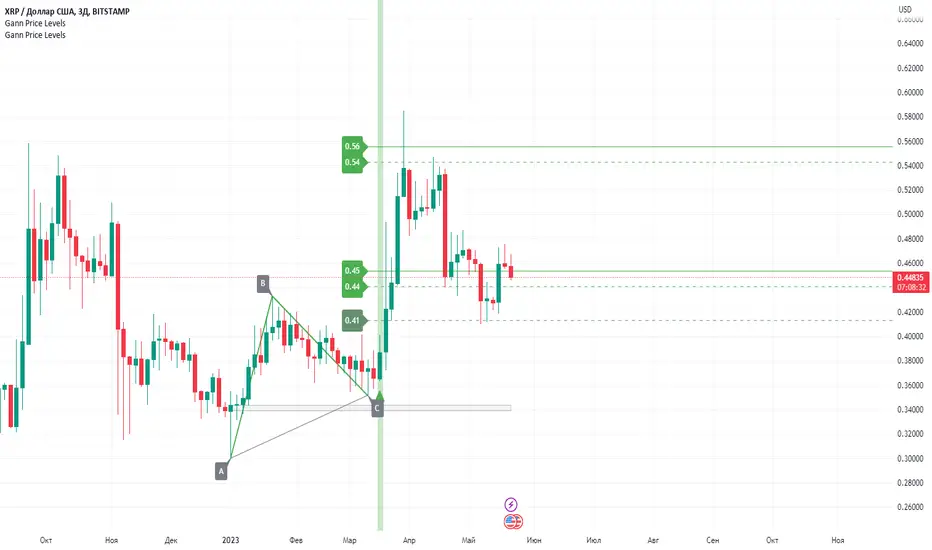
Gann Price LevelsGann Price Level is a powerful indicator based on the methods of the legendary trader William D. Gann. It provides traders with the ability to forecast future targets, both trending and retracement, based on just three anchor points and generates clear entry signals in the form of arrows. This indicator offers broad capabilities that assist traders in making informed decisions and optimizing their trading strategies. Here are a few key features of this indicator:
Calculation of future targets: Gann Price Level allows traders to determine potential price levels that may be reached in the future. It is based on the concept of geometric levels and numerical relationships, making it an effective tool for forecasting future price movements. Its algorithm incorporates geometry, mathematics, and Gann's angular relationships.
Three-point approach: One of the main advantages of Gann Price Level is its ability to work with only three anchor points. Traders need to specify three (ABC) points forming a triangle, and the indicator automatically calculates the target price levels. This simplifies the analysis process and makes it more intuitive.
Entry signals: In addition to forecasting target levels, Gann Price Level provides clear entry signals in the form of arrows. This helps traders identify optimal moments to enter positions, improving the accuracy of their trades.
Timeframes: Gann Price Level can be applied to various time intervals, including both short-term and long-term charts. This allows traders to adapt the indicator to their trading strategies and trade across different markets.
Versatility: Gann Price Level can be used to analyze various financial instruments, including stocks, forex, commodities, cryptocurrencies, and more. This makes it a versatile tool for traders operating in different market segments.
Another key feature of this indicator is the additional level calculation algorithm, which, when working with a trend, forms an optimal gray zone for forming point C, while when calculating retracement levels, it adds an additional magnetic target in the form of a gray zone.
Additionally, traders can combine this indicator with other indicators or chart patterns to obtain more accurate signals and confirmations. Moreover, Gann Price Level works effectively in both upward and downward trends, making it a flexible tool for traders of different trading styles. It can be used to determine potential support and resistance levels, as well as entry and exit points for positions.
Working with this indicator is straightforward. The user needs to select three (ABC) points forming a triangle, and the indicator will automatically calculate the future price targets. An entry arrow will also appear, enabling the user to enter the trade in a timely manner. The stop loss is placed slightly below point C (at the spread distance) for buy trades and above point C (at the spread distance) for sell trades. The first target is represented by a dashed line. Once this target is reached, a portion of the position (usually 50%) is closed, and the stop loss is moved to breakeven. The remaining part of the position is held until subsequent price levels based on personal preferences.
Construction rules:
When calculating targets in an upward trend, point A is below points BC, and point C is always between points AB.
When calculating targets in a downward trend, point A is above points BC, and point C is always between points AB.
When calculating retracement targets in an upward trend, point B is above points AC, point A is always between points BC, and point C is below AB.
When calculating retracement targets in a downward trend, point B is below points AC, point A is always between points BC, and point C is above AB.
This indicator relies entirely on the manual construction of the ABC points by the user.
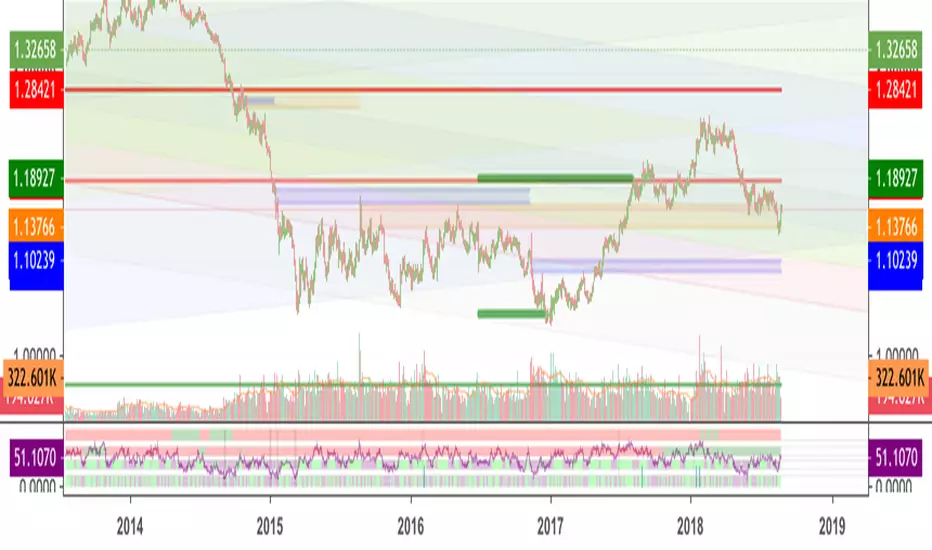
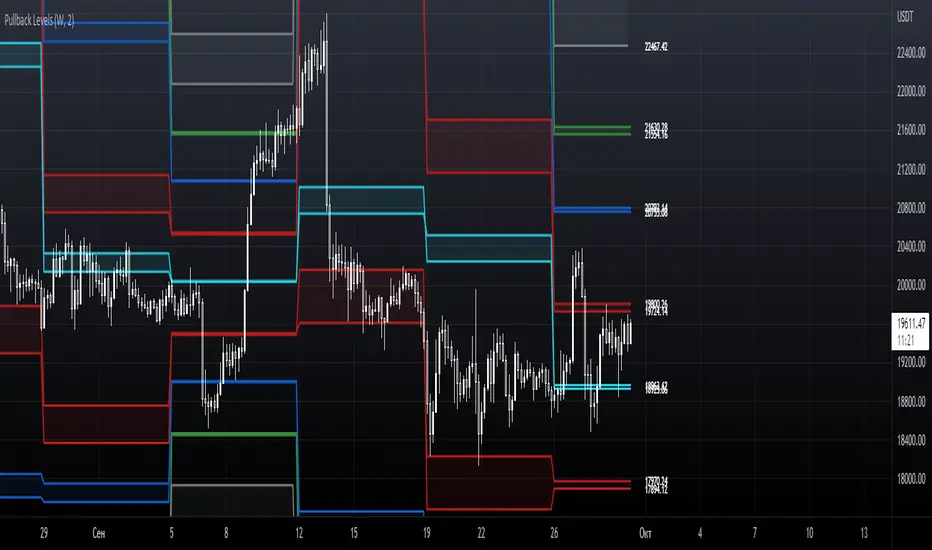
Pullback LevelsPullback Levels is a technical indicator for predicting large price movements by calculating support and resistance levels. It is used to determine the general market trend on different timeframes. Pullback levels are used when prices are built above or below them, indicating the priority direction of movement.
Analysis of support and resistance levels often coincides with the action levels of large players, similar to the analysis of a trend line. When analyzing Pullback levels, the first support and resistance levels are calculated using the width of the trading range and the volume traded during this period. The second support and resistance levels are calculated using the larger trading range width given the highs and lows.
It also provides the ability to flexibly adjust the levels, their visualization, style, calculation methods and the used timeframe. For the convenience of backtesting, all historical levels are saved on the chart. To analyze current price movements and determine pullbacks, all prices are displayed next to the levels.
-------------------------------------------
Pullback levels – технический индикатор для прогнозирования крупных ценовых движений путем расчета уровней поддержки и сопротивления . Используется для определения общего рыночного тренда на различных таймфреймах. Pullback levels используются при построение цены выше или ниже них, указывая на приоритетное направление движения.
Анализ уровней поддержки и сопротивления часто совпадает с уровнями действия крупных игроков, наподобие анализа трендовой линии. При анализе Pullback уровней первые уровни поддержки и сопротивления рассчитываются с использованием ширины торгового диапазона и объёмом проторгованным за этот период. Вторые уровни поддержки и сопротивления рассчитываются с использованием более старшей ширины торгового диапазона учитывая максимумы и минимумы.
Он так же предоставляет возможность гибкой настройки уровней - их визуальной составляющей, стиля, методов расчёта и используемого таймфрейма. Для удобства бэктестинга все исторические уровни сохраняются на графике. Для анализа текущих ценовых движений и определении точек разворота, все цены находятся рядом с уровнями.
Support Levels | Line Volume [dimon1ua]Accurate levels of support - resistance, for accurate entry at turning points.