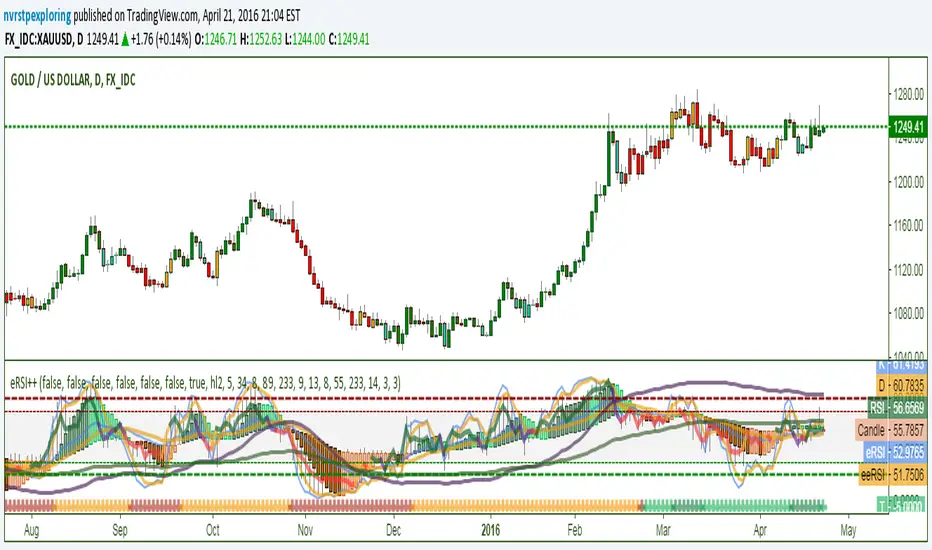
Contains RSI; EMA of RSI; EMA of EMA of RSI; Stochastic Oscillator; 2 Inverse Fisher Transforms on RSI - IFRSI89 and IFRSI233 XOVER on higher timeframes from oversold/overbought is useful signal; RSI Trend/Divergence Candles with color variation based on multiple RSI length detection of trend decay; Chart candle overlay coloring based on RSI, eRSI, and eeRSI EMA55 & EMA233 Xover indicator on bottom for trend direction with color variations for counter trend movements.
Açık kaynak kodlu komut dosyası

Gerçek TradingView ruhuyla, bu betiğin yazarı, yatırımcının anlayabilmesi ve doğrulayabilmesi için onu açık kaynak olarak yayınladı. Yazarın eline sağlık! Bunu ücretsiz olarak kullanabilirsiniz, ancak bu kodun bir yayında yeniden kullanımı Kullanım Koşulları ile yönetilir. Bir grafikte kullanmak için favorilere ekleyebilirsiniz.

Feragatname

Bilgiler ve yayınlar, TradingView tarafından sağlanan veya onaylanan finansal, yatırım, işlem veya diğer türden tavsiye veya tavsiyeler anlamına gelmez ve teşkil etmez. Kullanım Şartları'nda daha fazlasını okuyun.

Bu komut dosyasını bir grafikte kullanmak ister misiniz?
//eRSI++ by NVRSTPEXPLORING.
//Contains RSI; EMA of RSI; EMA of EMA of RSI; Stochastic Oscillator;
//2 Inverse Fisher Transforms on RSI - IFRSI89 and IFRSI233 XOVER on higher timeframes from oversold/overbought is useful signal
//RSI Trend/Divergence Candles with color variation based on multiple RSI length detection of trend decay
//Chart candle overlay coloring based on RSI, eRSI, and eeRSI
//EMA55 & EMA233 Xover indicator on bottom for trend direction with color variations for counter trend movements
study(title="eRSI++")

//Inputs
HC = input(title='Hide RSI Candles?', type=bool, defval=true)
HO = input(title='Hide Color Overlay?', type=bool, defval=true)
HS = input(title='Hide STOCH?', type=bool, defval=true)
HT = input(title='Hide HTF EMA TrendBar?', type=bool, defval=false)
HF = input(title='Hide Fisher?', type=bool, defval=false)
HE = input(title='Hide eRSI?', type=bool, defval=true)
HL = input(title='Use high/low?', type=bool, defval=true)
src2 = input(title='Source Series:', type=source, defval=hl2)
len0= input(5, minval=1, title="Candle Fast-5:")
len4= input(34, minval=1, title="Candle Slow-34:")
sm1 = input(title='Candle Smooth-8:', type=integer, defval=8)
sm2 = input(title='Fisher-89:', type=integer, defval=89)
sm3 = input(title='Fisher-233:', type=integer, defval=233)
len1 = input(9, minval=1, title="RSI Length-9:")
len2 = input(13, minval=1, title="EMA of RSI Length-13:")
len3 = input(8, minval=1, title="EMA of eRSI Length-8:")
len5 = input(55, minval=1, title="eRSI Fast-55:")
len6 = input(233, minval=1, title="eRSI Slow-233:")
len7= input(14, minval=1, title="Stoch Length-14:")
len8= input(3, minval=1, title="K-3:")
len9= input(3, minval=1, title="D-3:")

//Variables
src = close
up = rma(max(change(src), 0), len1)
dn = rma(-min(change(src), 0), len1)
rsi = dn == 0 ? 100 : up == 0 ? 0 : 100 - (100 / (1 + up / dn))
eRSI = ema(rsi,len2)
eeRSI = ema(eRSI,len3)
eRSIF = ema(src,len5)
eRSIS = ema(src,len6)
fr = rsi(src2, len0)
//Fast RSI and Slow RSI
sr = rsi(src2, len4)
sfr = sma(fr, sm1)
//Smooth Fast RSI and Smooth Slow RSI
ssr = sma(sr, sm1)
rh = HL ? max(rsi(high, len0), rsi(high, len4)) : max(fr, sr)
//RSI High Low for Candles
rl = HL ? min(rsi(low, len0), rsi(low, len4)) : min(fr, sr)
UpT= eRSIF>=eRSIS
//Uptrend and Downtrend
DnT= eRSIS>eRSIF
Up1=sfr>=ssr
isExp=abs(sfr-ssr)>=abs(sfr[1]-ssr[1])
k1 = ema(stoch(close, high, low, len7), len8)
d1 = ema(k1, len9)
//Inverse Fisher RSI
calc_ifish_rsi(series, sm2) =>
    v1=0.1*(series-50)
    v2=wma(v1,sm2)
    ifish=(((((exp(2*v2)-1)/(exp(2*v2)+1))+1)*100)/2)
    ifish

calc_ifish_rsi2(series, sm3) =>
    v1=0.1*(series-50)
    v2=wma(v1,sm3)
    ifish2=(((((exp(2*v2)-1)/(exp(2*v2)+1))+1)*100)/2)
    ifish2

//Plot ALL the Things
h1= hline(80, title="OverBoughtStochastic", linestyle=dashed, linewidth=2, color=maroon)
h2= hline(70, title="OverBoughtRSI", linestyle=dashed, linewidth=1, color=maroon)
h3= hline(30, title="OverSoldRSI", linestyle=dashed, linewidth=1, color=green)
h4= hline(20, title="OverSoldStochastic", linestyle=dashed, linewidth=2, color=green)
fill(h2, h3, color=gray, transp=90)
plotcandle(HC ? na: ssr, rh, rl, sfr, title='Candle', color=Up1 and isExp?#6CA77C :Up1 and not isExp? #71EEA3 :not Up1 and isExp?#b85d00: #eebca1)
p1= plot(HS? na: k1, title="K", linewidth=2, color=#4885ed)
p2= plot(HS? na: d1, title="D", linewidth=3, color=#EF9F07)
p3= plot(HE? na: eRSI, title="eRSI", style=line, linewidth=2, color=#4885ed)
p4= plot(HE? na: eeRSI, title="eeRSI", style=line, linewidth=3, color=#EF9F07)
p5= plot(rsi, title="RSI", style=line, linewidth=4, color= eRSI > eeRSI and rsi > eeRSI ? #0b6125 : eRSI >= eeRSI and rsi <= eeRSI ? #6B229F: eRSI < eeRSI and rsi < eeRSI ? #fd3232 : eRSI <= eeRSI and rsi >= eeRSI ? #ffbb39 : na)
//Alt color scheme plot(rsi, title="RSI", style=line, linewidth=4, color= eRSI > eeRSI and rsi > eeRSI ? green : eRSI >= eeRSI and rsi <= eeRSI ? #1ABC9C: eRSI < eeRSI and rsi < eeRSI ? red : eRSI <= eeRSI and rsi >= eeRSI ? #F39C12 : na)
p6= plot(HF? na: calc_ifish_rsi(rsi(src, len1),sm2), color=#4A235A, title='F89', linewidth=3)
p7= plot(HF? na: calc_ifish_rsi2(rsi(src, len1),sm3), color=#335A23, title='F233', linewidth=3)
plot(HT? na: 0-5, title="T", style=cross, linewidth=4, color=UpT and Up1? #1E8449 :UpT and not Up1? #28B463 : DnT and not Up1? #B03A2E : DnT and Up1? #F39C12: na)
barcolor(HO? na: eRSI > eeRSI and rsi > eeRSI ? green : eRSI >= eeRSI and rsi <= eeRSI ? #1ABC9C : eRSI < eeRSI and rsi < eeRSI ? red : eRSI <= eeRSI and rsi >= eeRSI ? #F39C12 : na)